癌睾丸基因的基因表达程序分析
Gene expression program analysis of cancer-testis genes
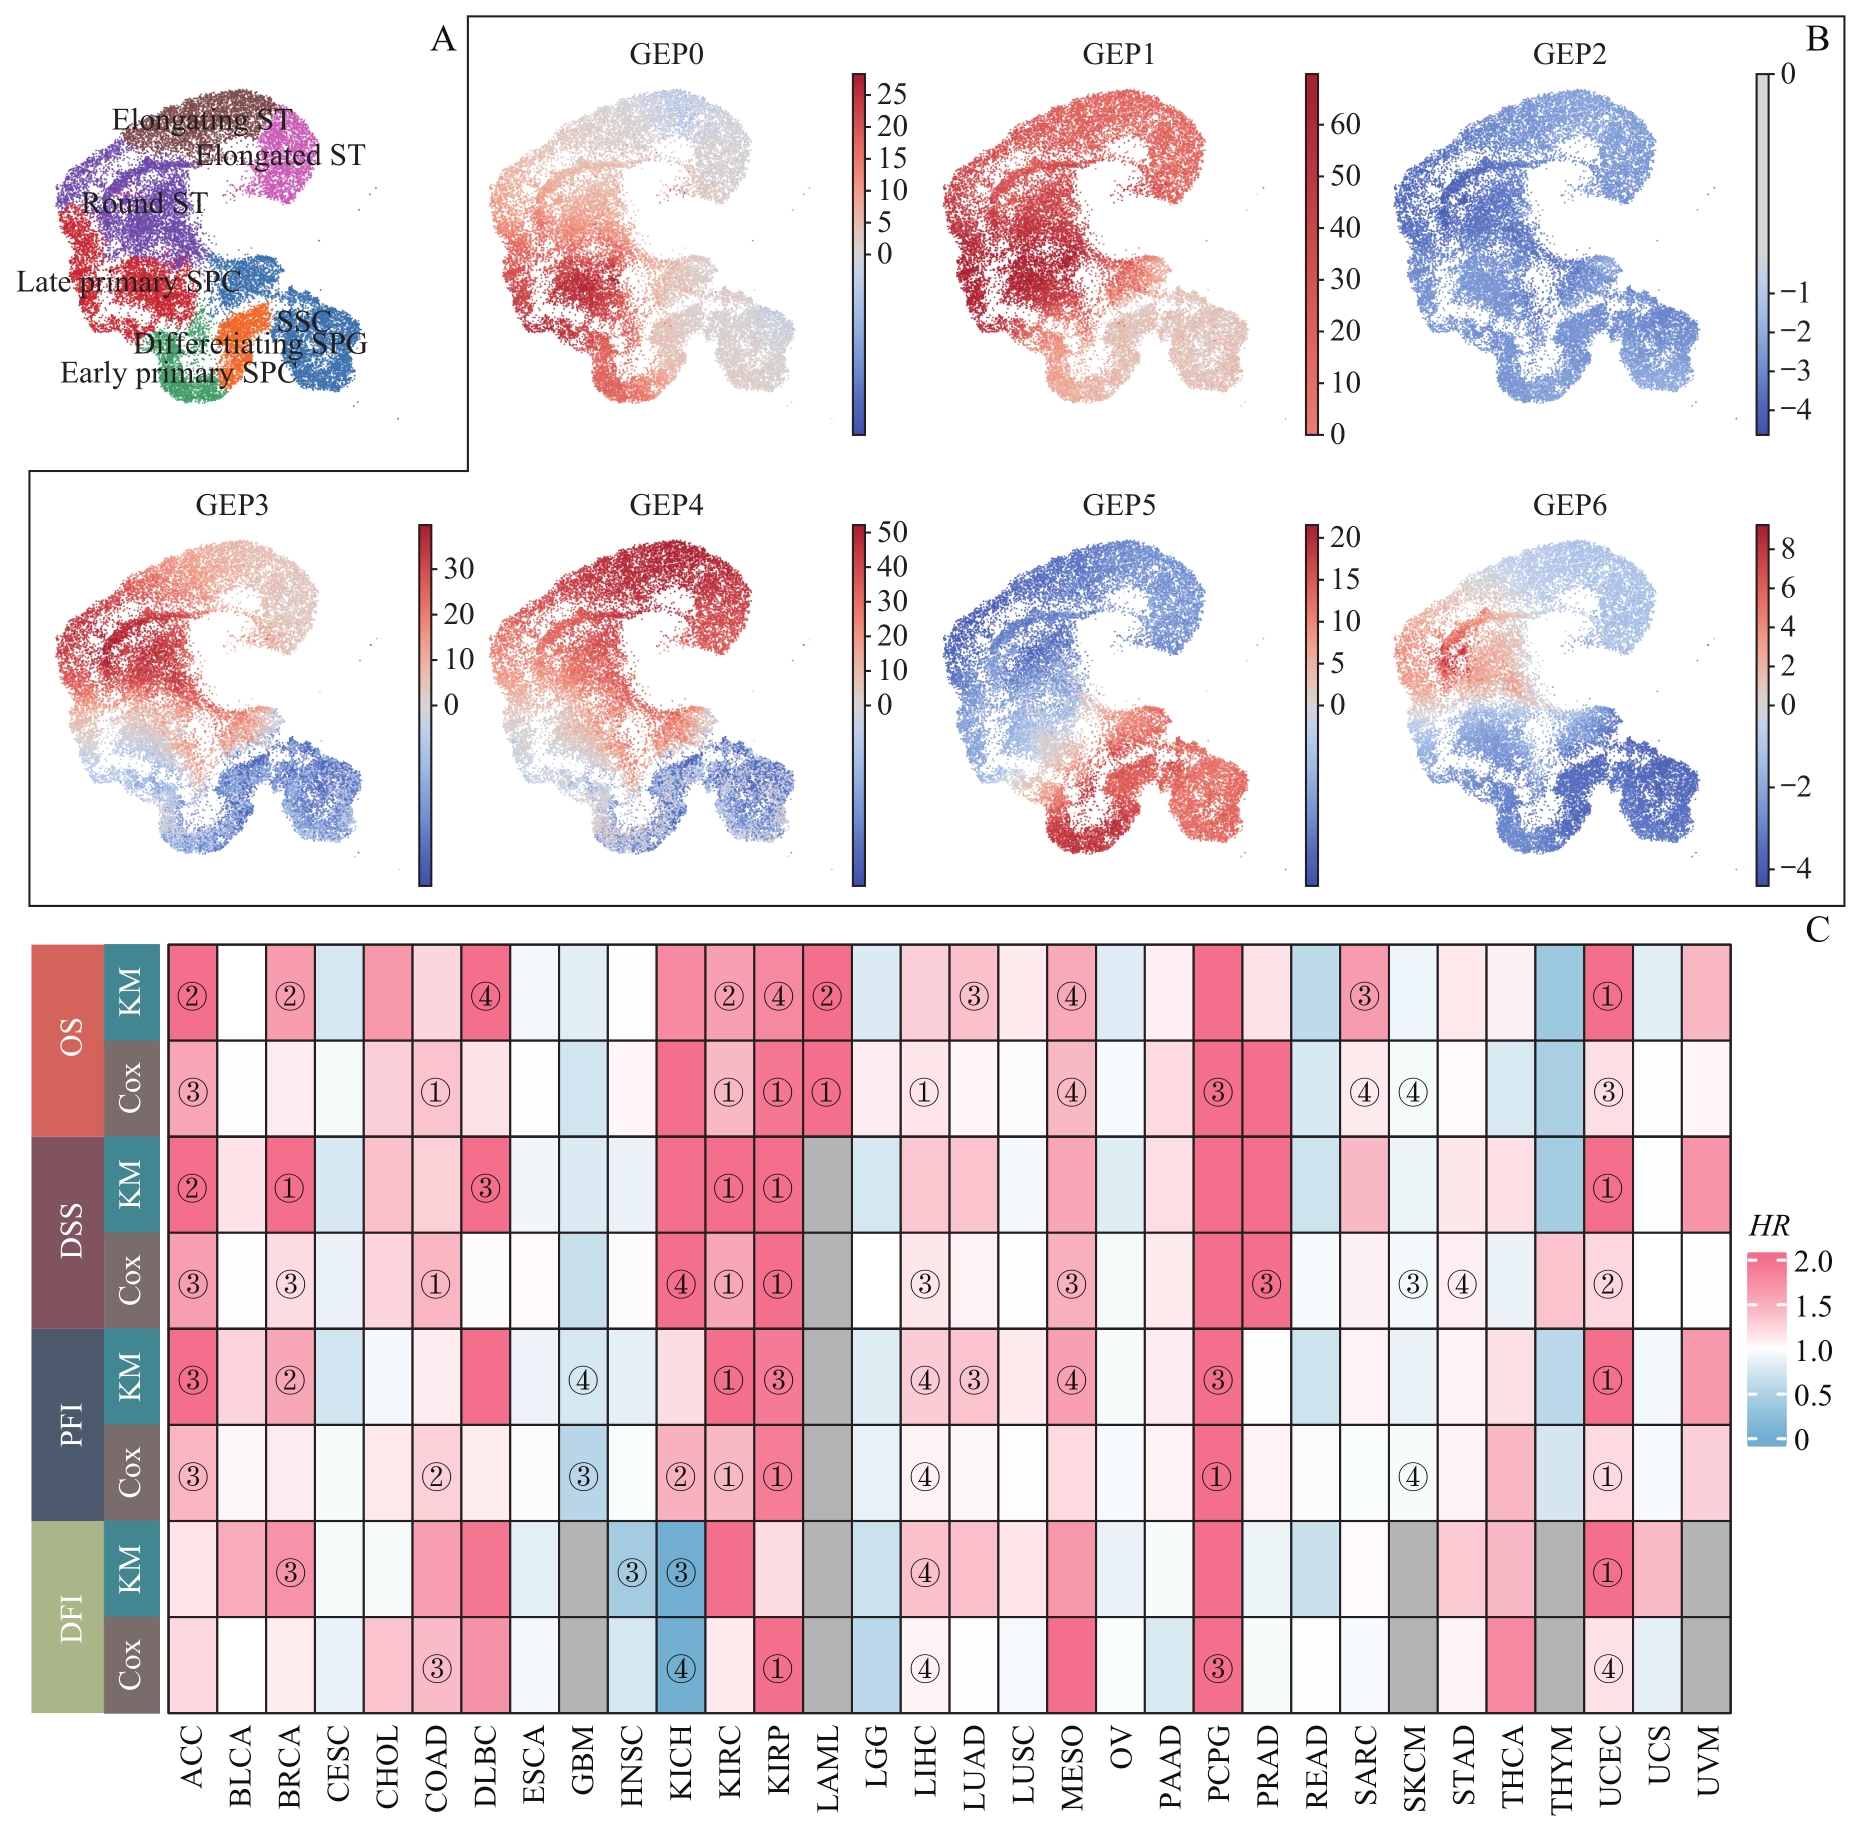
Note:A. Single-cell map of testis germ line cells. B. The activity of GEP in testis germ line cells. The colors in the panel represent the degree of activity of each GEP. The closer the GEP is to red, the more active it is, and the closer the GEP is to blue, the more inhibited it is. C. Relationship between GEP5 activity and prognosis in different cancer types. OS—overall survival; PFI—progression free interval; DFI—disease free interval. The colors represent the hazard ratio (HR) of Kaplan-Meier (KM) survival analysis and Cox regression analysis. White means HR=1; pink means HR=2; light blue means HR=0; gray indicates missing data. ①P<0.001; ②P<0.01; ③P<0.05; ④P<0.10.