[18F]F-FMISO和[18F]F-FLT PET/CT双核素显像预测胰腺癌耐药性的体内研究
[18F]F-FMISO and [18F]F-FLT PET/CT dual-nuclide imaging for in vivo prediction of drug resistance in pancreatic cancer
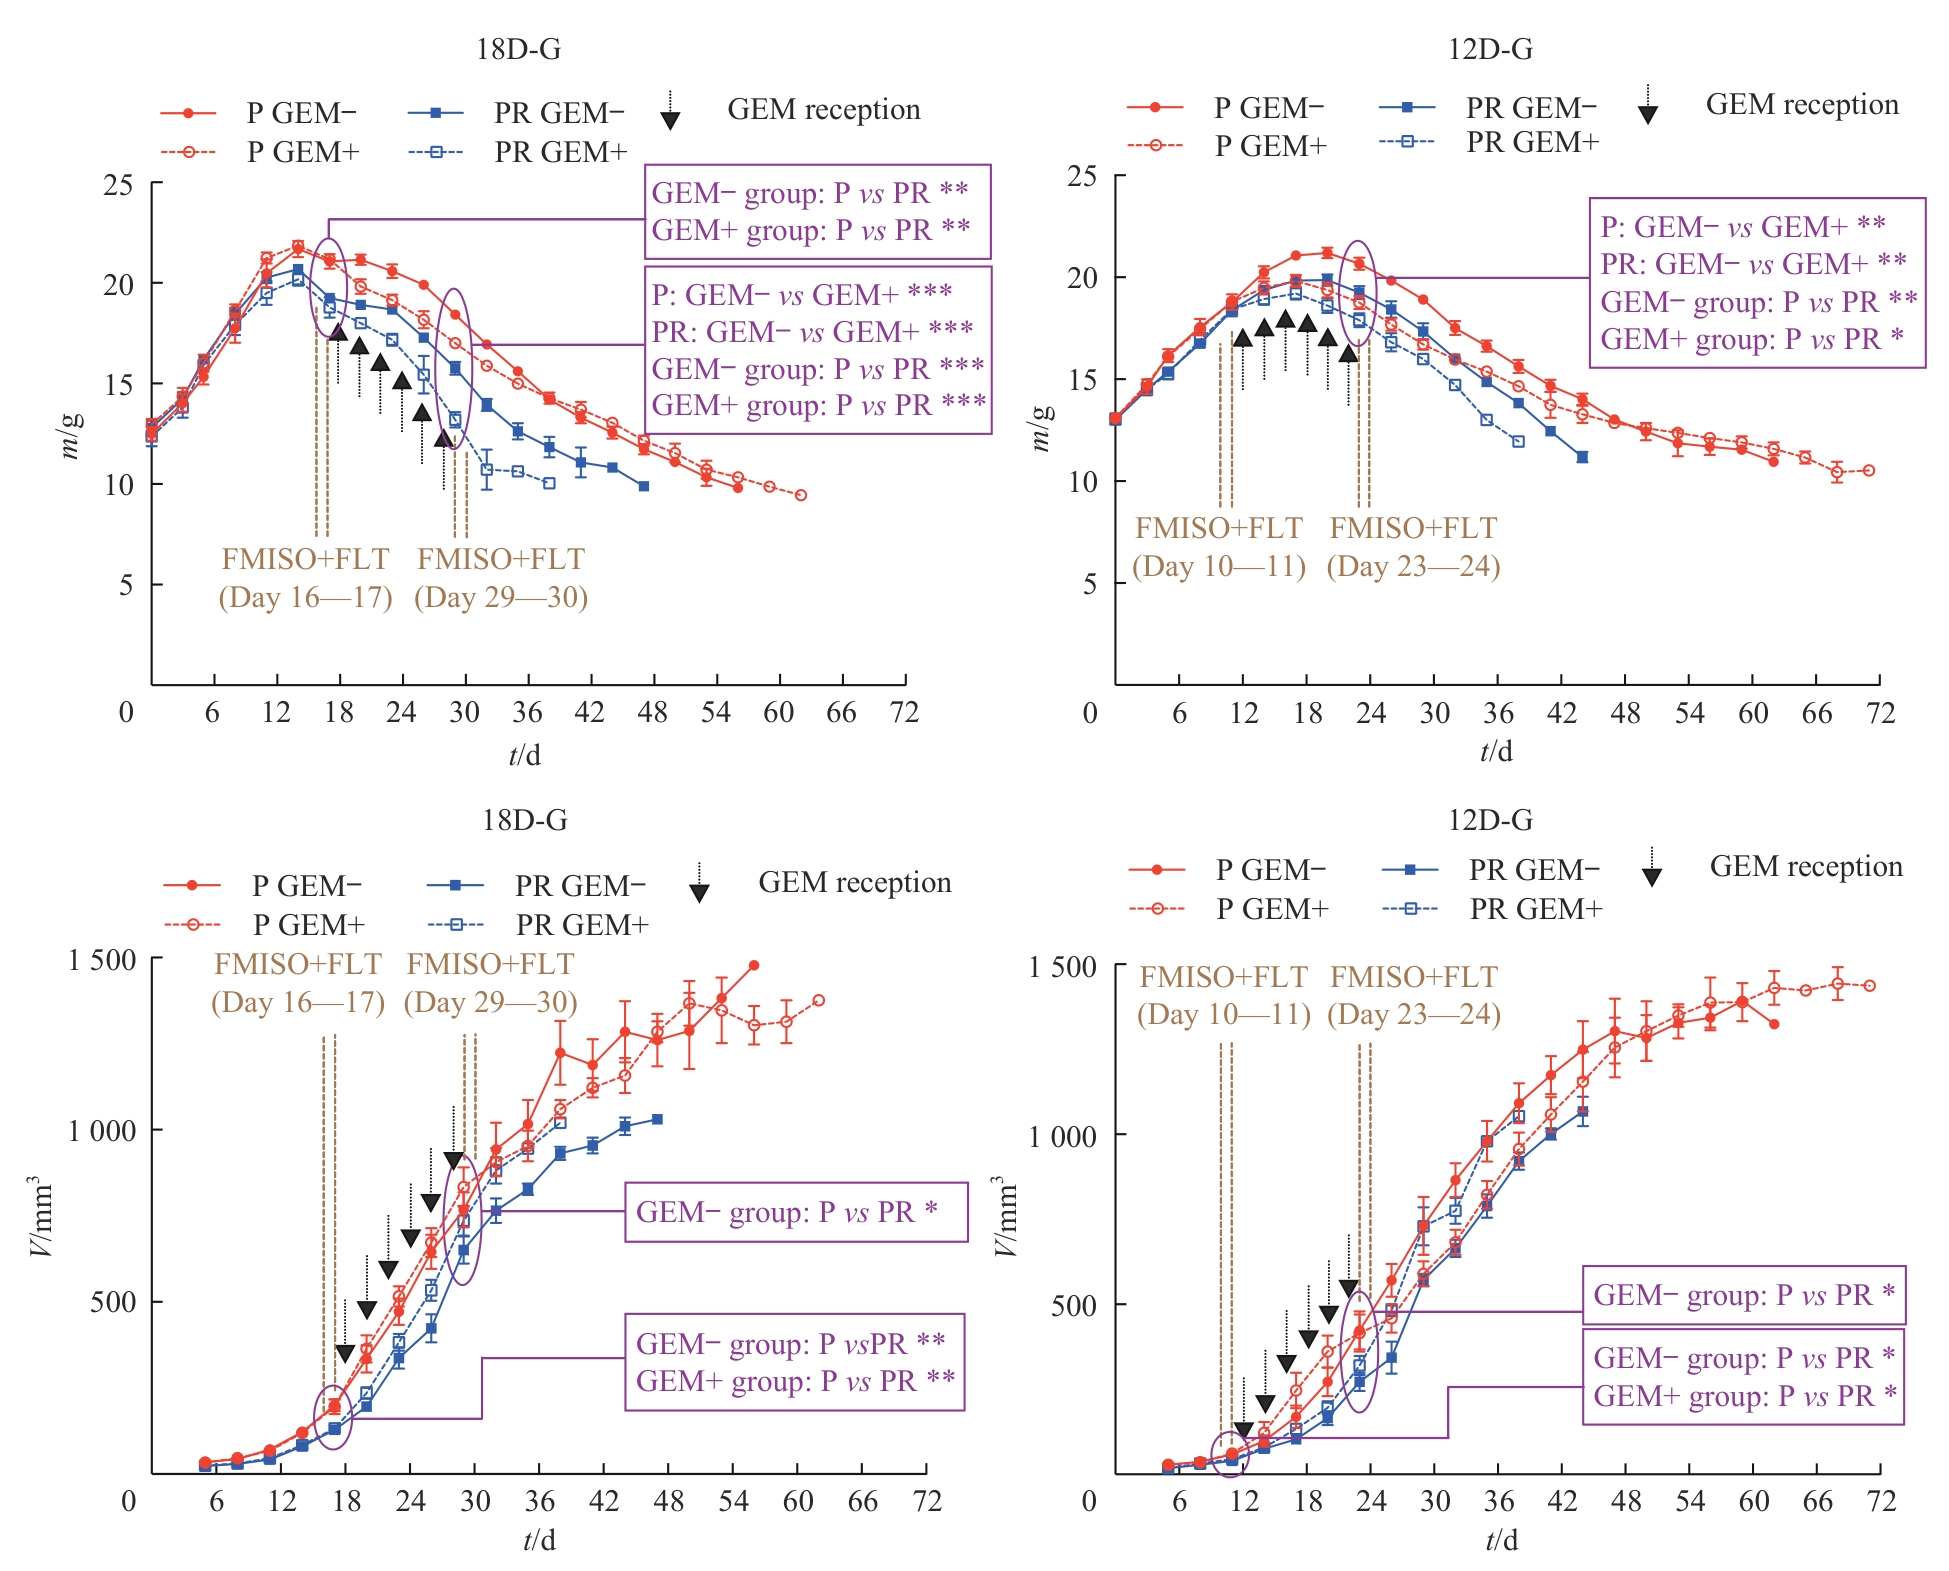
Note: After inoculation of tumor cells, treatment was initiated on day 18 (18D-G) or day 12 (12D-G). The GEM+ group received intraperitoneal injections of 1 μg/kg GEM every other day, while the GEM- group received intraperitoneal injections of 20 μl PBS every other day. The treatment was administered 6 times. The arrows indicate the time points of GEM administration. Each subgroup: n=3. ?—P<0.05; ??—P<0.01; ???—P<0.001.
The purple circles indicate the statistical differences in weight of mice and volume of tumor before and after treatment in each group.
Weight of mice?GEM+ group vs GEM- group: P<0.001 after the final treatment in 18D-G (P); P=0.001 after the final treatment in 18D-G (PR); P=0.002 after the final treatment in 12D-G (P); P=0.007 after the final treatment in 12D-G (PR). P group vs PR group: P=0.002 before treatment and P<0.001 after the final treatment in 18D-G (GEM-) and in 18D-G (GEM+); P=0.004 after the final treatment in 12D-G (GEM-); P=0.031 after the final treatment in 12D-G (GEM+).
Volume of tumor?P group vs PR group: P=0.003 before treatment and P=0.036 after the final treatment in 18D-G (GEM-); P=0.010 before treatment in 18D-G (GEM+); P=0.024 before treatment and P=0.014 after the final treatment in 18D-G (GEM-); P=0.030 before treatment in 18D-G (GEM+).