血液样本中DNA与RNA提取效率的研究
Comparison of DNA and RNA extraction efficiency from blood
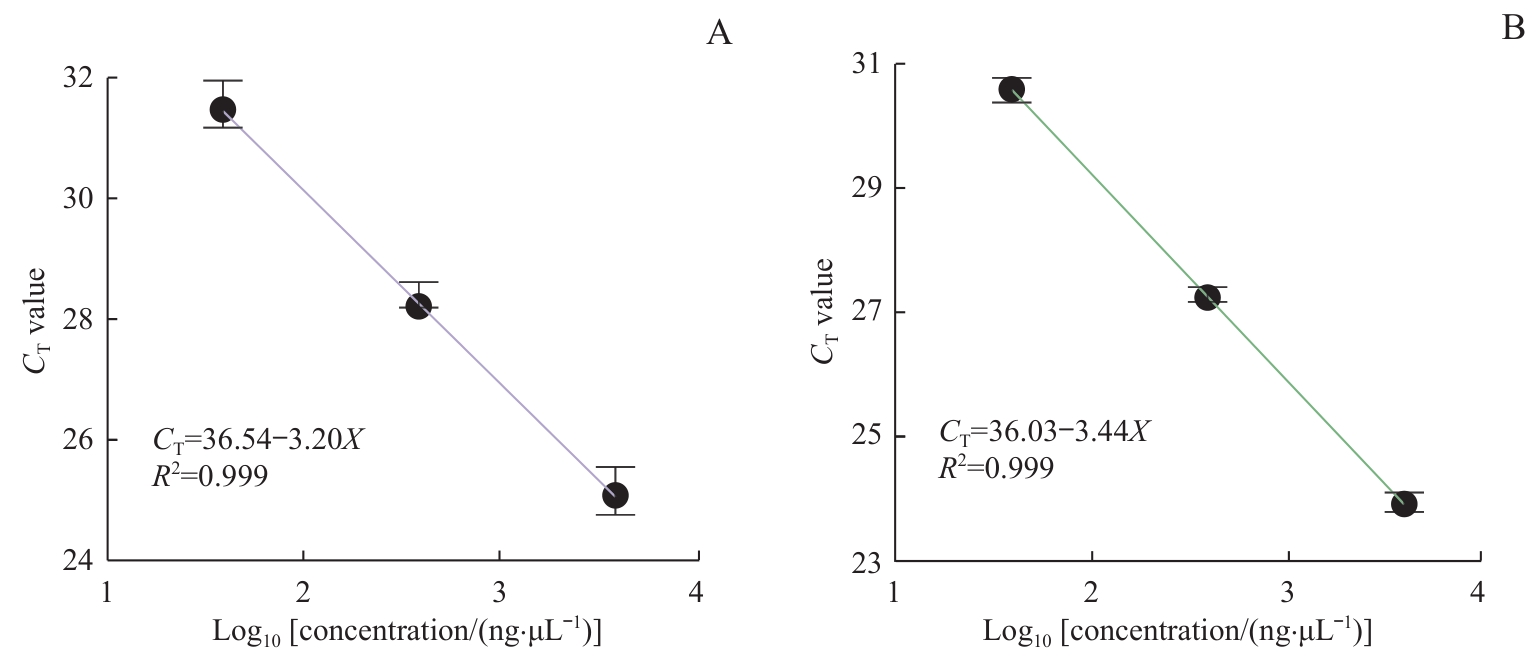
Note: A. Standard curve plotted based on DNA concentration and CT value after qPCR reaction using amplicon 1 with an amplified DNA fragment length of 103 bp. B. Standard curve plotted based on DNA concentration and CT value after qPCR reaction using amplicon 2 with an amplified DNA fragment length of 71 bp. The correlation coefficients (R²) for the standard curves are close to 1 (R²≥0.999), indicating a strong linear relationship between logarithmic value of sample concentration (ng/μL) and CT signal intensity.