Journal of Shanghai Jiao Tong University (Medical Science) ›› 2024, Vol. 44 ›› Issue (8): 1023-1029.doi: 10.3969/j.issn.1674-8115.2024.08.011
• Clinical research • Previous Articles
WU Wangshu( ), WANG Minzhou, SONG Ahui, ZHAO Bingru, LU Jiayue, HONG Wenkai, GU Leyi, XIE Kewei, LU Renhua()
Received:2024-04-10
Accepted:2024-05-13
Online:2024-08-28
Published:2024-08-27
Contact:
LU Renhua
E-mail:wangshu0825@qq.com;lurenhua1977@hotmail.com
Supported by:CLC Number:
WU Wangshu, WANG Minzhou, SONG Ahui, ZHAO Bingru, LU Jiayue, HONG Wenkai, GU Leyi, XIE Kewei, LU Renhua. Efficacy and safety of compound amino acid capsules in the treatment of malnutrition and calcium and phosphorus metabolism disorders in maintenance hemodialysis patients[J]. Journal of Shanghai Jiao Tong University (Medical Science), 2024, 44(8): 1023-1029.
Add to citation manager EndNote|Ris|BibTeX
URL: https://xuebao.shsmu.edu.cn/EN/10.3969/j.issn.1674-8115.2024.08.011
| Item | Treatment group (n=21) | Control group (n=19) | t/χ2/U value | P value |
|---|---|---|---|---|
| Age/year | 64.67±10.75 | 59.37±12.78 | 1.424 | 0.163 |
| Male/n(%) | 14 (66.7) | 16 (84.2%) | 0.835① | 0.361 |
| Dialysis duration/month | 29.1 (64.4) | 34.9 (58.1) | 181.000② | 0.616 |
| Baseline body mass index/(kg·m-2) | 20.34±2.59 | 22.91±4.40 | -1.251 | 0.219 |
| Baseline Kt /V | 1.60±0.40 | 1.57±0.26 | 0.211 | 0.834 |
| Baseline ultrafiltration volume/mL | 2 400.00±989.95 | 2 742.11±697.07 | -1.273 | 0.211 |
| Primary renal disease/n(%) | 10.608① | 0.035 | ||
| Chronic glomerulonephritis | 6 (28.6) | 6 (31.6) | ||
| Hypertensive nephrosclerosis | 4 (20.0) | 4 (21.1) | ||
| Diabetic nephropathy | 0 (0) | 1 (5.3) | ||
| Polycystic kidney | 3 (7.5) | 0 (0) | ||
| Other | 5 (12.5) | 0 (0) | ||
| Unknown causes | 3 (27.5) | 8 (42.1) |
Tab 1 Comparison of general characteristics between the two groups
| Item | Treatment group (n=21) | Control group (n=19) | t/χ2/U value | P value |
|---|---|---|---|---|
| Age/year | 64.67±10.75 | 59.37±12.78 | 1.424 | 0.163 |
| Male/n(%) | 14 (66.7) | 16 (84.2%) | 0.835① | 0.361 |
| Dialysis duration/month | 29.1 (64.4) | 34.9 (58.1) | 181.000② | 0.616 |
| Baseline body mass index/(kg·m-2) | 20.34±2.59 | 22.91±4.40 | -1.251 | 0.219 |
| Baseline Kt /V | 1.60±0.40 | 1.57±0.26 | 0.211 | 0.834 |
| Baseline ultrafiltration volume/mL | 2 400.00±989.95 | 2 742.11±697.07 | -1.273 | 0.211 |
| Primary renal disease/n(%) | 10.608① | 0.035 | ||
| Chronic glomerulonephritis | 6 (28.6) | 6 (31.6) | ||
| Hypertensive nephrosclerosis | 4 (20.0) | 4 (21.1) | ||
| Diabetic nephropathy | 0 (0) | 1 (5.3) | ||
| Polycystic kidney | 3 (7.5) | 0 (0) | ||
| Other | 5 (12.5) | 0 (0) | ||
| Unknown causes | 3 (27.5) | 8 (42.1) |
| Item | Treatment group (n=21) | Control group (n=19) | t/U value | P value |
|---|---|---|---|---|
| Albumin/(g·L-1) | 35.20±3.05 | 37.47±2.19 | 102.000① | 0.008 |
| Prealbumin/(mg·L-1) | 284.51±77.54 | 312.38±61.80 | 1.248 | 0.220 |
| Hemoglobin/(g·L-1) | 102.14±14.64 | 112.05±15.52 | 2.078 | 0.045 |
| Ferritin/(μg·L-1) | 454.50 (390.90) | 247.70 (362.00) | 127.000① | 0.050 |
| Serum phosphorus/(mmol·L-1) | 2.09±0.35 | 1.87±0.38 | 125.500① | 0.045 |
| Serum calcium/(mmol·L-1) | 1.77±0.51 | 2.21±0.25 | 68.500① | 0.000 |
| 1,25-(OH)2-D3/(ng·mL-1) | 14.59±5.03 | 13.87±6.45 | 0.382 | 0.705 |
| iPTH/(pg·mL-1) | 221.00 (248.45) | 147.05 (194.33) | 155.000① | 0.338 |
| hsCRP/(mg·L-1) | 2.55 (8.81) | 1.53 (2.19) | 106.000① | 0.018 |
Tab 2 Comparison of baseline parameters between the two groups
| Item | Treatment group (n=21) | Control group (n=19) | t/U value | P value |
|---|---|---|---|---|
| Albumin/(g·L-1) | 35.20±3.05 | 37.47±2.19 | 102.000① | 0.008 |
| Prealbumin/(mg·L-1) | 284.51±77.54 | 312.38±61.80 | 1.248 | 0.220 |
| Hemoglobin/(g·L-1) | 102.14±14.64 | 112.05±15.52 | 2.078 | 0.045 |
| Ferritin/(μg·L-1) | 454.50 (390.90) | 247.70 (362.00) | 127.000① | 0.050 |
| Serum phosphorus/(mmol·L-1) | 2.09±0.35 | 1.87±0.38 | 125.500① | 0.045 |
| Serum calcium/(mmol·L-1) | 1.77±0.51 | 2.21±0.25 | 68.500① | 0.000 |
| 1,25-(OH)2-D3/(ng·mL-1) | 14.59±5.03 | 13.87±6.45 | 0.382 | 0.705 |
| iPTH/(pg·mL-1) | 221.00 (248.45) | 147.05 (194.33) | 155.000① | 0.338 |
| hsCRP/(mg·L-1) | 2.55 (8.81) | 1.53 (2.19) | 106.000① | 0.018 |
| Time | Treatment group (n=21) | Control group (n=19) | ||||
|---|---|---|---|---|---|---|
| Serum albumin/(g·L-1) | t value① | P value① | Serum albumin/(g·L-1) | t value① | P value① | |
| Baseline | 35.20±3.05 | ‒ | ‒ | 37.47±2.19 | ‒ | ‒ |
| 3-month | 36.41±3.74 | 1.700 | 0.105 | 38.57±2.92 | 2.057 | 0.054 |
| 6-month | 37.53±2.75 | 3.574 | 0.002 | 38.01±3.22 | 1.173 | 0.256 |
| 9-month | 39.42±2.73 | 5.599 | 0.000 | 38.92±1.73 | 3.670 | 0.002 |
Tab 3 Comparison of serum albumin between the two groups
| Time | Treatment group (n=21) | Control group (n=19) | ||||
|---|---|---|---|---|---|---|
| Serum albumin/(g·L-1) | t value① | P value① | Serum albumin/(g·L-1) | t value① | P value① | |
| Baseline | 35.20±3.05 | ‒ | ‒ | 37.47±2.19 | ‒ | ‒ |
| 3-month | 36.41±3.74 | 1.700 | 0.105 | 38.57±2.92 | 2.057 | 0.054 |
| 6-month | 37.53±2.75 | 3.574 | 0.002 | 38.01±3.22 | 1.173 | 0.256 |
| 9-month | 39.42±2.73 | 5.599 | 0.000 | 38.92±1.73 | 3.670 | 0.002 |
| Comparison | Serum albumin increase of treatment group/[g·L-1 (95% CI)] | Serum albumin increase of control group/[g·L-1 (95% CI)] | t value | P value |
|---|---|---|---|---|
| 3-month vs baseline | 1.21 (-0.27‒2.69) | 1.10 (-0.02‒2.22) | 0.121 | 0.904 |
| 6-month vs baseline | 2.33 (0.97‒3.70) | 0.53 (-0.42‒1.48) | 2.222 | 0.032 |
| 9-month vs baseline | 4.22 (2.65‒5.80) | 1.08 (0.46‒1.71) | 3.877 | 0.001 |
Tab 4 Comparison of serum albumin increase between the two groups
| Comparison | Serum albumin increase of treatment group/[g·L-1 (95% CI)] | Serum albumin increase of control group/[g·L-1 (95% CI)] | t value | P value |
|---|---|---|---|---|
| 3-month vs baseline | 1.21 (-0.27‒2.69) | 1.10 (-0.02‒2.22) | 0.121 | 0.904 |
| 6-month vs baseline | 2.33 (0.97‒3.70) | 0.53 (-0.42‒1.48) | 2.222 | 0.032 |
| 9-month vs baseline | 4.22 (2.65‒5.80) | 1.08 (0.46‒1.71) | 3.877 | 0.001 |
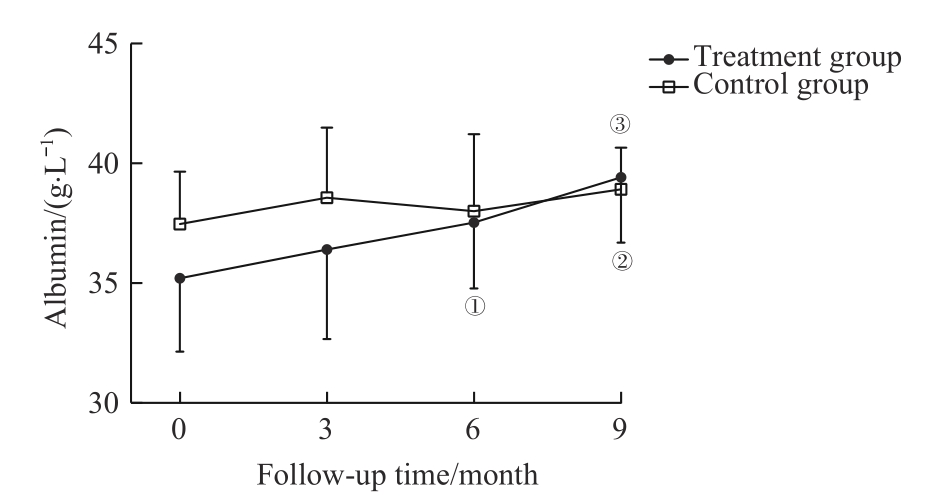
Fig 1 Comparison of serum albumin between the two groups
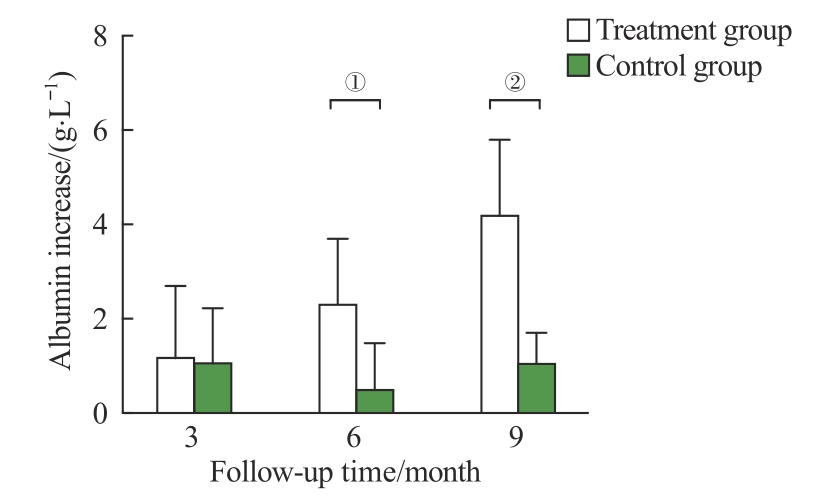
Fig 2 Comparison of serum albumin increase between the two groups
| Group | Serum prealbumin/(mg·L-1) | t/Z value① | P value① | Hemoglobin/ (g·L-1) | t value① | P value① | Serum ferritin/(μg·L-1) | t/Z value① | P value① |
|---|---|---|---|---|---|---|---|---|---|
| Treatment group | |||||||||
| Baseline | 284.51±77.54 | ‒ | ‒ | 102.14±14.64 | ‒ | ‒ | 454.50 (390.90) | ‒ | ‒ |
| 3-month | 267.21±78.38 | -1.382 | 0.183 | 108.24±15.57 | 2.192 | 0.040 | 580.40 (639.70) | 2.994 | 0.007 |
| 6-month | 316.58±80.11 | -2.485② | 0.013 | 106.76±16.32 | 1.199 | 0.245 | 502.20 (450.15) | -1.894② | 0.058 |
| 9-month | 320.77±57.98 | 2.921 | 0.008 | 115.29±13.63 | 3.739 | 0.001 | 488.50 (451.25) | 1.889 | 0.074 |
| Control group | |||||||||
| Baseline | 312.38±61.80 | ‒ | ‒ | 112.05±15.52 | ‒ | ‒ | 247.70 (362.00) | ‒ | ‒ |
| 3-month | 296.45±55.78 | -1.961 | 0.066 | 113.89±20.37 | 0.377 | 0.711 | 350.50 (345.90) | 1.632 | 0.120 |
| 6-month | 313.83±62.77 | 0.155 | 0.879 | 111.63±13.10 | -0.184 | 0.856 | 214.30 (373.10) | -0.080② | 0.936 |
| 9-month | 337.47±61.95 | 1.775 | 0.094 | 119.94±15.93 | 1.704 | 0.107 | 250.25 (384.95) | 0.113 | 0.911 |
Tab 5 Comparison of serum prealbumin, hemoglobin and ferritin between the two groups
| Group | Serum prealbumin/(mg·L-1) | t/Z value① | P value① | Hemoglobin/ (g·L-1) | t value① | P value① | Serum ferritin/(μg·L-1) | t/Z value① | P value① |
|---|---|---|---|---|---|---|---|---|---|
| Treatment group | |||||||||
| Baseline | 284.51±77.54 | ‒ | ‒ | 102.14±14.64 | ‒ | ‒ | 454.50 (390.90) | ‒ | ‒ |
| 3-month | 267.21±78.38 | -1.382 | 0.183 | 108.24±15.57 | 2.192 | 0.040 | 580.40 (639.70) | 2.994 | 0.007 |
| 6-month | 316.58±80.11 | -2.485② | 0.013 | 106.76±16.32 | 1.199 | 0.245 | 502.20 (450.15) | -1.894② | 0.058 |
| 9-month | 320.77±57.98 | 2.921 | 0.008 | 115.29±13.63 | 3.739 | 0.001 | 488.50 (451.25) | 1.889 | 0.074 |
| Control group | |||||||||
| Baseline | 312.38±61.80 | ‒ | ‒ | 112.05±15.52 | ‒ | ‒ | 247.70 (362.00) | ‒ | ‒ |
| 3-month | 296.45±55.78 | -1.961 | 0.066 | 113.89±20.37 | 0.377 | 0.711 | 350.50 (345.90) | 1.632 | 0.120 |
| 6-month | 313.83±62.77 | 0.155 | 0.879 | 111.63±13.10 | -0.184 | 0.856 | 214.30 (373.10) | -0.080② | 0.936 |
| 9-month | 337.47±61.95 | 1.775 | 0.094 | 119.94±15.93 | 1.704 | 0.107 | 250.25 (384.95) | 0.113 | 0.911 |
| Group | Serum phosphorus/(mmol·L-1) | t/Z value① | P value① | Serum calcium/(mmol·L-1) | t/Z value① | P value① | 1,25-(OH)2-D3/(ng·mL-1) | t/Z value① | P value① | iPTH/ (pg·mL-1) | t/Z value① | P value① |
|---|---|---|---|---|---|---|---|---|---|---|---|---|
| Treatment group | ||||||||||||
| Baseline | 2.09±0.35 | ‒ | ‒ | 1.77±0.51 | ‒ | ‒ | 14.59±5.03 | ‒ | ‒ | 221.00 (248.45) | ‒ | ‒ |
| 3-month | 1.67±0.45 | -2.743 | 0.013 | 2.35±0.21 | 4.581 | 0.000 | 18.03±5.02 | 4.504 | 0.000 | 156.60 (276.15) | -0.362 | 0.722 |
| 6-month | 1.87±0.63 | -1.568② | 0.117 | 2.32±0.19 | 4.922 | 0.000 | 18.31±8.74 | -2.374② | 0.018 | 218.00 (379.25) | 1.045 | 0.308 |
| 9-month | 1.81±0.38 | -2.103② | 0.035 | 2.42±0.25 | 5.008 | 0.000 | 15.50±8.07 | -0.282② | 0.778 | 211.20 (307.15) | -0.330② | 0.741 |
| Control group | ||||||||||||
| Baseline | 1.87±0.38 | ‒ | ‒ | 2.21±0.25 | ‒ | ‒ | 13.87±6.45 | ‒ | ‒ | 147.05 (194.33) | ‒ | ‒ |
| 3-month | 1.79±0.53 | -1.132② | 0.257 | 2.39±0.30 | -2.571② | 0.010 | 16.14±9.48 | -1.087② | 0.277 | 176.50 (270.35) | 0.000② | >0.999 |
| 6-month | 1.84±0.46 | -0.202 | 0.842 | 2.32±0.19 | 2.06 | 0.054 | 15.90±11.08 | -0.563② | 0.573 | 148.60 (189.88) | -0.675 | 0.509 |
| 9-month | 2.23±0.57 | -2.178② | 0.029 | 2.34±0.22 | -2.202② | 0.028 | 12.99±8.14 | -0.679 | 0.506 | 178.50 (209.18) | -0.081 | 0.936 |
Tab 6 Comparison of serum phosphorus, serum calcium, 1,25-(OH)2-D3 and iPTH between the two groups
| Group | Serum phosphorus/(mmol·L-1) | t/Z value① | P value① | Serum calcium/(mmol·L-1) | t/Z value① | P value① | 1,25-(OH)2-D3/(ng·mL-1) | t/Z value① | P value① | iPTH/ (pg·mL-1) | t/Z value① | P value① |
|---|---|---|---|---|---|---|---|---|---|---|---|---|
| Treatment group | ||||||||||||
| Baseline | 2.09±0.35 | ‒ | ‒ | 1.77±0.51 | ‒ | ‒ | 14.59±5.03 | ‒ | ‒ | 221.00 (248.45) | ‒ | ‒ |
| 3-month | 1.67±0.45 | -2.743 | 0.013 | 2.35±0.21 | 4.581 | 0.000 | 18.03±5.02 | 4.504 | 0.000 | 156.60 (276.15) | -0.362 | 0.722 |
| 6-month | 1.87±0.63 | -1.568② | 0.117 | 2.32±0.19 | 4.922 | 0.000 | 18.31±8.74 | -2.374② | 0.018 | 218.00 (379.25) | 1.045 | 0.308 |
| 9-month | 1.81±0.38 | -2.103② | 0.035 | 2.42±0.25 | 5.008 | 0.000 | 15.50±8.07 | -0.282② | 0.778 | 211.20 (307.15) | -0.330② | 0.741 |
| Control group | ||||||||||||
| Baseline | 1.87±0.38 | ‒ | ‒ | 2.21±0.25 | ‒ | ‒ | 13.87±6.45 | ‒ | ‒ | 147.05 (194.33) | ‒ | ‒ |
| 3-month | 1.79±0.53 | -1.132② | 0.257 | 2.39±0.30 | -2.571② | 0.010 | 16.14±9.48 | -1.087② | 0.277 | 176.50 (270.35) | 0.000② | >0.999 |
| 6-month | 1.84±0.46 | -0.202 | 0.842 | 2.32±0.19 | 2.06 | 0.054 | 15.90±11.08 | -0.563② | 0.573 | 148.60 (189.88) | -0.675 | 0.509 |
| 9-month | 2.23±0.57 | -2.178② | 0.029 | 2.34±0.22 | -2.202② | 0.028 | 12.99±8.14 | -0.679 | 0.506 | 178.50 (209.18) | -0.081 | 0.936 |
| Scope | Treatment group (n=21) | Control group (n=19) | χ2 value | P value |
|---|---|---|---|---|
| Total adverse event/n(%) | 1 (4.76) | 4 (21.05) | 1.160 | 0.281 |
| Cardio-cerebrovascular accidents/n(%) | 1 (4.76) | 3 (15.79) | 0.401 | 0.527 |
| Vascular access failure/n(%) | 0 (0) | 1 (4.76) | ‒ | 0.475 |
Tab 7 Comparison of adverse event incidence between the two groups
| Scope | Treatment group (n=21) | Control group (n=19) | χ2 value | P value |
|---|---|---|---|---|
| Total adverse event/n(%) | 1 (4.76) | 4 (21.05) | 1.160 | 0.281 |
| Cardio-cerebrovascular accidents/n(%) | 1 (4.76) | 3 (15.79) | 0.401 | 0.527 |
| Vascular access failure/n(%) | 0 (0) | 1 (4.76) | ‒ | 0.475 |
| 1 | LIYANAGE T, NINOMIYA T, JHA V, et al. Worldwide access to treatment for end-stage kidney disease: a systematic review[J]. Lancet, 2015, 385(9981): 1975-1982. |
| 2 | SABATINO A, REGOLISTI G, KARUPAIAH T, et al. Protein-energy wasting and nutritional supplementation in patients with end-stage renal disease on hemodialysis[J]. Clin Nutr, 2017, 36(3): 663-671. |
| 3 | HARA H, NAKAMURA Y, HATANO M, et al. Protein energy wasting and sarcopenia in dialysis patients[J]. Contrib Nephrol, 2018, 196: 243-249. |
| 4 | NAGY E, MAHMOUD M, EL-KANNISHY G, et al. Impact of malnutrition on health-related quality of life in patients on maintenance hemodialysis[J]. Ther Apher Dial, 2021, 25(4): 467-474. |
| 5 | 傅鹏, 袁伟杰. 复方氨基酸胶囊纠正慢性肾功能衰竭血液透析伴低蛋白血症的疗效观察[J]. 中国药房, 2005, 16(10): 764-766. |
| FU P, YUAN W J. Effects of compound amino acids capsules on hypoalbuminemia in patients with chronic renal failure undergoing hemodialysis[J]. China Pharmacy, 2005, 16(10): 764-766. | |
| 6 | CARRERO J J, THOMAS F, NAGY K, et al. Global prevalence of protein-energy wasting in kidney disease: a meta-analysis of contemporary observational studies from the international society of renal nutrition and metabolism[J]. J Ren Nutr, 2018, 28(6): 380-392. |
| 7 | MACLAUGHLIN H L, FRIEDMAN A N, IKIZLER T A. Nutrition in kidney disease: core curriculum 2022[J]. Am J Kidney Dis, 2022, 79(3): 437-449. |
| 8 | HANNA R M, GHOBRY L, WASSEF O, et al. A practical approach to nutrition, protein-energy wasting, sarcopenia, and Cachexia in patients with chronic kidney disease[J]. Blood Purif, 2020, 49(1/2): 202-211. |
| 9 | SHIRAI N, INOUE T, OGAWA M, et al. Relationship between nutrition-related problems and falls in hemodialysis patients: a narrative review[J]. Nutrients, 2022, 14(15): 3225. |
| 10 | BOLASCO P. Hemodialysis-nutritional flaws in diagnosis and prescriptions. could amino acid losses be the sharpest "sword of Damocles"?[J]. Nutrients, 2020, 12(6): 1773. |
| 11 | GRATEROL TORRES F, MOLINA M, SOLER-MAJORAL J, et al. Evolving concepts on inflammatory biomarkers and malnutrition in chronic kidney disease[J]. Nutrients, 2022, 14(20): 4297. |
| 12 | KLOPPENBURG W D, STEGEMAN C A, HOVINGA T K, et al. Effect of prescribing a high protein diet and increasing the dose of dialysis on nutrition in stable chronic haemodialysis patients: a randomized, controlled trial[J]. Nephrol Dial Transplant, 2004, 19(5): 1212-1223. |
| 13 | SAHATHEVAN S, KHOR B H, NG H M, et al. Understanding development of malnutrition in hemodialysis patients: a narrative review[J]. Nutrients, 2020, 12(10): 3147. |
| 14 | HENDRIKS F K, KOOMAN J P, VAN LOON L J C. Dietary protein interventions to improve nutritional status in end-stage renal disease patients undergoing hemodialysis[J]. Curr Opin Clin Nutr Metab Care, 2021, 24(1): 79-87. |
| 15 | IKIZLER T A, BURROWES J D, BYHAM-GRAY L D, et al. KDOQI clinical practice guideline for nutrition in CKD: 2020 update[J]. Am J Kidney Dis, 2020, 76(3 Suppl 1): S1-S107. |
| 16 | MA L J, ZHAO S M. Risk factors for mortality in patients undergoing hemodialysis: a systematic review and meta-analysis[J]. Int J Cardiol, 2017, 238: 151-158. |
| 17 | JIANG N, QIAN J Q, LIN A W, et al. Low-protein diet supplemented with keto acids is associated with suppression of small-solute peritoneal transport rate in peritoneal dialysis patients[J]. Int J Nephrol, 2011, 2011: 542704. |
| 18 | 李福红, 孙彬, 田玉梅. 复方氨基酸胶囊辅助治疗血液透析患者肾性贫血的临床观察[J]. 临床肾脏病杂志, 2017, 17(10): 618-620. |
| LI F H, SUN B, TIAN Y M. Clinical observation of compound amino acid capsules in the supplementary treatment of renal anemia in hemodialysis patients[J]. Journal of Clinical Nephrology, 2017, 17(10): 618-620. | |
| 19 | HU L, NAPOLETANO A, PROVENZANO M, et al. Mineral bone disorders in kidney disease patients: the ever-current topic[J]. Int J Mol Sci, 2022, 23(20): 12223. |
| 20 | ZHOU C, SHI Z Y, OUYANG N, et al. Hyperphosphatemia and cardiovascular disease[J]. Front Cell Dev Biol, 2021, 9: 644363. |
| 21 | LI H M, LONG Q, SHAO C H, et al. Effect of short-term low-protein diet supplemented with keto acids on hyperphosphatemia in maintenance hemodialysis patients[J]. Blood Purif, 2011, 31(1/2/3): 33-40. |
| 22 | CASES A, CIGARRÁN-GULDRÍS S, MAS S, et al. Vegetable-based diets for chronic kidney disease? it is time to reconsider[J]. Nutrients, 2019, 11(6): 1263. |
| 23 | CARRERO J J, GONZÁLEZ-ORTIZ A, AVESANI C M, et al. Plant-based diets to manage the risks and complications of chronic kidney disease[J]. Nat Rev Nephrol, 2020, 16(9): 525-542. |
| 24 | HOSHINO J. Renal rehabilitation: exercise intervention and nutritional support in dialysis patients[J]. Nutrients, 2021, 13(5): 1444. |
| Viewed | ||||||
|
Full text |
|
|||||
|
Abstract |
|
|||||