上海交通大学学报(医学版) ›› 2025, Vol. 45 ›› Issue (1): 69-78.doi: 10.3969/j.issn.1674-8115.2025.01.008
赵欣欣1( ), 裴孟超2
收稿日期:2024-08-26
接受日期:2024-09-27
出版日期:2025-01-28
发布日期:2025-01-28
通讯作者:
赵欣欣(1990—),女,中级工程师,硕士;电子信箱: zhaoxinxin@renji.com.基金资助:
ZHAO Xinxin1(), PEI Mengchao2
Received:2024-08-26
Accepted:2024-09-27
Online:2025-01-28
Published:2025-01-28
Contact:
ZHAO Xinxin, E-mail: zhaoxinxin@renji.com.Supported by:摘要:
目的·采用基于相位线性度拟合的磁化率定量成像(quantitative susceptibility mapping,QSM)技术,定量化帕金森病(Parkinson′s disease,PD)患者脑铁含量,结合纹理分析方法,多参数、多维度定量分析帕金森病患者脑灰质核团磁化率分布特征,并结合临床评分评估纹理特征的敏感性。方法·对20名PD患者以及20名健康对照组(health control,HC)的定量磁化率图像信息进行回顾性分析,手动分割的大脑灰质核团感兴趣区域进行基于灰度游程矩阵(gray level run-length matrix,GLRLM)的三维纹理分析。使用单因素方差分析(one-way ANOVA)比较2组之间的差异,并计算双侧皮尔逊线性相关系数( r),以研究纹理参数与统一帕金森病评定量表(Unified Parkinson′s Disease Rating Scale,UPDRS)-Ⅲ临床评分的相关性。结果·纹理特征参数分析表明,PD组与HC组在灰质核团存在诸多差异性。在GLRLM的所有纹理特征参数中,LngREmph在所测量的5个灰质核团中,均显示PD组与HC组具有显著性差异。灰质核团的磁化率平均值与GLRLM纹理参数均具有较好区分PD与HC的价值(AUC>0.5)。其中RLNonUni、LngREmph、ShrtREmp以及Fraction的AUC均大于磁化率平均值的AUC。各灰质核团的GLRLM纹理特征参数与UPDRS-Ⅲ评分的相关性分析结果显示,尾状核(caudate nucleus,CN)的RLNonUni和GLevNonU以及红核(red nucleus,RN)的GLevNonU和ShrtRenp均与UPDRS-Ⅲ评分具有显著相关性,其余特征参数未发现显著临床评分相关性。结论·相较于灰质核团磁化率平均值,GLRLM纹理特征参数能够更好地从健康对照组中区分出PD。纹理多参数分析方法是QSM技术在多参数定量脑铁含量方面的一个新思路,可为PD的无创诊断提供更多维度的定量信息。
中图分类号:
赵欣欣, 裴孟超. 纹理多参数分析在帕金森病患者脑磁化率定量中的应用研究[J]. 上海交通大学学报(医学版), 2025, 45(1): 69-78.
ZHAO Xinxin, PEI Mengchao. Study on multi-parametric texture analysis for quantifying brain magnetic susceptibility in patients with Parkinson′s disease[J]. Journal of Shanghai Jiao Tong University (Medical Science), 2025, 45(1): 69-78.

图1 灰质核团感兴趣区定义示意图以及灰度游程矩阵的图示Note: A. Regions of interest were manually drawn on transverse quantitative susceptibility images. B. Illustration of the process for generating gray-level run-length matrices, considering a 4×4 image represented with four gray-scale values ranging from 0 to 3. A single neighboring pixel (d=1) was considered along four possible directions—0°, 45°, 90°, and 135°—with in the same slice, and 0° in the Z-direction between slices.
Fig 1 Schematic representation of the definition of regions of interest in gray matter nuclei and an illustration of the generation of gray-level run-length matrices
| Feature | Description | Equation |
|---|---|---|
| RLNonUni | run length non-uniformity | |
| GLevNonU | gray-level non-uniformity | |
| LngREmph | long-run emphasis | |
| ShrtREmp | short-run emphasis | |
| Fraction | fraction of image in runs |
表1 基于 GLRLM的纹理参数的方程描述
Tab 1 Description and equation of texture parameters based on run-length matrix (GLRLM)
| Feature | Description | Equation |
|---|---|---|
| RLNonUni | run length non-uniformity | |
| GLevNonU | gray-level non-uniformity | |
| LngREmph | long-run emphasis | |
| ShrtREmp | short-run emphasis | |
| Fraction | fraction of image in runs |
| Item | PD ( n=20) | HC ( n=20) | χ2/F value | P value |
|---|---|---|---|---|
| Age/year | 62.15±10.15 | 61.58±9.24 | 0.941 | 0.534 |
| Gender/ n(%) | 0.100 | 0.752 | ||
| Male | 11 (55.0) | 10 (50.0) | ||
| Female | 9 (45.0) | 10 (50.0) | ||
| Height/cm | 164.68±8.76 | 162.72±7.77 | 1.858 | 0.494 |
| Weight/kg | 71.17±8.84 | 60.83±10.23 | 2.049 | 0.152 |
| BMI/(kg·m -2) | 21.48±1.83 | 22.73±1.65 | 1.414 | 0.427 |
表2 受试者的人口统计信息
Tab 2 Demographic information on subjects
| Item | PD ( n=20) | HC ( n=20) | χ2/F value | P value |
|---|---|---|---|---|
| Age/year | 62.15±10.15 | 61.58±9.24 | 0.941 | 0.534 |
| Gender/ n(%) | 0.100 | 0.752 | ||
| Male | 11 (55.0) | 10 (50.0) | ||
| Female | 9 (45.0) | 10 (50.0) | ||
| Height/cm | 164.68±8.76 | 162.72±7.77 | 1.858 | 0.494 |
| Weight/kg | 71.17±8.84 | 60.83±10.23 | 2.049 | 0.152 |
| BMI/(kg·m -2) | 21.48±1.83 | 22.73±1.65 | 1.414 | 0.427 |
| Patient | UPDRS-III/score |
|---|---|
| 1 | 8 |
| 2 | 9 |
| 3 | 7 |
| 4 | 33 |
| 5 | 36 |
| 6 | 12 |
| 7 | 21 |
| 8 | 24 |
| 9 | 19 |
| 10 | 23 |
| 11 | 36 |
| 12 | 7 |
| 13 | 40 |
| 14 | 5 |
| 15 | 34 |
| 16 | 44 |
| 17 | 37 |
| 18 | 50 |
| 19 | 41 |
| 20 | 55 |
表3 PD患者 UPDRS评分
Tab 3 UPDRS-III scores of the PD patients
| Patient | UPDRS-III/score |
|---|---|
| 1 | 8 |
| 2 | 9 |
| 3 | 7 |
| 4 | 33 |
| 5 | 36 |
| 6 | 12 |
| 7 | 21 |
| 8 | 24 |
| 9 | 19 |
| 10 | 23 |
| 11 | 36 |
| 12 | 7 |
| 13 | 40 |
| 14 | 5 |
| 15 | 34 |
| 16 | 44 |
| 17 | 37 |
| 18 | 50 |
| 19 | 41 |
| 20 | 55 |
| Item | Measurement | Inter-reader correlation coefficient (95% CI) |
|---|---|---|
| Mean | Magnetic susceptibility value | 0.91 (0.88—0.95) |
| GLRLM feature | RLNonUni | 0.92 (0.88—0.97) |
| GLevNonU | 0.90 (0.87—0.95) | |
| LngREmph | 0.91 (0.85—0.95) | |
| ShrtREmp | 0.93 (0.89—0.94) | |
| Fraction | 0.89 (0.86—0.92) |
表4 组内、组间一致性评价
Tab 4 Intra-observer and inter-observer correlation coefficients for the measurements
| Item | Measurement | Inter-reader correlation coefficient (95% CI) |
|---|---|---|
| Mean | Magnetic susceptibility value | 0.91 (0.88—0.95) |
| GLRLM feature | RLNonUni | 0.92 (0.88—0.97) |
| GLevNonU | 0.90 (0.87—0.95) | |
| LngREmph | 0.91 (0.85—0.95) | |
| ShrtREmp | 0.93 (0.89—0.94) | |
| Fraction | 0.89 (0.86—0.92) |
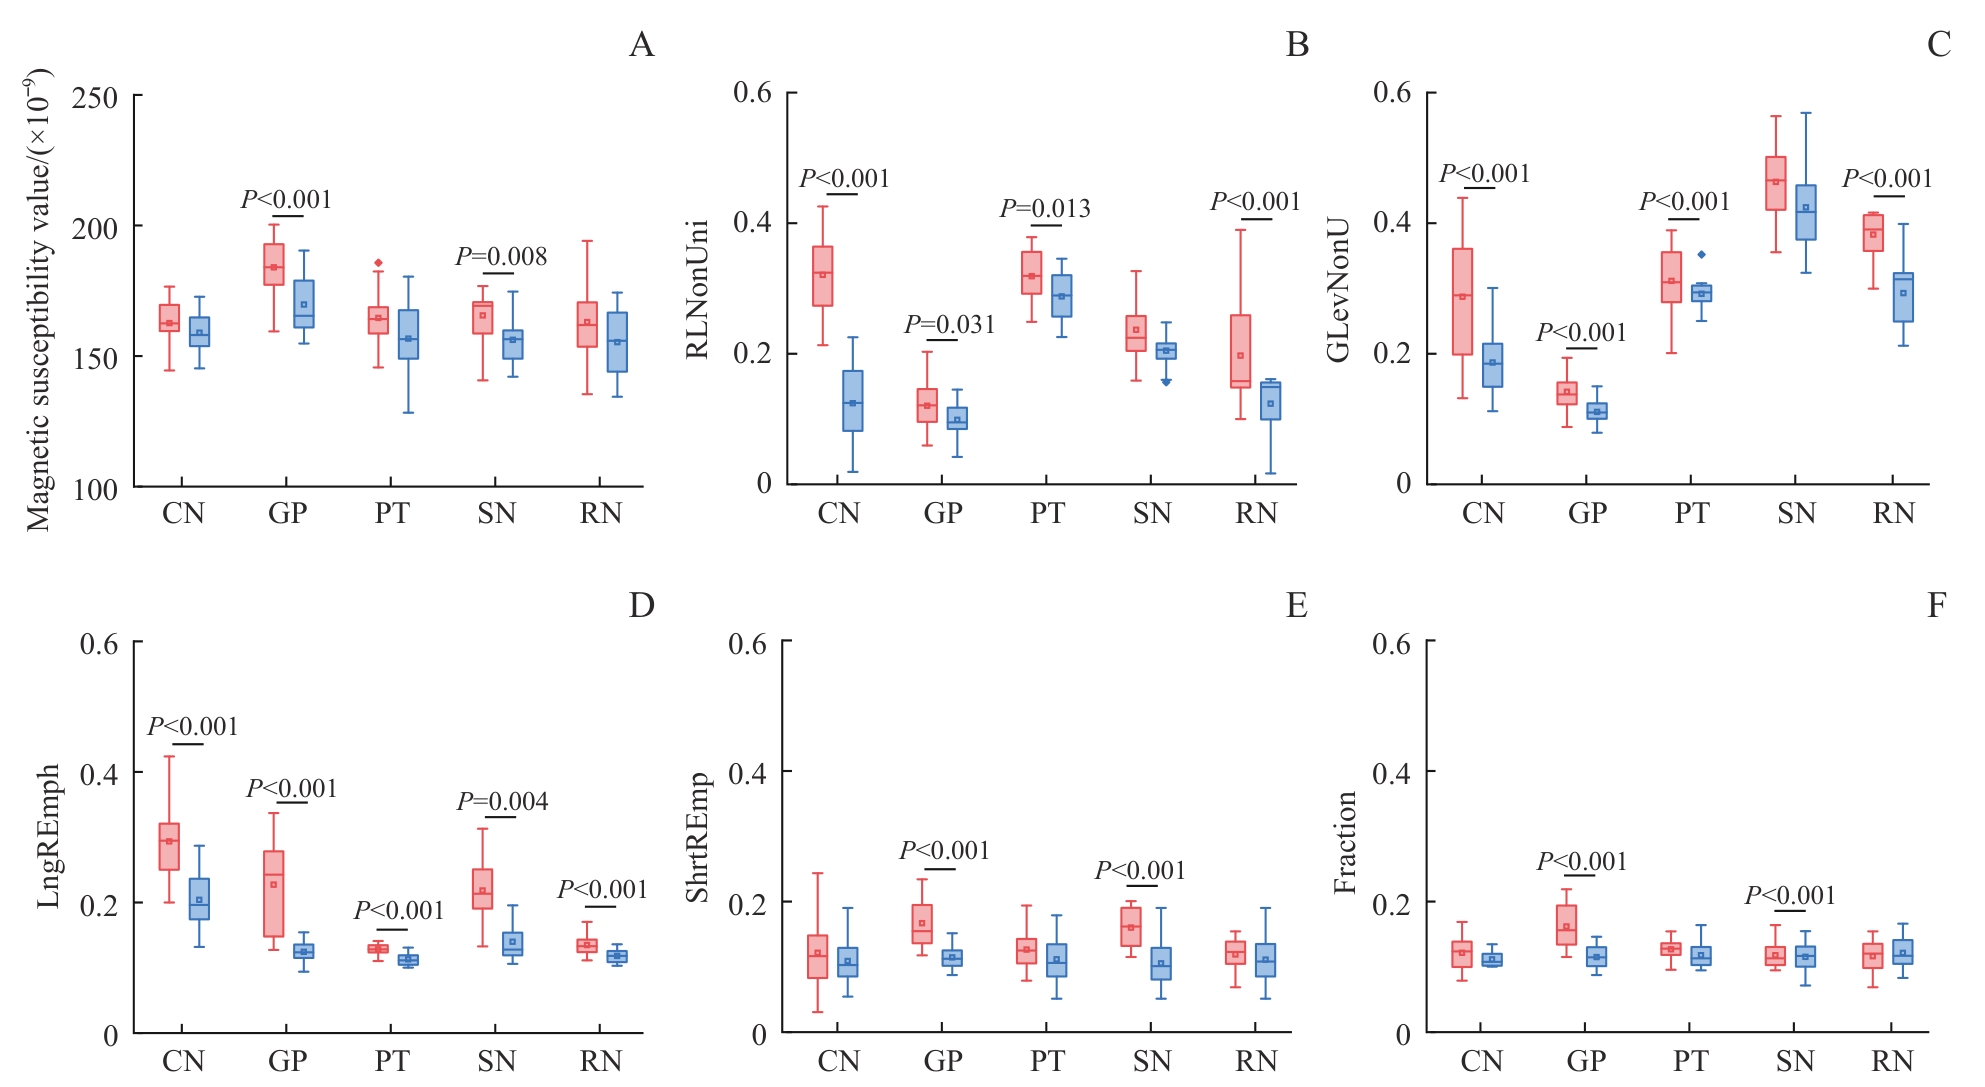
图2 磁化率的平均值和纹理参数的相对 D值的比较Note: A. Mean values of magnetic susceptibility. B. RLNonUni. C. GLevNonU. D. LngREmph. E. ShrtREmp. F. Fraction. Red is the PD group, and blue is the HC group.
Fig 2 Comparisons of mean values of magnetic susceptibility and the relative D values of texture parameters
| Item | Measurement | AUC | P value |
|---|---|---|---|
| Mean | Magnetic susceptibility value | 0.678 | <0.001 |
| GLRLM feature | RLNonUni | 0.708 | <0.001 |
| GLevNonU | 0.646 | <0.001 | |
| LngREmph | 0.777 | <0.001 | |
| ShrtREmp | 0.714 | <0.001 | |
| Fraction | 0.716 | <0.001 |
表6 PD组与 HC组之间纹理参数和平均磁化率值的 ROC曲线分析结果
Tab 6 Results of the ROC curve analyses of texture parameters and mean magnetic susceptibility values between the PD and HC groups
| Item | Measurement | AUC | P value |
|---|---|---|---|
| Mean | Magnetic susceptibility value | 0.678 | <0.001 |
| GLRLM feature | RLNonUni | 0.708 | <0.001 |
| GLevNonU | 0.646 | <0.001 | |
| LngREmph | 0.777 | <0.001 | |
| ShrtREmp | 0.714 | <0.001 | |
| Fraction | 0.716 | <0.001 |
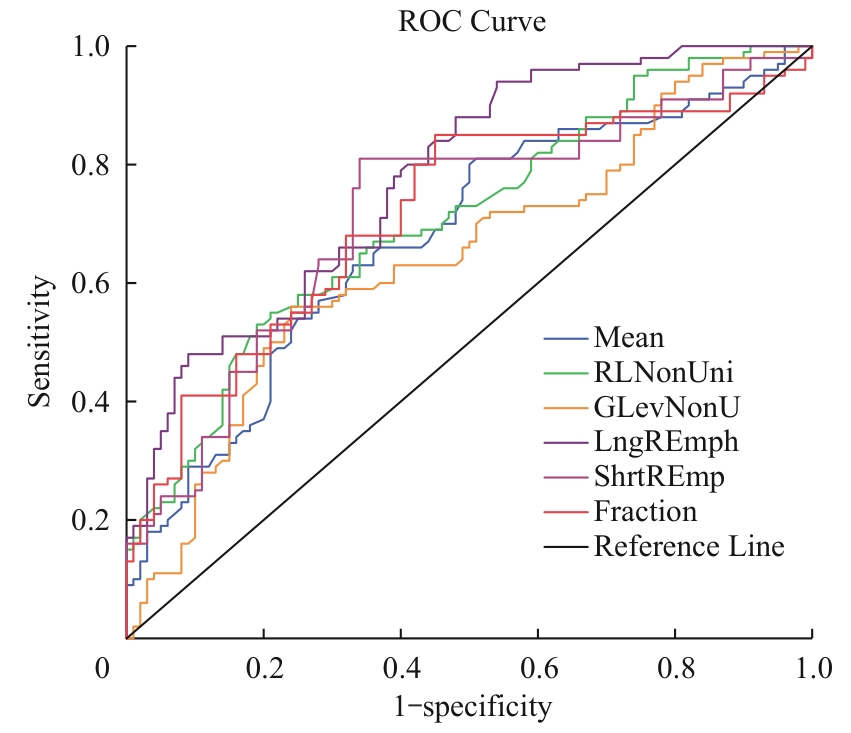
图3 PD组与 HC组之间纹理参数和平均磁化率值的受试者工作特征曲线Note: The average magnetic susceptibility of gray matter nuclei and GLRLM texture parameters denonstrate a good ability to distinguish PD from HC (AUC>0.5), among which the AUC values of RLNonUni, LngREnch, ShrtRImp, and Fraction are all greater than that of the average magnetic susceptibility. PD, Parkinson′s disease; HC, healthy controls.
Fig 3 Receiver operating characteristic curves of texture parameters and average magnetic susceptibility values between the PD group and HC group
| Gray Matter Nuclei | Measurement | r | radj2 | P value | |
|---|---|---|---|---|---|
| CN | Mean | Magnetic susceptibility | -0.305 | 0.043 | 0.191 |
| GLRLM feature | RLNonUni | 0.755 | 0.546 | <0.001 | |
| GLevNonU | 0.623 | 0.355 | 0.003 | ||
| LngREmph | -0.220 | -0.005 | 0.352 | ||
| ShrtREmp | 0.291 | 0.034 | 0.213 | ||
| Fraction | -0.201 | -0.013 | 0.395 | ||
| GP | Mean | Magnetic susceptibility | -0.038 | -0.054 | 0.874 |
| GLRLM feature | RLNonUni | 0.373 | 0.091 | 0.105 | |
| GLevNonU | 0.332 | 0.061 | 0.153 | ||
| LngREmph | 0.273 | 0.023 | 0.244 | ||
| ShrtREmp | 0.055 | -0.052 | 0.817 | ||
| Fraction | -0.152 | -0.031 | 0.521 | ||
| PT | Mean | Magnetic susceptibility | 0.038 | -0.054 | 0.874 |
| GLRLM feature | RLNonUni | 0.359 | 0.080 | 0.121 | |
| GLevNonU | 0.149 | -0.032 | 0.530 | ||
| LngREmph | -0.349 | 0.073 | 0.132 | ||
| ShrtREmp | 0.206 | -0.011 | 0.384 | ||
| Fraction | -0.262 | 0.017 | 0.264 | ||
| SN | Mean | Magnetic susceptibility | 0.627 | 0.359 | 0.003 |
| GLRLM feature | RLNonUni | -0.231 | 0.001 | 0.326 | |
| GLevNonU | 0.129 | -0.038 | 0.588 | ||
| LngREmph | 0.222 | -0.004 | 0.347 | ||
| ShrtREmp | -0.237 | 0.004 | 0.314 | ||
| Fraction | 0.281 | 0.028 | 0.230 | ||
| RN | Mean | Magnetic susceptibility | 0.667 | 0.413 | 0.001 |
| GLRLM feature | RLNonUni | 0.101 | -0.045 | 0.670 | |
| GLevNonU | 0.826 | 0.664 | <0.001 | ||
| LngREmph | -0.092 | -0.047 | 0.700 | ||
| ShrtREmp | 0.697 | 0.457 | 0.001 | ||
| Fraction | 0.434 | 0.143 | 0.056 | ||
表7 PD组平均磁化率值和纹理特征与 UPDRS-III评分之间的相关性
Tab 7 Association between mean magnetic susceptibility values and texture features with UPDRS-III scores in the PD group
| Gray Matter Nuclei | Measurement | r | radj2 | P value | |
|---|---|---|---|---|---|
| CN | Mean | Magnetic susceptibility | -0.305 | 0.043 | 0.191 |
| GLRLM feature | RLNonUni | 0.755 | 0.546 | <0.001 | |
| GLevNonU | 0.623 | 0.355 | 0.003 | ||
| LngREmph | -0.220 | -0.005 | 0.352 | ||
| ShrtREmp | 0.291 | 0.034 | 0.213 | ||
| Fraction | -0.201 | -0.013 | 0.395 | ||
| GP | Mean | Magnetic susceptibility | -0.038 | -0.054 | 0.874 |
| GLRLM feature | RLNonUni | 0.373 | 0.091 | 0.105 | |
| GLevNonU | 0.332 | 0.061 | 0.153 | ||
| LngREmph | 0.273 | 0.023 | 0.244 | ||
| ShrtREmp | 0.055 | -0.052 | 0.817 | ||
| Fraction | -0.152 | -0.031 | 0.521 | ||
| PT | Mean | Magnetic susceptibility | 0.038 | -0.054 | 0.874 |
| GLRLM feature | RLNonUni | 0.359 | 0.080 | 0.121 | |
| GLevNonU | 0.149 | -0.032 | 0.530 | ||
| LngREmph | -0.349 | 0.073 | 0.132 | ||
| ShrtREmp | 0.206 | -0.011 | 0.384 | ||
| Fraction | -0.262 | 0.017 | 0.264 | ||
| SN | Mean | Magnetic susceptibility | 0.627 | 0.359 | 0.003 |
| GLRLM feature | RLNonUni | -0.231 | 0.001 | 0.326 | |
| GLevNonU | 0.129 | -0.038 | 0.588 | ||
| LngREmph | 0.222 | -0.004 | 0.347 | ||
| ShrtREmp | -0.237 | 0.004 | 0.314 | ||
| Fraction | 0.281 | 0.028 | 0.230 | ||
| RN | Mean | Magnetic susceptibility | 0.667 | 0.413 | 0.001 |
| GLRLM feature | RLNonUni | 0.101 | -0.045 | 0.670 | |
| GLevNonU | 0.826 | 0.664 | <0.001 | ||
| LngREmph | -0.092 | -0.047 | 0.700 | ||
| ShrtREmp | 0.697 | 0.457 | 0.001 | ||
| Fraction | 0.434 | 0.143 | 0.056 | ||
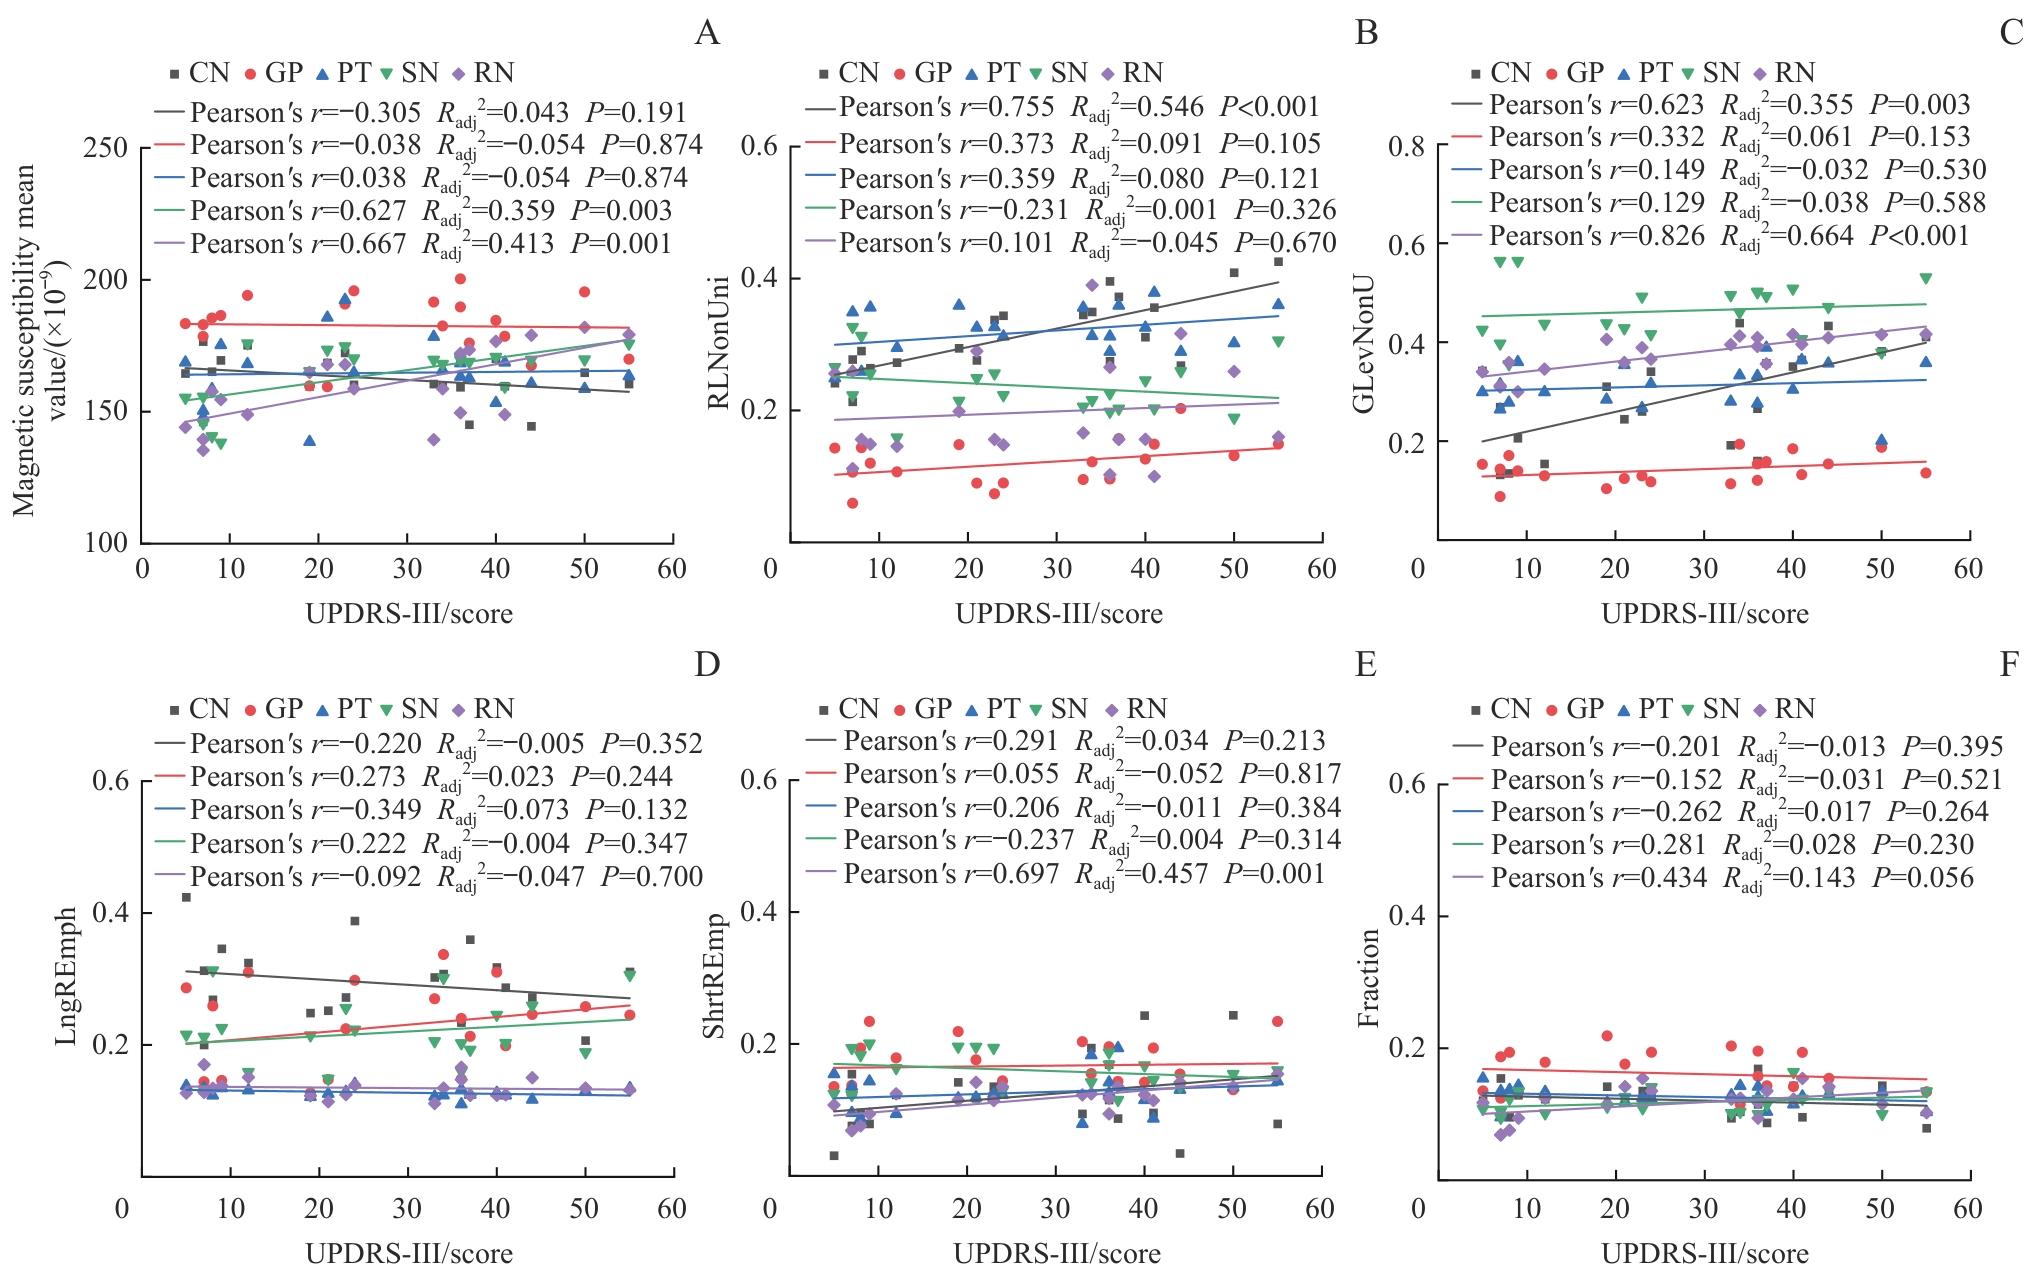
图4 PD组平均磁化率值和纹理特征与 UPDRS-III评分之间的相关性Note: Only the mean magnetic susceptibility values of SN and RN showed a certain correlation with UPDRS-III scores, while the average magnetic susceptibility values of other gray matter nuclei were not significantly correlated with UPDRS-III. RLNonUni and GLevNonU in the CN, as well as GLevNonU in the RN, were significantly correlated with UPDRS-III scores. No significant correlation with clinical scores was found for other texture parameters.
Fig 4 Correlations of GLRLM texture parameters with UPDRS-III scores in the PD group
| 1 | DICKSON D W. Parkinson′s disease and Parkinsonism: neuropathology[J]. Cold Spring Harb Perspect Med, 2012, 2(8): a009258. |
| 2 | IRIZARRY M C, GROWDON W, GOMEZ-ISLA T, et al. Nigral and cortical Lewy bodies and dystrophic nigral neurites in Parkinson′s disease and cortical Lewy body disease contain alpha-synuclein immunoreactivity[J]. J Neuropathol Exp Neurol, 1998, 57(4): 334-337. |
| 3 | SPILLANTINI M G, SCHMIDT M L, LEE V M, et al. Alpha-synuclein in lewy bodies[J]. Nature, 1997, 388(6645): 839-840. |
| 4 | ZECCA L, STROPPOLO A, GATTI A, et al. The role of iron and copper molecules in the neuronal vulnerability of locus coeruleus and substantia nigra during aging[J]. Proc Natl Acad Sci U S A, 2004, 101(26): 9843-9848. |
| 5 | PÉRAN P, CHERUBINI A, ASSOGNA F, et al. Magnetic resonance imaging markers of Parkinson′s disease nigrostriatal signature[J]. Brain, 2010, 133(11): 3423-3433. |
| 6 | SIAN-HÜLSMANN J, MANDEL S, YOUDIM M B, et al. The relevance of iron in the pathogenesis of Parkinson's disease[J]. J Neurochem, 2011, 118(6): 939-957. |
| 7 | LEE D W, ANDERSEN J K, KAUR D. Iron dysregulation and neurodegeneration: the molecular connection[J]. Mol Interv, 2006, 6(2): 89-97. |
| 8 | LI W, WU B, LIU C L. Quantitative susceptibility mapping of human brain reflects spatial variation in tissue composition[J]. Neuroimage, 2011, 55(4): 1645-1656. |
| 9 | OSHIRO S, MORIOKA M S, KIKUCHI M. Dysregulation of iron metabolism in Alzheimer′s disease, Parkinson′s disease, and amyotrophic lateral sclerosis[J]. Adv Pharmacol Sci, 2011, 2011: 378278. |
| 10 | LV Z Y, JIANG H, XU H M, et al. Increased iron levels correlate with the selective nigral dopaminergic neuron degeneration in Parkinson′s disease[J]. J Neural Transm, 2011, 118(3): 361-369. |
| 11 | FASANO M, BERGAMASCO B, LOPIANO L. Modifications of the iron-neuromelanin system in Parkinson′s disease[J]. J Neurochem, 2006, 96(4): 909-916. |
| 12 | WANG Y, LIU T. Quantitative susceptibility mapping (QSM): decoding MRI data for a tissue magnetic biomarker[J]. Magn Reson Med, 2015, 73(1): 82-101. |
| 13 | HAACKE E M, LIU S F, BUCH S, et al. Quantitative susceptibility mapping: current status and future directions[J]. Magn Reson Imaging, 2015, 33(1): 1-25. |
| 14 | LIU C L, LI W, TONG K A, et al. Susceptibility-weighted imaging and quantitative susceptibility mapping in the brain[J]. J Magn Reson Imaging, 2015, 42(1): 23-41. |
| 15 | DU G W, LIU T, LEWIS M M, et al. Quantitative susceptibility mapping of the midbrain in Parkinson′s disease[J]. Mov Disord, 2016, 31(3): 317-324. |
| 16 | MURAKAMI Y, KAKEDA S, WATANABE K, et al. Usefulness of quantitative susceptibility mapping for the diagnosis of Parkinson disease[J]. AJNR Am J Neuroradiol, 2015, 36(6): 1102-1108. |
| 17 | LANGKAMMER C, SCHWESER F, KREBS N, et al. Quantitative susceptibility mapping (QSM) as a means to measure brain iron? A post mortem validation study[J]. Neuroimage, 2012, 62(3): 1593-1599. |
| 18 | ZHANG J, YU C S, JIANG G L, et al. 3D texture analysis on MRI images of Alzheimer′s disease[J]. Brain Imaging Behav, 2012, 6(1): 61-69. |
| 19 | HWANG E J, KIM H G, KIM D, et al. Texture analyses of quantitative susceptibility maps to differentiate Alzheimer′s disease from cognitive normal and mild cognitive impairment[J]. Med Phys, 2016, 43(8): 4718. |
| 20 | CHENG Z H, ZHANG J P, HE N Y, et al. Radiomic features of the nigrosome-1 region of the substantia nigra: using quantitative susceptibility mapping to assist the diagnosis of idiopathic Parkinson′s disease[J]. Front Aging Neurosci, 2019, 11: 167. |
| 21 | LI G Y, ZHAI G Q, ZHAO X X, et al. 3D texture analyses within the substantia nigra of Parkinson′s disease patients on quantitative susceptibility maps and R2 maps[J]. Neuroimage, 2019, 188: 465-472. |
| 22 | MACKAY J W, KAPOOR G, DRIBAN J B, et al. Association of subchondral bone texture on magnetic resonance imaging with radiographic knee osteoarthritis progression: data from the osteoarthritis initiative bone ancillary study[J]. Eur Radiol, 2018, 28(11): 4687-4695. |
| 23 | TRAVERSO A, WEE L, DEKKER A, et al. Repeatability and reproducibility of radiomic features: a systematic review[J]. Int J Radiat Oncol Biol Phys, 2018, 102(4): 1143-1158. |
| 24 | YAN S, LU J, LI Y H, et al. Spatiotemporal patterns of brain iron-oxygen metabolism in patients with Parkinson′s disease[J]. Eur Radiol, 2024, 34(5): 3074-3083. |
| 25 | GUAN X J, LANCIONE M, AYTON S, et al. Neuroimaging of Parkinson′s disease by quantitative susceptibility mapping[J]. Neuroimage, 2024, 289: 120547. |
| 26 | WANG Y, SPINCEMAILLE P, LIU Z, et al. Clinical quantitative susceptibility mapping (QSM): biometal imaging and its emerging roles in patient care[J]. J Magn Reson Imaging, 2017, 46(4): 951-971. |
| 27 | ESKREIS-WINKLER S, ZHANG Y, ZHANG J W, et al. The clinical utility of QSM: disease diagnosis, medical management, and surgical planning[J]. NMR Biomed, 2017, 30(4): e3668. |
| 28 | MAZZUCCHI S, FROSINI D, COSTAGLI M, et al. Quantitative susceptibility mapping in atypical Parkinsonisms[J]. Neuroimage Clin, 2019, 24: 101999. |
| 29 | LI K R, AVECILLAS-CHASIN J, NGUYEN T D, et al. Quantitative evaluation of brain iron accumulation in different stages of Parkinson′s disease[J]. J Neuroimaging, 2022, 32(2): 363-371. |
| [1] | 吴可馨, 鲁佳, 吴星雨, 虞志华. 小胶质细胞TRPV1在载脂蛋白E4相关帕金森病中的作用[J]. 上海交通大学学报(医学版), 2026, 46(2): 163-171. |
| [2] | 曹明明, 王辉, 尹雅芙. 帕金森病认知功能障碍影像标志物的研究现状[J]. 上海交通大学学报(医学版), 2025, 45(5): 646-652. |
| [3] | 胡灿芳, 钟传钰, 曹立. 神经调控技术在帕金森病治疗中的应用研究进展[J]. 上海交通大学学报(医学版), 2024, 44(2): 258-263. |
| [4] | 袁笑, 田野野, 薛峥. 6-OHDA诱导的帕金森病小鼠表现出以p16Ink4a上调和星形胶质细胞衰老为特征的衰老表型[J]. 上海交通大学学报(医学版), 2021, 41(7): 876-883. |
| [5] | 张小小, 张陈诚, 赖伊杰, 孙伯民. 丘脑底核脑深部电刺激术对帕金森病合并抑郁影响的研究进展[J]. 上海交通大学学报(医学版), 2021, 41(6): 815-820. |
| [6] | 王 滔1,张陈诚1,李殿友1,孙伯民1,傅 萌2. 帕金森病脑深部电刺激电极术后位置规律分析[J]. 上海交通大学学报(医学版), 2020, 40(1): 64-. |
| [7] | 杨笑 1,杜芸兰 1,白雪峰 2,朱德生 1,王飞 1,韩露 1,管阳太 1. 帕金森病细胞模型中分子伴侣介导自噬对 α-突触核蛋白低聚体水平的影响[J]. 上海交通大学学报(医学版), 2019, 39(3): 239-. |
| [8] | 杨笑,杜芸兰,管阳太. α-突触核蛋白乙酰化修饰在帕金森病中作用的研究进展[J]. 上海交通大学学报(医学版), 2018, 38(11): 1381-. |
| [9] | 黄菲菲,张斌,吴丹红,张定国,刘军 . 加速度测量和表面肌电图检测对帕金森病震颤与特发性震颤的鉴别诊断价值[J]. 上海交通大学学报(医学版), 2017, 37(1): 34-. |
| [10] | 周立彻,刘军. 眼球运动在帕金森病中的研究进展[J]. 上海交通大学学报(医学版), 2016, 36(9): 1399-. |
| [11] | 应黎,王文安,沈飒. 早中期帕金森病患者眼部症状的临床分析[J]. 上海交通大学学报(医学版), 2015, 35(6): 843-. |
| [12] | 干静,戚辰,章素芳,等. AMPA受体分布对帕金森病及异动症发生的影响[J]. 上海交通大学学报(医学版), 2015, 35(3): 308-. |
| [13] | 王飞,杜芸兰,李焰生. 组蛋白去乙酰化酶6对帕金森病细胞模型中α-突触核蛋白阳性包涵体的作用[J]. 上海交通大学学报(医学版), 2015, 35(12): 1790-. |
| [14] | 汪锡金,管 强,吴兴军,等. 慢性病管理实践中康复训练对早期帕金森病患者的作用[J]. 上海交通大学学报(医学版), 2013, 33(10): 1369-. |
| [15] | 陈生弟, 王 刚, 刘 军, 等. 帕金森病发病机制与诊治的基础与临床研究进展[J]. , 2012, 32(9): 1221-. |
| 阅读次数 | ||||||
|
全文 |
|
|||||
|
摘要 |
|
|||||