Journal of Shanghai Jiao Tong University (Medical Science) ›› 2023, Vol. 43 ›› Issue (3): 320-332.doi: 10.3969/j.issn.1674-8115.2023.03.008
• Evidence-based medicine • Previous Articles Next Articles
WANG Anjun( ), LIU Ningning()
Received:2022-08-18
Accepted:2022-12-09
Online:2023-03-28
Published:2023-03-28
Contact:
LIU Ningning
E-mail:wanganjun@sjtu.edu.cn;liuningning@shsmu.edu.cn
Supported by:CLC Number:
WANG Anjun, LIU Ningning. Efficacy of radiotherapy in patients with rectal cancer undergoing chemotherapy and surgery: a retrospective study based on the SEER database[J]. Journal of Shanghai Jiao Tong University (Medical Science), 2023, 43(3): 320-332.
Add to citation manager EndNote|Ris|BibTeX
URL: https://xuebao.shsmu.edu.cn/EN/10.3969/j.issn.1674-8115.2023.03.008
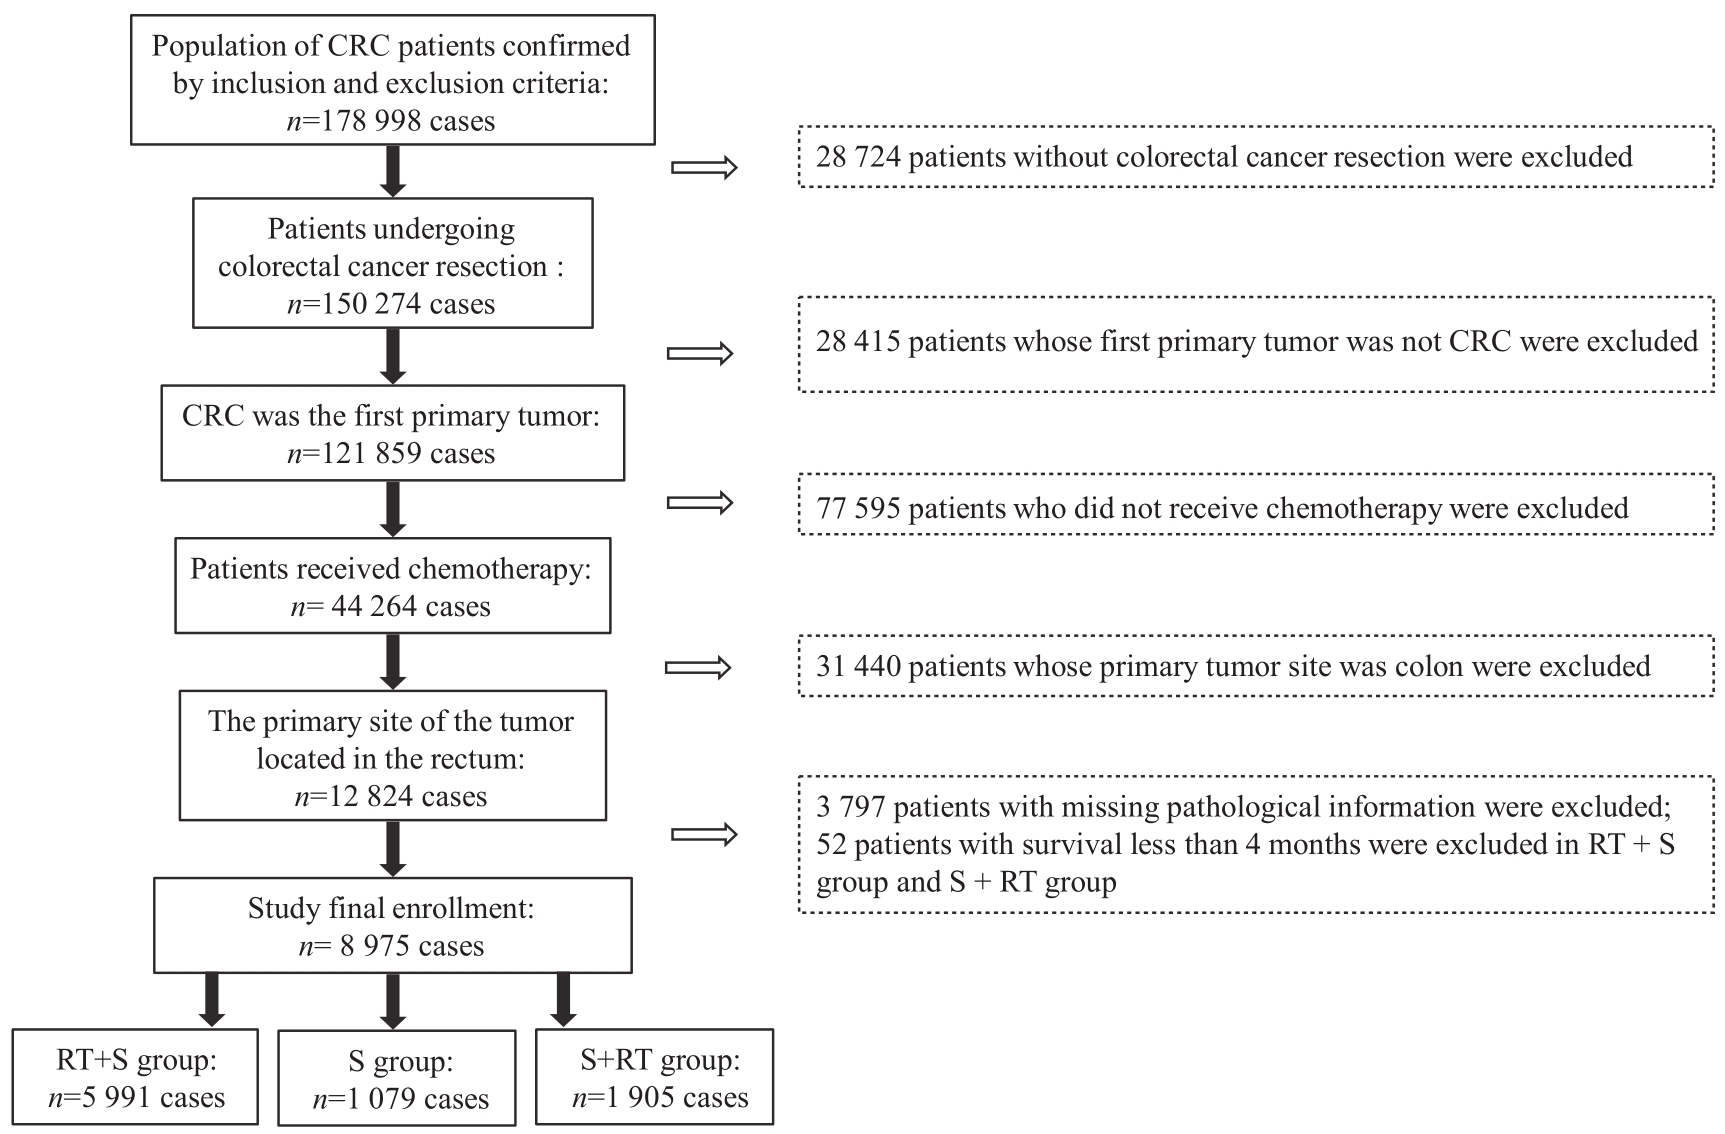
Fig 1 Flow chart for inclusion of rectal cancer patients undergoing surgery and chemotherapy
| Characteristic | Before PSM | After PSM | ||||||
|---|---|---|---|---|---|---|---|---|
All (n=7 070) | S group (n=1 079) | RT+S group (n=5 991) | P value | All (n=1 906) | S group (n=953) | RT+S group (n=953) | P value | |
| Age/n (%) | 0.024 | 0.999 | ||||||
| <50 years | 1 606 (22.7) | 216 (20.0) | 1 390 (23.2) | 371 (19.5) | 185 (19.4) | 186 (19.5) | ||
| ≥50 years | 5 464 (77.3) | 863 (80.0) | 4 601 (76.8) | 1 535 (80.5) | 768 (80.6) | 767 (80.5) | ||
| Gender/n (%) | 0.049 | 0.999 | ||||||
| Male | 4 412 (62.4) | 644 (59.7) | 3 768 (62.9) | 1 129 (59.2) | 564 (59.2) | 565 (59.3) | ||
| Female | 2 658 (37.6) | 435 (40.3) | 2 223 (37.1) | 777 (40.8) | 389 (40.8) | 388 (40.7) | ||
| Race/n (%) | 0.063 | 0.294 | ||||||
| White | 5 414 (76.6) | 818 (75.8) | 4 596 (76.7) | 1 416 (74.3) | 699 (73.3) | 717 (75.2) | ||
| Black | 524 (7.4) | 98 (9.1) | 426 (7.1) | 165 (8.7) | 79 (8.3) | 86 (9.0) | ||
| Others | 1 132 (16.0) | 163 (15.1) | 969 (16.2) | 325 (17.1) | 175 (18.4) | 150 (15.7) | ||
| Marital status/n (%) | 0.681 | 0.541 | ||||||
| Married | 4 183 (59.2) | 645 (59.8) | 3 538 (59.1) | 1 172 (61.5) | 593 (62.2) | 579 (60.8) | ||
| Others | 2 887 (40.8) | 434 (40.2) | 2 453 (40.9) | 734 (38.5) | 360 (37.8) | 374 (39.2) | ||
| Tumor histology/n (%) | 0.000 | 0.956 | ||||||
| Adenocarcinoma | 5 734 (81.1) | 815 (75.5) | 4 919 (82.1) | 1 472 (77.2) | 737 (77.3) | 735 (77.1) | ||
| Others | 1 336 (18.9) | 264 (24.5) | 1 072 (17.9) | 434 (22.8) | 216 (22.7) | 218 (22.9) | ||
| Tumor size/n (%) | 0.010 | 0.999 | ||||||
| ≤30 mm | 1 586 (22.4) | 228 (21.1) | 1 358 (22.7) | 410 (21.5) | 205 (21.5) | 205 (21.5) | ||
| >30‒50 mm | 3 312 (46.8) | 477 (44.2) | 2 835 (47.3) | 878 (46.1) | 439 (46.1) | 439 (46.1) | ||
| >50 mm | 2 172 (30.7) | 374 (34.7) | 1 798 (30.0) | 618 (32.4) | 309 (32.4) | 309 (32.4) | ||
| Histologic grade/n (%) | 0.000 | 0.970 | ||||||
| Well differentiated | 445 (6.3) | 43 (4.0) | 402 (6.7) | 70 (3.7) | 34 (3.6) | 36 (3.8) | ||
| Moderately differentiated | 5 549 (78.5) | 806 (74.7) | 4 743 (79.2) | 1 463 (76.8) | 732 (76.8) | 731 (76.7) | ||
| Poorly differentiated/undifferentiated | 1 076 (15.2) | 230 (21.3) | 846 (14.1) | 373 (19.6) | 187 (19.6) | 186 (19.5) | ||
| TNM stage/n (%) | 0.000 | 0.999 | ||||||
| Ⅰ | 677 (9.6) | 50 (4.6) | 627 (10.5) | 93 (4.9) | 46 (4.8) | 47 (4.9) | ||
| Ⅱ | 2 027 (28.7) | 144 (13.3) | 1 883 (31.4) | 288 (15.1) | 145 (15.2) | 143 (15.0) | ||
| Ⅲ | 3 509 (49.6) | 480 (44.5) | 3 029 (50.6) | 947 (49.7) | 473 (49.6) | 474 (49.7) | ||
| Ⅳ | 857 (12.1) | 405 (37.5) | 452 (7.5) | 578 (30.3) | 289 (30.3) | 289 (30.3) | ||
| Regional nodes examined/n (%) | 0.000 | 0.999 | ||||||
| <12 | 3 065 (43.4) | 411 (38.1) | 2 654 (44.3) | 734 (38.5) | 367 (38.5) | 367 (38.5) | ||
| ≥12 | 4 005 (56.6) | 668 (61.9) | 3 337 (55.7) | 1 172 (61.5) | 586 (61.5) | 586 (61.5) | ||
Tab 1 Basic characteristics of rectal cancer patients in the RT+S group and the S group before and after PSM
| Characteristic | Before PSM | After PSM | ||||||
|---|---|---|---|---|---|---|---|---|
All (n=7 070) | S group (n=1 079) | RT+S group (n=5 991) | P value | All (n=1 906) | S group (n=953) | RT+S group (n=953) | P value | |
| Age/n (%) | 0.024 | 0.999 | ||||||
| <50 years | 1 606 (22.7) | 216 (20.0) | 1 390 (23.2) | 371 (19.5) | 185 (19.4) | 186 (19.5) | ||
| ≥50 years | 5 464 (77.3) | 863 (80.0) | 4 601 (76.8) | 1 535 (80.5) | 768 (80.6) | 767 (80.5) | ||
| Gender/n (%) | 0.049 | 0.999 | ||||||
| Male | 4 412 (62.4) | 644 (59.7) | 3 768 (62.9) | 1 129 (59.2) | 564 (59.2) | 565 (59.3) | ||
| Female | 2 658 (37.6) | 435 (40.3) | 2 223 (37.1) | 777 (40.8) | 389 (40.8) | 388 (40.7) | ||
| Race/n (%) | 0.063 | 0.294 | ||||||
| White | 5 414 (76.6) | 818 (75.8) | 4 596 (76.7) | 1 416 (74.3) | 699 (73.3) | 717 (75.2) | ||
| Black | 524 (7.4) | 98 (9.1) | 426 (7.1) | 165 (8.7) | 79 (8.3) | 86 (9.0) | ||
| Others | 1 132 (16.0) | 163 (15.1) | 969 (16.2) | 325 (17.1) | 175 (18.4) | 150 (15.7) | ||
| Marital status/n (%) | 0.681 | 0.541 | ||||||
| Married | 4 183 (59.2) | 645 (59.8) | 3 538 (59.1) | 1 172 (61.5) | 593 (62.2) | 579 (60.8) | ||
| Others | 2 887 (40.8) | 434 (40.2) | 2 453 (40.9) | 734 (38.5) | 360 (37.8) | 374 (39.2) | ||
| Tumor histology/n (%) | 0.000 | 0.956 | ||||||
| Adenocarcinoma | 5 734 (81.1) | 815 (75.5) | 4 919 (82.1) | 1 472 (77.2) | 737 (77.3) | 735 (77.1) | ||
| Others | 1 336 (18.9) | 264 (24.5) | 1 072 (17.9) | 434 (22.8) | 216 (22.7) | 218 (22.9) | ||
| Tumor size/n (%) | 0.010 | 0.999 | ||||||
| ≤30 mm | 1 586 (22.4) | 228 (21.1) | 1 358 (22.7) | 410 (21.5) | 205 (21.5) | 205 (21.5) | ||
| >30‒50 mm | 3 312 (46.8) | 477 (44.2) | 2 835 (47.3) | 878 (46.1) | 439 (46.1) | 439 (46.1) | ||
| >50 mm | 2 172 (30.7) | 374 (34.7) | 1 798 (30.0) | 618 (32.4) | 309 (32.4) | 309 (32.4) | ||
| Histologic grade/n (%) | 0.000 | 0.970 | ||||||
| Well differentiated | 445 (6.3) | 43 (4.0) | 402 (6.7) | 70 (3.7) | 34 (3.6) | 36 (3.8) | ||
| Moderately differentiated | 5 549 (78.5) | 806 (74.7) | 4 743 (79.2) | 1 463 (76.8) | 732 (76.8) | 731 (76.7) | ||
| Poorly differentiated/undifferentiated | 1 076 (15.2) | 230 (21.3) | 846 (14.1) | 373 (19.6) | 187 (19.6) | 186 (19.5) | ||
| TNM stage/n (%) | 0.000 | 0.999 | ||||||
| Ⅰ | 677 (9.6) | 50 (4.6) | 627 (10.5) | 93 (4.9) | 46 (4.8) | 47 (4.9) | ||
| Ⅱ | 2 027 (28.7) | 144 (13.3) | 1 883 (31.4) | 288 (15.1) | 145 (15.2) | 143 (15.0) | ||
| Ⅲ | 3 509 (49.6) | 480 (44.5) | 3 029 (50.6) | 947 (49.7) | 473 (49.6) | 474 (49.7) | ||
| Ⅳ | 857 (12.1) | 405 (37.5) | 452 (7.5) | 578 (30.3) | 289 (30.3) | 289 (30.3) | ||
| Regional nodes examined/n (%) | 0.000 | 0.999 | ||||||
| <12 | 3 065 (43.4) | 411 (38.1) | 2 654 (44.3) | 734 (38.5) | 367 (38.5) | 367 (38.5) | ||
| ≥12 | 4 005 (56.6) | 668 (61.9) | 3 337 (55.7) | 1 172 (61.5) | 586 (61.5) | 586 (61.5) | ||
| Characteristic | Before PSM | After PSM | ||||||
|---|---|---|---|---|---|---|---|---|
All (n=2 984) | S group (n=1 079) | S+RT group (n=1 905) | P value | All (n=1 478) | S group (n=739) | S+RT group (n=739) | P value | |
| Age/n (%) | 0.344 | 0.842 | ||||||
| <50 years | 569 (19.1) | 216 (20.0) | 353 (18.5) | 278 (18.8) | 137 (18.5) | 141 (19.1) | ||
| ≥50 years | 2 415 (80.9) | 863 (80.0) | 1 552 (81.5) | 1 200 (81.2) | 602 (81.5) | 598 (80.9) | ||
| Gender/n (%) | 0.473 | 0.874 | ||||||
| Male | 1 754 (58.8) | 644 (59.7) | 1 110 (58.3) | 862 (58.3) | 429 (58.1) | 433 (58.6) | ||
| Female | 1 230 (41.2) | 435 (40.3) | 795 (41.7) | 616 (41.7) | 310 (41.9) | 306 (41.4) | ||
| Race/n (%) | 0.531 | 0.231 | ||||||
| White | 2 274 (76.2) | 818 (75.8) | 1 456 (76.4) | 1 120 (75.8) | 550 (74.4) | 570 (77.1) | ||
| Black | 249 (8.3) | 98 (9.1) | 151 (7.9) | 122 (8.3) | 59 (8.0) | 63 (8.5) | ||
| Others | 461 (15.4) | 163 (15.1) | 298 (15.6) | 236 (16.0) | 130 (17.6) | 106 (14.3) | ||
| Marital status/n (%) | 0.655 | 0.264 | ||||||
| Married | 1 801 (60.4) | 645 (59.8) | 1 156 (60.7) | 892 (60.4) | 435 (58.9) | 457 (61.8) | ||
| Others | 1 183 (39.6) | 434 (40.2) | 749 (39.3) | 586 (39.6) | 304 (41.1) | 282 (38.2) | ||
| Tumor histology/n (%) | 0.012 | 0.859 | ||||||
| Adenocarcinoma | 2 171 (72.8) | 815 (75.5) | 1 356 (71.2) | 1 092 (73.9) | 544 (73.6) | 548 (74.2) | ||
| Others | 813 (27.2) | 264 (24.5) | 549 (28.8) | 386 (26.1) | 195 (26.4) | 191 (25.8) | ||
| Tumor size/n (%) | 0.000 | 0.970 | ||||||
| ≤30 mm | 792 (26.5) | 228 (21.1) | 564 (29.6) | 370 (25.0) | 185 (25.0) | 185 (25.0) | ||
| >30‒50 mm | 1 295 (43.4) | 477 (44.2) | 818 (42.9) | 670 (45.3) | 333 (45.1) | 337 (45.6) | ||
| >50 mm | 897 (30.1) | 374 (34.7) | 523 (27.5) | 438 (29.6) | 221 (29.9) | 217 (29.4) | ||
| Histologic grade/n (%) | 0.008 | 0.999 | ||||||
| Well differentiated | 154 (5.2) | 43 (4.0) | 111 (5.8) | 54 (3.7) | 27 (3.7) | 27 (3.7) | ||
| Moderately differentiated | 2 263 (75.8) | 806 (74.7) | 1 457 (76.5) | 1 154 (78.1) | 577 (78.1) | 577 (78.1) | ||
| Poorly differentiated/undifferentiated | 567 (19.0) | 230 (21.3) | 337 (17.7) | 270 (18.3) | 135 (18.3) | 135 (18.3) | ||
| TNM stage/n (%) | 0.000 | 0.999 | ||||||
| Ⅰ | 309 (10.4) | 50 (4.6) | 259 (13.6) | 82 (5.6) | 41 (5.6) | 41 (5.6) | ||
| Ⅱ | 618 (20.7) | 144 (13.3) | 474 (24.9) | 266 (18.0) | 133 (18.0) | 133 (18.0) | ||
| Ⅲ | 1 533 (51.4) | 480 (44.5) | 1 053 (55.3) | 922 (62.4) | 461 (62.4) | 461 (62.4) | ||
| Ⅳ | 524 (17.6) | 405 (37.5) | 119 (6.3) | 208 (14.1) | 104 (14.1) | 104 (14.1) | ||
| Regional nodes examined/n (%) | 0.799 | 0.999 | ||||||
| <12 | 1 147 (38.4) | 411 (38.1) | 736 (38.6) | 522 (35.3) | 261 (35.3) | 261 (35.3) | ||
| ≥12 | 1 837 (61.6) | 668 (61.9) | 1 169 (61.4) | 956 (64.7) | 478 (64.7) | 478 (64.7) | ||
Tab 2 Basic characteristics of rectal cancer patients in the S group and the S+RT group before and after PSM
| Characteristic | Before PSM | After PSM | ||||||
|---|---|---|---|---|---|---|---|---|
All (n=2 984) | S group (n=1 079) | S+RT group (n=1 905) | P value | All (n=1 478) | S group (n=739) | S+RT group (n=739) | P value | |
| Age/n (%) | 0.344 | 0.842 | ||||||
| <50 years | 569 (19.1) | 216 (20.0) | 353 (18.5) | 278 (18.8) | 137 (18.5) | 141 (19.1) | ||
| ≥50 years | 2 415 (80.9) | 863 (80.0) | 1 552 (81.5) | 1 200 (81.2) | 602 (81.5) | 598 (80.9) | ||
| Gender/n (%) | 0.473 | 0.874 | ||||||
| Male | 1 754 (58.8) | 644 (59.7) | 1 110 (58.3) | 862 (58.3) | 429 (58.1) | 433 (58.6) | ||
| Female | 1 230 (41.2) | 435 (40.3) | 795 (41.7) | 616 (41.7) | 310 (41.9) | 306 (41.4) | ||
| Race/n (%) | 0.531 | 0.231 | ||||||
| White | 2 274 (76.2) | 818 (75.8) | 1 456 (76.4) | 1 120 (75.8) | 550 (74.4) | 570 (77.1) | ||
| Black | 249 (8.3) | 98 (9.1) | 151 (7.9) | 122 (8.3) | 59 (8.0) | 63 (8.5) | ||
| Others | 461 (15.4) | 163 (15.1) | 298 (15.6) | 236 (16.0) | 130 (17.6) | 106 (14.3) | ||
| Marital status/n (%) | 0.655 | 0.264 | ||||||
| Married | 1 801 (60.4) | 645 (59.8) | 1 156 (60.7) | 892 (60.4) | 435 (58.9) | 457 (61.8) | ||
| Others | 1 183 (39.6) | 434 (40.2) | 749 (39.3) | 586 (39.6) | 304 (41.1) | 282 (38.2) | ||
| Tumor histology/n (%) | 0.012 | 0.859 | ||||||
| Adenocarcinoma | 2 171 (72.8) | 815 (75.5) | 1 356 (71.2) | 1 092 (73.9) | 544 (73.6) | 548 (74.2) | ||
| Others | 813 (27.2) | 264 (24.5) | 549 (28.8) | 386 (26.1) | 195 (26.4) | 191 (25.8) | ||
| Tumor size/n (%) | 0.000 | 0.970 | ||||||
| ≤30 mm | 792 (26.5) | 228 (21.1) | 564 (29.6) | 370 (25.0) | 185 (25.0) | 185 (25.0) | ||
| >30‒50 mm | 1 295 (43.4) | 477 (44.2) | 818 (42.9) | 670 (45.3) | 333 (45.1) | 337 (45.6) | ||
| >50 mm | 897 (30.1) | 374 (34.7) | 523 (27.5) | 438 (29.6) | 221 (29.9) | 217 (29.4) | ||
| Histologic grade/n (%) | 0.008 | 0.999 | ||||||
| Well differentiated | 154 (5.2) | 43 (4.0) | 111 (5.8) | 54 (3.7) | 27 (3.7) | 27 (3.7) | ||
| Moderately differentiated | 2 263 (75.8) | 806 (74.7) | 1 457 (76.5) | 1 154 (78.1) | 577 (78.1) | 577 (78.1) | ||
| Poorly differentiated/undifferentiated | 567 (19.0) | 230 (21.3) | 337 (17.7) | 270 (18.3) | 135 (18.3) | 135 (18.3) | ||
| TNM stage/n (%) | 0.000 | 0.999 | ||||||
| Ⅰ | 309 (10.4) | 50 (4.6) | 259 (13.6) | 82 (5.6) | 41 (5.6) | 41 (5.6) | ||
| Ⅱ | 618 (20.7) | 144 (13.3) | 474 (24.9) | 266 (18.0) | 133 (18.0) | 133 (18.0) | ||
| Ⅲ | 1 533 (51.4) | 480 (44.5) | 1 053 (55.3) | 922 (62.4) | 461 (62.4) | 461 (62.4) | ||
| Ⅳ | 524 (17.6) | 405 (37.5) | 119 (6.3) | 208 (14.1) | 104 (14.1) | 104 (14.1) | ||
| Regional nodes examined/n (%) | 0.799 | 0.999 | ||||||
| <12 | 1 147 (38.4) | 411 (38.1) | 736 (38.6) | 522 (35.3) | 261 (35.3) | 261 (35.3) | ||
| ≥12 | 1 837 (61.6) | 668 (61.9) | 1 169 (61.4) | 956 (64.7) | 478 (64.7) | 478 (64.7) | ||
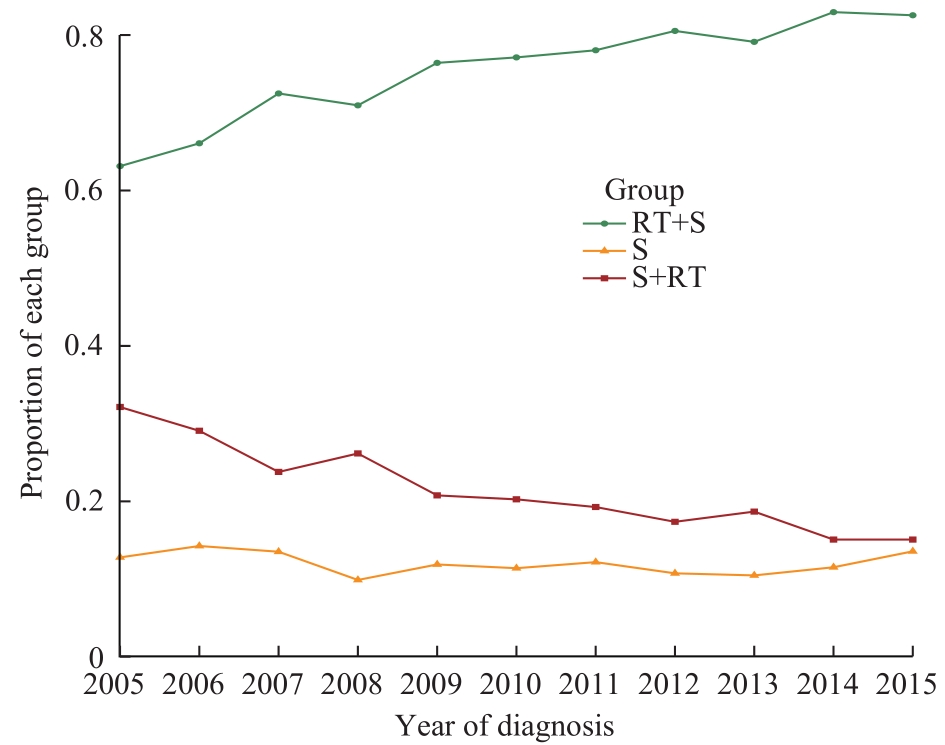
Fig 2 Trends in the proportions of rectal cancer patients in three groups receiving chemotherapy from 2005 to 2015
| Test model | Before PSM | After PSM | ||||
|---|---|---|---|---|---|---|
RT+S group (95%CI) | S group (95%CI) | P value | RT+S group (95%CI) | S group (95%CI) | P value | |
| Log-rank | ||||||
| Median OS/month | 149 (142‒155) | 62 (55‒72) | ‒ | 104 (93‒123) | 71 (61‒86) | ‒ |
| Median CSS/month | NA | 79 (66‒107) | ‒ | NA | 107 (81‒142) | ‒ |
| RMST | ||||||
| 60 months (5 years) survival time | 52.9 (52.5‒53.3) | 44.2 (43.0‒45.3) | 0.000 | 49.8 (48.8‒50.8) | 45.4 (44.2‒46.6) | 0.000 |
| 60 months (5 years) cancer specific survival time | 54.1 (53.8‒54.5) | 45.9 (44.8‒47.0) | 0.000 | 50.8 (49.8‒51.8) | 47.3 (46.1‒48.5) | 0.000 |
| 120 months (10 years) survival time | 91.7 (90.6‒92.7) | 70.1 (67.3‒72.8) | 0.000 | 82.1 (79.4‒84.9) | 73.2 (70.2‒76.1) | 0.000 |
| 120 months (10 years) cancer specific survival time | 97.4 (96.4‒98.4) | 75.2 (72.4‒78.1) | 0.000 | 87.1 (84.4‒89.9) | 78.7 (75.7‒81.8) | 0.000 |
Tab 3 Comparison of OS and CSS in the patients with rectal cancer between the RT+S group and the S group
| Test model | Before PSM | After PSM | ||||
|---|---|---|---|---|---|---|
RT+S group (95%CI) | S group (95%CI) | P value | RT+S group (95%CI) | S group (95%CI) | P value | |
| Log-rank | ||||||
| Median OS/month | 149 (142‒155) | 62 (55‒72) | ‒ | 104 (93‒123) | 71 (61‒86) | ‒ |
| Median CSS/month | NA | 79 (66‒107) | ‒ | NA | 107 (81‒142) | ‒ |
| RMST | ||||||
| 60 months (5 years) survival time | 52.9 (52.5‒53.3) | 44.2 (43.0‒45.3) | 0.000 | 49.8 (48.8‒50.8) | 45.4 (44.2‒46.6) | 0.000 |
| 60 months (5 years) cancer specific survival time | 54.1 (53.8‒54.5) | 45.9 (44.8‒47.0) | 0.000 | 50.8 (49.8‒51.8) | 47.3 (46.1‒48.5) | 0.000 |
| 120 months (10 years) survival time | 91.7 (90.6‒92.7) | 70.1 (67.3‒72.8) | 0.000 | 82.1 (79.4‒84.9) | 73.2 (70.2‒76.1) | 0.000 |
| 120 months (10 years) cancer specific survival time | 97.4 (96.4‒98.4) | 75.2 (72.4‒78.1) | 0.000 | 87.1 (84.4‒89.9) | 78.7 (75.7‒81.8) | 0.000 |
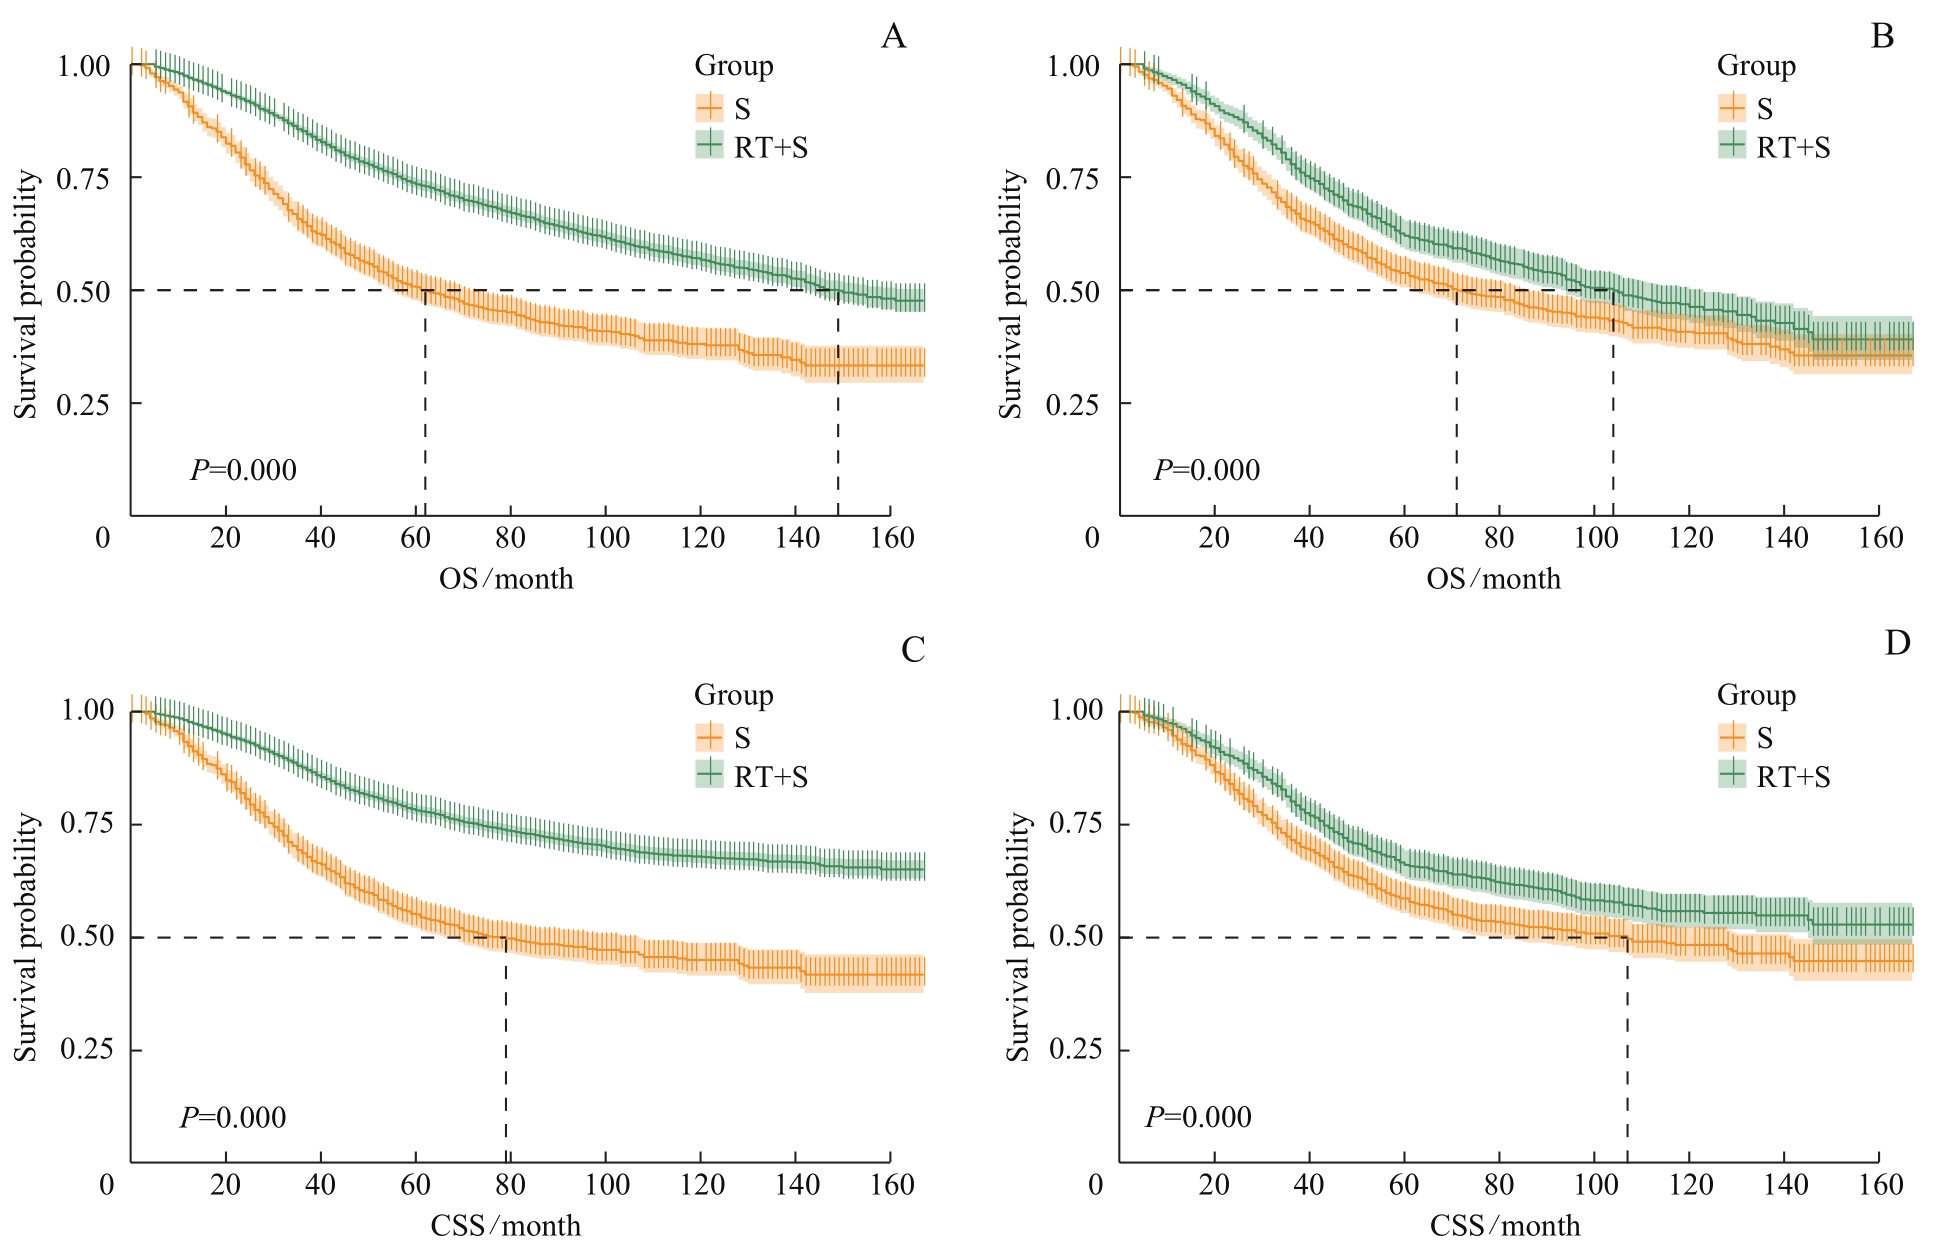
Fig 3 Survival curves of the RT+S group and the S group before and after PSM
| Test model | Before PSM | After PSM | ||||
|---|---|---|---|---|---|---|
S group (95%CI) | S+RT group (95%CI) | P value | S group (95%CI) | S+RT group (95%CI) | P value | |
| Log-rank | ||||||
| Median OS/month | 62 (55‒72) | 142 (129‒155) | ‒ | 106 (88‒129) | 116 (98‒132) | ‒ |
| Median CSS/month | 79 (66‒107) | NA | ‒ | NA | NA | ‒ |
| RMST | ||||||
| 60 months (5 years) survival time | 44.2 (43.0‒45.3) | 52.2 (51.5‒52.9) | 0.000 | 48.0 (46.7‒49.4) | 50.6 (49.4‒51.7) | 0.005 |
60 months (5 years) cancer specific survival time | 45.9 (44.8‒47.0) | 53.8 (53.2‒54.5) | 0.000 | 49.9 (48.7‒51.2) | 51.7 (50.6‒52.9) | 0.033 |
| 120 months (10 years) survival time | 70.1 (67.3‒72.8) | 90.3 (88.5‒92.1) | 0.000 | 80.3 (77.0‒83.6) | 84.6 (81.5‒87.6) | 0.065 |
120 months (10 years) cancer specific survival time | 75.2 (72.4‒78.1) | 96.6 (94.8‒98.3) | 0.000 | 86.3 (83.0‒89.6) | 89.6 (86.6‒92.7) | 0.147 |
Tab 4 Comparison of OS and CSS in the patients with rectal cancer between the S group and the S+RT group
| Test model | Before PSM | After PSM | ||||
|---|---|---|---|---|---|---|
S group (95%CI) | S+RT group (95%CI) | P value | S group (95%CI) | S+RT group (95%CI) | P value | |
| Log-rank | ||||||
| Median OS/month | 62 (55‒72) | 142 (129‒155) | ‒ | 106 (88‒129) | 116 (98‒132) | ‒ |
| Median CSS/month | 79 (66‒107) | NA | ‒ | NA | NA | ‒ |
| RMST | ||||||
| 60 months (5 years) survival time | 44.2 (43.0‒45.3) | 52.2 (51.5‒52.9) | 0.000 | 48.0 (46.7‒49.4) | 50.6 (49.4‒51.7) | 0.005 |
60 months (5 years) cancer specific survival time | 45.9 (44.8‒47.0) | 53.8 (53.2‒54.5) | 0.000 | 49.9 (48.7‒51.2) | 51.7 (50.6‒52.9) | 0.033 |
| 120 months (10 years) survival time | 70.1 (67.3‒72.8) | 90.3 (88.5‒92.1) | 0.000 | 80.3 (77.0‒83.6) | 84.6 (81.5‒87.6) | 0.065 |
120 months (10 years) cancer specific survival time | 75.2 (72.4‒78.1) | 96.6 (94.8‒98.3) | 0.000 | 86.3 (83.0‒89.6) | 89.6 (86.6‒92.7) | 0.147 |

Fig 4 Survival curves of the S group and the S+RT group before and after PSM
| Factor | OS | CSS | ||||||
|---|---|---|---|---|---|---|---|---|
| Univariate analysis | Multivariate analysis | Univariate analysis | Multivariate analysis | |||||
| HR (95%CI) | P value | HR (95%CI) | P value | HR (95%CI) | P value | HR (95%CI) | P value | |
| Group | ||||||||
| S | Reference | Reference | Reference | Reference | ||||
| RT+S | 0.77 (0.68‒0.88) | 0.000 | 0.73 (0.64‒0.83) | 0.000 | 0.75 (0.65‒0.87) | 0.000 | 0.71 (0.62‒0.82) | 0.000 |
| Age | ||||||||
| <50 years | Reference | Reference | Reference | |||||
| ≥50 years | 1.37 (1.15‒1.63) | 0.000 | 1.47 (1.23‒1.75) | 0.000 | 1.14 (0.95‒1.37) | 0.144 | ||
| Gender | ||||||||
| Male | Reference | Reference | ||||||
| Female | 0.90 (0.79‒1.02) | 0.107 | 0.89 (0.77‒1.03) | 0.120 | ||||
| Race | ||||||||
| White | Reference | Reference | Reference | Reference | ||||
| Black | 1.32 (1.07‒1.62) | 0.010 | 1.27 (1.03‒1.57) | 0.025 | 1.43 (1.15‒1.79) | 0.002 | 1.38 (1.10‒1.73) | 0.005 |
| Others | 0.96 (0.80‒1.14) | 0.623 | 1.03 (0.86‒1.23) | 0.733 | 0.96 (0.79‒1.16) | 0.659 | 1.02 (0.84‒1.24) | 0.858 |
| Marital status | ||||||||
| Married | Reference | Reference | Reference | Reference | ||||
| Others | 1.31 (1.15‒1.49) | 0.000 | 1.27 (1.11‒1.44) | 0.000 | 1.30 (1.13‒1.50) | 0.000 | 1.27 (1.10‒1.46) | 0.001 |
| Tumor histology | ||||||||
| Adenocarcinoma | Reference | Reference | ||||||
| Others | 0.96 (0.82‒1.12) | 0.598 | 0.95 (0.80‒1.13) | 0.572 | ||||
| Tumor size | ||||||||
| ≤30 mm | Reference | Reference | Reference | Reference | ||||
| >30‒50 mm | 1.54 (1.29‒1.85) | 0.000 | 1.30 (1.08‒1.57) | 0.007 | 1.59 (1.29‒1.95) | 0.000 | 1.26 (1.02‒1.56) | 0.035 |
| >50 mm | 1.96 (1.62‒2.37) | 0.000 | 1.60 (1.32‒1.95) | 0.000 | 2.13 (1.72‒2.63) | 0.000 | 1.56 (1.26‒1.95) | 0.000 |
| Histologic grade | ||||||||
| Well differentiated | Reference | Reference | Reference | Reference | ||||
| Moderately differentiated | 1.18 (0.81‒1.72) | 0.388 | 1.04 (0.71‒1.52) | 0.834 | 1.26 (0.82‒1.95) | 0.292 | 1.06 (0.68‒1.64) | 0.802 |
| Poorly differentiated/ undifferentiated | 2.03 (1.37‒3.00) | 0.000 | 1.81 (1.22‒2.69) | 0.003 | 2.34 (1.50‒3.67) | 0.000 | 1.98 (1.26‒3.11) | 0.003 |
| TNM stage | ||||||||
| Ⅰ | Reference | Reference | Reference | Reference | ||||
| Ⅱ | 0.86 (0.59‒1.26) | 0.443 | 0.73 (0.49‒1.08) | 0.112 | 0.96 (0.60‒1.54) | 0.881 | 0.85 (0.53‒1.37) | 0.502 |
| Ⅲ | 1.24 (0.89‒1.74) | 0.209 | 1.03 (0.73‒1.46) | 0.852 | 1.41 (0.93‒2.14) | 0.107 | 1.20 (0.79‒1.83) | 0.398 |
| Ⅳ | 3.70 (2.64‒5.19) | 0.000 | 3.05 (2.16‒4.32) | 0.000 | 4.91 (3.25‒7.43) | 0.000 | 4.17 (2.73‒6.36) | 0.000 |
| Regional nodes examined | ||||||||
| <12 | Reference | Reference | ||||||
| ≥12 | 0.90 (0.79‒1.02) | 0.099 | 0.96 (0.83‒1.10) | 0.539 | ||||
Tab 5 Univariate and multivariate Cox regression analysis of OS and CSS of rectal cancer patients between the RT+S group and the S group
| Factor | OS | CSS | ||||||
|---|---|---|---|---|---|---|---|---|
| Univariate analysis | Multivariate analysis | Univariate analysis | Multivariate analysis | |||||
| HR (95%CI) | P value | HR (95%CI) | P value | HR (95%CI) | P value | HR (95%CI) | P value | |
| Group | ||||||||
| S | Reference | Reference | Reference | Reference | ||||
| RT+S | 0.77 (0.68‒0.88) | 0.000 | 0.73 (0.64‒0.83) | 0.000 | 0.75 (0.65‒0.87) | 0.000 | 0.71 (0.62‒0.82) | 0.000 |
| Age | ||||||||
| <50 years | Reference | Reference | Reference | |||||
| ≥50 years | 1.37 (1.15‒1.63) | 0.000 | 1.47 (1.23‒1.75) | 0.000 | 1.14 (0.95‒1.37) | 0.144 | ||
| Gender | ||||||||
| Male | Reference | Reference | ||||||
| Female | 0.90 (0.79‒1.02) | 0.107 | 0.89 (0.77‒1.03) | 0.120 | ||||
| Race | ||||||||
| White | Reference | Reference | Reference | Reference | ||||
| Black | 1.32 (1.07‒1.62) | 0.010 | 1.27 (1.03‒1.57) | 0.025 | 1.43 (1.15‒1.79) | 0.002 | 1.38 (1.10‒1.73) | 0.005 |
| Others | 0.96 (0.80‒1.14) | 0.623 | 1.03 (0.86‒1.23) | 0.733 | 0.96 (0.79‒1.16) | 0.659 | 1.02 (0.84‒1.24) | 0.858 |
| Marital status | ||||||||
| Married | Reference | Reference | Reference | Reference | ||||
| Others | 1.31 (1.15‒1.49) | 0.000 | 1.27 (1.11‒1.44) | 0.000 | 1.30 (1.13‒1.50) | 0.000 | 1.27 (1.10‒1.46) | 0.001 |
| Tumor histology | ||||||||
| Adenocarcinoma | Reference | Reference | ||||||
| Others | 0.96 (0.82‒1.12) | 0.598 | 0.95 (0.80‒1.13) | 0.572 | ||||
| Tumor size | ||||||||
| ≤30 mm | Reference | Reference | Reference | Reference | ||||
| >30‒50 mm | 1.54 (1.29‒1.85) | 0.000 | 1.30 (1.08‒1.57) | 0.007 | 1.59 (1.29‒1.95) | 0.000 | 1.26 (1.02‒1.56) | 0.035 |
| >50 mm | 1.96 (1.62‒2.37) | 0.000 | 1.60 (1.32‒1.95) | 0.000 | 2.13 (1.72‒2.63) | 0.000 | 1.56 (1.26‒1.95) | 0.000 |
| Histologic grade | ||||||||
| Well differentiated | Reference | Reference | Reference | Reference | ||||
| Moderately differentiated | 1.18 (0.81‒1.72) | 0.388 | 1.04 (0.71‒1.52) | 0.834 | 1.26 (0.82‒1.95) | 0.292 | 1.06 (0.68‒1.64) | 0.802 |
| Poorly differentiated/ undifferentiated | 2.03 (1.37‒3.00) | 0.000 | 1.81 (1.22‒2.69) | 0.003 | 2.34 (1.50‒3.67) | 0.000 | 1.98 (1.26‒3.11) | 0.003 |
| TNM stage | ||||||||
| Ⅰ | Reference | Reference | Reference | Reference | ||||
| Ⅱ | 0.86 (0.59‒1.26) | 0.443 | 0.73 (0.49‒1.08) | 0.112 | 0.96 (0.60‒1.54) | 0.881 | 0.85 (0.53‒1.37) | 0.502 |
| Ⅲ | 1.24 (0.89‒1.74) | 0.209 | 1.03 (0.73‒1.46) | 0.852 | 1.41 (0.93‒2.14) | 0.107 | 1.20 (0.79‒1.83) | 0.398 |
| Ⅳ | 3.70 (2.64‒5.19) | 0.000 | 3.05 (2.16‒4.32) | 0.000 | 4.91 (3.25‒7.43) | 0.000 | 4.17 (2.73‒6.36) | 0.000 |
| Regional nodes examined | ||||||||
| <12 | Reference | Reference | ||||||
| ≥12 | 0.90 (0.79‒1.02) | 0.099 | 0.96 (0.83‒1.10) | 0.539 | ||||
| Factor | OS | CSS | ||||||
|---|---|---|---|---|---|---|---|---|
| Univariate analysis | Multivariate analysis | Univariate analysis | Multivariate analysis | |||||
| HR (95%CI) | P value | HR (95%CI) | P value | HR (95%CI) | P value | HR (95%CI) | P value | |
| Group | ||||||||
| S | Reference | Reference | ||||||
| S+RT | 1.12 (0.96‒1.30) | 0.150 | 1.13 (0.95‒1.34) | 0.166 | ||||
| Age | ||||||||
| <50 years | Reference | Reference | Reference | Reference | ||||
| ≥50 years | 1.55 (1.25‒1.92) | 0.000 | 1.82 (1.46‒2.26) | 0.000 | 1.30 (1.04‒1.64) | 0.024 | 1.81 (1.45‒2.24) | 0.000 |
| Gender | ||||||||
| Male | Reference | Reference | ||||||
| Female | 0.98 (0.84‒1.14) | 0.750 | 1.00 (0.84‒1.19) | 0.992 | ||||
| Race | ||||||||
| White | Reference | Reference | Reference | |||||
| Black | 1.30 (1.01‒1.67) | 0.045 | 1.35 (1.04‒1.75) | 0.024 | 1.25 (0.94‒1.67) | 0.125 | ||
| Others | 0.81 (0.65‒1.01) | 0.065 | 0.99 (0.79‒1.24) | 0.914 | 0.81 (0.63‒1.04) | 0.101 | ||
| Marital status | ||||||||
| Married | Reference | Reference | Reference | Reference | ||||
| Others | 1.43 (1.23‒1.67) | 0.000 | 1.35 (1.16‒1.58) | 0.000 | 1.42 (1.19‒1.68) | 0.000 | 1.39 (1.19‒1.62) | 0.000 |
| Tumor histology | ||||||||
| Adenocarcinoma | Reference | Reference | ||||||
| Others | 1.07 (0.90‒1.27) | 0.426 | 1.14 (0.94‒1.38) | 0.185 | ||||
| Tumor size | ||||||||
| ≤30 mm | Reference | Reference | Reference | Reference | ||||
| >30‒50 mm | 1.78 (1.44‒2.21) | 0.000 | 1.64 (1.32‒2.05) | 0.000 | 1.90 (1.48‒2.43) | 0.000 | 1.64 (1.32‒2.05) | 0.000 |
| >50 mm | 2.15 (1.72‒2.70) | 0.000 | 2.01 (1.59‒2.54) | 0.000 | 2.41 (1.86‒3.12) | 0.000 | 2.02 (1.60‒2.56) | 0.000 |
| Histologic grade | ||||||||
| Well differentiated | Reference | Reference | Reference | Reference | ||||
| Moderately differentiated | 0.94 (0.62‒1.44) | 0.790 | 0.88 (0.58‒1.34) | 0.549 | 1.08 (0.65‒1.78) | 0.771 | 0.89 (0.58‒1.35) | 0.574 |
| Poorly differentiated/ undifferentiated | 1.58 (1.02‒2.45) | 0.041 | 1.38 (0.89‒2.16) | 0.150 | 1.86 (1.11‒3.13) | 0.019 | 1.40 (0.90‒2.17) | 0.139 |
| TNM stage | ||||||||
| Ⅰ | Reference | Reference | Reference | Reference | ||||
| Ⅱ | 1.11 (0.72‒1.70) | 0.635 | 0.78 (0.50‒1.22) | 0.280 | 1.48 (0.86‒2.55) | 0.160 | 0.76 (0.49‒1.19) | 0.232 |
| Ⅲ | 1.45 (0.98‒2.12) | 0.060 | 1.10 (0.74‒1.64) | 0.634 | 1.88 (1.14‒3.12) | 0.014 | 1.07 (0.72‒1.58) | 0.753 |
| Ⅳ | 4.67 (3.13‒6.98) | 0.000 | 3.54 (2.33‒5.38) | 0.000 | 7.30 (4.36‒12.23) | 0.000 | 3.39 (2.24‒5.15) | 0.000 |
| Regional nodes examined | ||||||||
| <12 | Reference | Reference | ||||||
| ≥12 | 0.89 (0.76‒1.04) | 0.137 | 0.99 (0.83‒1.18) | 0.894 | ||||
Tab 6 Univariate and multivariate Cox regression analysis of OS and CSS of rectal cancer patients between the S group and the S+RT group
| Factor | OS | CSS | ||||||
|---|---|---|---|---|---|---|---|---|
| Univariate analysis | Multivariate analysis | Univariate analysis | Multivariate analysis | |||||
| HR (95%CI) | P value | HR (95%CI) | P value | HR (95%CI) | P value | HR (95%CI) | P value | |
| Group | ||||||||
| S | Reference | Reference | ||||||
| S+RT | 1.12 (0.96‒1.30) | 0.150 | 1.13 (0.95‒1.34) | 0.166 | ||||
| Age | ||||||||
| <50 years | Reference | Reference | Reference | Reference | ||||
| ≥50 years | 1.55 (1.25‒1.92) | 0.000 | 1.82 (1.46‒2.26) | 0.000 | 1.30 (1.04‒1.64) | 0.024 | 1.81 (1.45‒2.24) | 0.000 |
| Gender | ||||||||
| Male | Reference | Reference | ||||||
| Female | 0.98 (0.84‒1.14) | 0.750 | 1.00 (0.84‒1.19) | 0.992 | ||||
| Race | ||||||||
| White | Reference | Reference | Reference | |||||
| Black | 1.30 (1.01‒1.67) | 0.045 | 1.35 (1.04‒1.75) | 0.024 | 1.25 (0.94‒1.67) | 0.125 | ||
| Others | 0.81 (0.65‒1.01) | 0.065 | 0.99 (0.79‒1.24) | 0.914 | 0.81 (0.63‒1.04) | 0.101 | ||
| Marital status | ||||||||
| Married | Reference | Reference | Reference | Reference | ||||
| Others | 1.43 (1.23‒1.67) | 0.000 | 1.35 (1.16‒1.58) | 0.000 | 1.42 (1.19‒1.68) | 0.000 | 1.39 (1.19‒1.62) | 0.000 |
| Tumor histology | ||||||||
| Adenocarcinoma | Reference | Reference | ||||||
| Others | 1.07 (0.90‒1.27) | 0.426 | 1.14 (0.94‒1.38) | 0.185 | ||||
| Tumor size | ||||||||
| ≤30 mm | Reference | Reference | Reference | Reference | ||||
| >30‒50 mm | 1.78 (1.44‒2.21) | 0.000 | 1.64 (1.32‒2.05) | 0.000 | 1.90 (1.48‒2.43) | 0.000 | 1.64 (1.32‒2.05) | 0.000 |
| >50 mm | 2.15 (1.72‒2.70) | 0.000 | 2.01 (1.59‒2.54) | 0.000 | 2.41 (1.86‒3.12) | 0.000 | 2.02 (1.60‒2.56) | 0.000 |
| Histologic grade | ||||||||
| Well differentiated | Reference | Reference | Reference | Reference | ||||
| Moderately differentiated | 0.94 (0.62‒1.44) | 0.790 | 0.88 (0.58‒1.34) | 0.549 | 1.08 (0.65‒1.78) | 0.771 | 0.89 (0.58‒1.35) | 0.574 |
| Poorly differentiated/ undifferentiated | 1.58 (1.02‒2.45) | 0.041 | 1.38 (0.89‒2.16) | 0.150 | 1.86 (1.11‒3.13) | 0.019 | 1.40 (0.90‒2.17) | 0.139 |
| TNM stage | ||||||||
| Ⅰ | Reference | Reference | Reference | Reference | ||||
| Ⅱ | 1.11 (0.72‒1.70) | 0.635 | 0.78 (0.50‒1.22) | 0.280 | 1.48 (0.86‒2.55) | 0.160 | 0.76 (0.49‒1.19) | 0.232 |
| Ⅲ | 1.45 (0.98‒2.12) | 0.060 | 1.10 (0.74‒1.64) | 0.634 | 1.88 (1.14‒3.12) | 0.014 | 1.07 (0.72‒1.58) | 0.753 |
| Ⅳ | 4.67 (3.13‒6.98) | 0.000 | 3.54 (2.33‒5.38) | 0.000 | 7.30 (4.36‒12.23) | 0.000 | 3.39 (2.24‒5.15) | 0.000 |
| Regional nodes examined | ||||||||
| <12 | Reference | Reference | ||||||
| ≥12 | 0.89 (0.76‒1.04) | 0.137 | 0.99 (0.83‒1.18) | 0.894 | ||||

Fig 5 Subgroup analysis of OS and CSS between the RT+S group and the S group
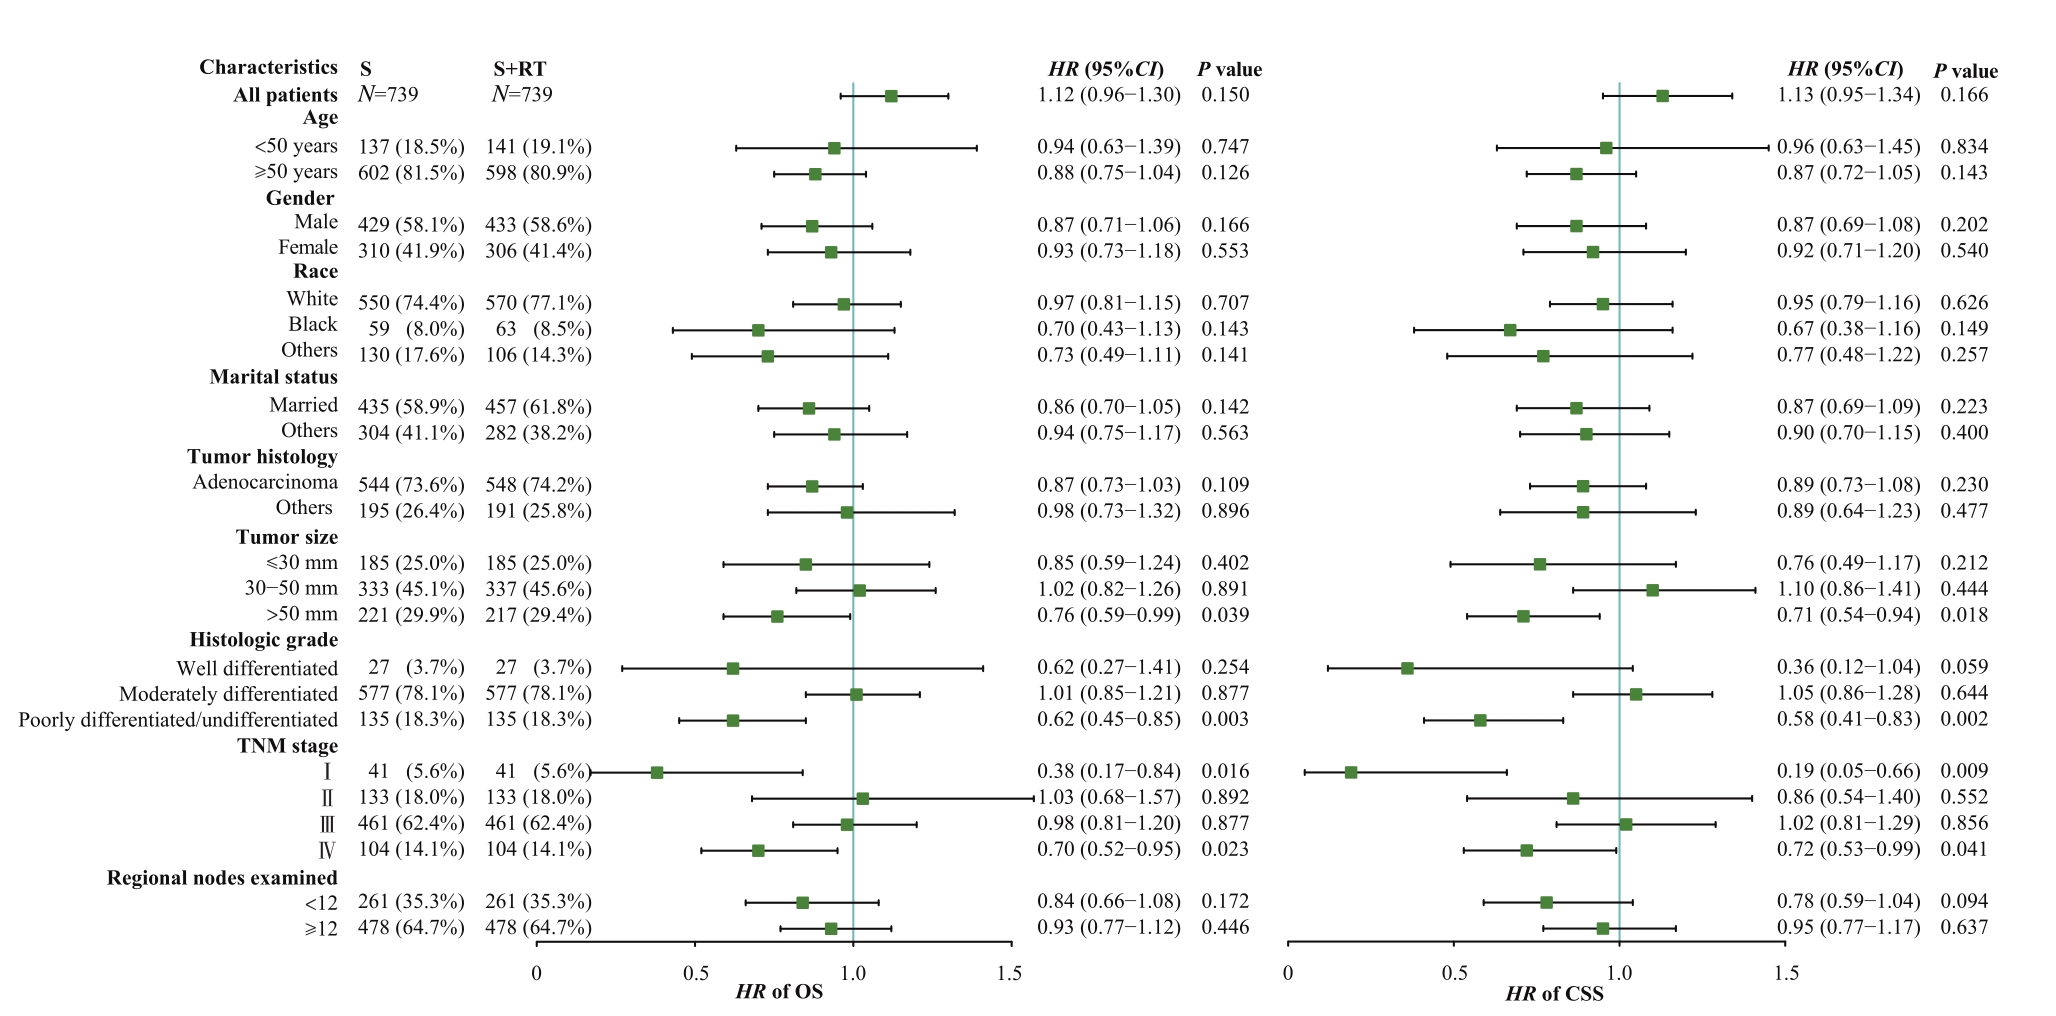
Fig 6 Subgroup analysis of OS and CSS between the S group and the S+RT group
| 1 | SUNG H, FERLAY J, SIEGEL R L, et al. Global cancer statistics 2020: GLOBOCAN estimates of incidence and mortality worldwide for 36 cancers in 185 countries[J]. CA Cancer J Clin, 2021, 71(3): 209-249. |
| 2 | ZHENG R S, ZHANG S W, ZENG H M, et al. Cancer incidence and mortality in China, 2016[J]. J Natl Cancer Cent, 2022, 2(1): 1-9. |
| 3 | BENSON A B, VENOOK A P, AL-HAWARY M M, et al. NCCN guidelines insights: colon cancer, version 2.2018[J]. J Natl Compr Canc Netw, 2018, 16(4): 359-369. |
| 4 | ROH M S, COLANGELO L H, O′CONNELL M J, et al. Preoperative multimodality therapy improves disease-free survival in patients with carcinoma of the rectum: NSABP R-03[J]. J Clin Oncol, 2009, 27(31): 5124-5130. |
| 5 | Colorectal Cancer Collaborative Group. Adjuvant radiotherapy for rectal cancer: a systematic overview of 8,507 patients from 22 randomised trials[J]. Lancet, 2001, 358(9290): 1291-1304. |
| 6 | MA B, GAO P, WANG H C, et al. What has preoperative radio(chemo)therapy brought to localized rectal cancer patients in terms of perioperative and long-term outcomes over the past decades? A systematic review and meta-analysis based on 41,121 patients[J]. Int J Cancer, 2017, 141(5): 1052-1065. |
| 7 | ZHONG W, XUE X J, DAI L Z, et al. Neoadjuvant treatments for resectable rectal cancer: a network meta-analysis[J]. Exp Ther Med, 2020, 19(4): 2604-2614. |
| 8 | MARTIN S T, HENEGHAN H M, WINTER D C. Systematic review and meta-analysis of outcomes following pathological complete response to neoadjuvant chemoradiotherapy for rectal cancer[J]. Br J Surg, 2012, 99(7): 918-928. |
| 9 | TRINQUART L, JACOT J, CONNER S C, et al. Comparison of treatment effects measured by the hazard ratio and by the ratio of restricted mean survival times in oncology randomized controlled trials[J]. J Clin Oncol, 2016, 34(15): 1813-1819. |
| 10 | WOLSKI A, GRAFFÉO N, GIORGI R, et al. A permutation test based on the restricted mean survival time for comparison of net survival distributions in non-proportional excess hazard settings[J]. Stat Methods Med Res, 2020, 29(6): 1612-1623. |
| 11 | IRWIN J O. The standard error of an estimate of expectation of life, with special reference to expectation of tumourless life in experiments with mice[J]. J Hyg (Lond), 1949, 47(2): 188. |
| 12 | MAAS M, NELEMANS P J, VALENTINI V, et al. Long-term outcome in patients with a pathological complete response after chemoradiation for rectal cancer: a pooled analysis of individual patient data[J]. Lancet Oncol, 2010, 11(9): 835-844. |
| 13 | PARK I J, YOU Y N, AGARWAL A, et al. Neoadjuvant treatment response as an early response indicator for patients with rectal cancer[J]. J Clin Oncol, 2012, 30(15): 1770-1776. |
| 14 | ARENAS PRAT M, SABATER S, BONET M, et al. EP-2303: should radiotherapy be avoided after neoadjuvant chemotherapy in complete response breast cancer?[J]. Radiother Oncol, 2018, 127: S1271. |
| 15 | LOGAN J K, HUBER K E, DIPETRILLO T A, et al. Patterns of care of radiation therapy in patients with stage Ⅳ rectal cancer: a Surveillance, Epidemiology, and End Results analysis of patients from 2004 to 2009[J]. Cancer, 2014, 120(5): 731-737. |
| 16 | BUJKO K, PARTYCKI M, PIETRZAK L. Neoadjuvant radiotherapy (5×5 Gy): immediate versus delayed surgery[J]. Recent Results Cancer Res, 2014, 203: 171-187. |
| 17 | BACH S P, GILBERT A, BROCK K, et al. Radical surgery versus organ preservation via short-course radiotherapy followed by transanal endoscopic microsurgery for early-stage rectal cancer (TREC): a randomised, open-label feasibility study[J]. Lancet Gastroenterol Hepatol, 2021, 6(2): 92-105. |
| 18 | HAYES I P, MILANZI E, GIBBS P, et al. Neoadjuvant chemoradiotherapy and tumor recurrence in patients with early T-stage cancer of the lower rectum[J]. Ann Surg Oncol, 2020, 27(5): 1570-1579. |
| 19 | MCLAUGHLIN C, KIM N K, BANDYOPADHYAY D, et al. Adjuvant radiation therapy for T4 non-rectal colon adenocarcinoma provides a cause-specific survival advantage: a SEER database analysis[J]. Radiother Oncol, 2019, 133: 50-53. |
| 20 | HUANG Y, GU X, GE K X, et al. The survival benefit of adjuvant radiotherapy for pathological T4N2M0 colon cancer in the Modern Chemotherapy Era: evidence from the SEER database 2004‒2015[J]. Artif Cells Nanomed Biotechnol, 2020, 48(1): 834-840. |
| 21 | SIEGEL R L, JEMAL A, WARD E M. Increase in incidence of colorectal cancer among young men and women in the United States[J]. Cancer Epidemiol Biomarkers Prev, 2009, 18(6): 1695-1698. |
| 22 | WANG L, ZHONG X H, LIN H Q, et al. Identifying the long-term survival beneficiary of preoperative radiotherapy for rectal cancer in the TME era[J]. Sci Rep, 2022, 12(1): 4617. |
| 23 | KOLARICH A, GEORGE T J Jr, HUGHES S J, et al. Rectal cancer patients younger than 50 years lack a survival benefit from NCCN guideline-directed treatment for stage Ⅱ and Ⅲ disease[J]. Cancer, 2018, 124(17): 3510-3519. |
| 24 | STEINHAGEN E, SHIA, RIEDEL E, et al. Response to neoadjuvant therapy in patients with early age-of-onset rectal cancer[J]. Dis Colon Rectum, 2013, 56(1): 58-63. |
| 25 | ZHANG Y Y, YAN L L, WU Y, et al. Worse treatment response to neoadjuvant chemoradiotherapy in young patients with locally advanced rectal cancer[J]. BMC Cancer, 2020, 20(1): 854. |
| 26 | LEE S, MA C, ZHANG S, et al. Marital status, living arrangement, and cancer recurrence and survival in patients with stage Ⅲ colon cancer: findings from CALGB 89803 (Alliance)[J]. Oncologist, 2022, 27(6): e494-e505. |
| [1] | Mei Zixian, Meng Xuchen, Su Wenjing, Zhong Weijie, Tang Dingzhong, Li Yi. Clinical-inflammatory combined model for predicting poor prognosis in male patients with anterior circulation acute ischemic stroke with large vessel occlusion after mechanical thrombectomy [J]. Journal of Shanghai Jiao Tong University (Medical Science), 2026, 46(3): 332-339. |
| [2] | CHEN Siyuan, SHI Qing, FU Di, WANG Li, CHENG Shu, XU Pengpeng, ZHAO Weili. Clinicopathologic characteristics, gene mutation profile, and prognostic analysis of diffuse large B-cell lymphoma with lung involvement [J]. Journal of Shanghai Jiao Tong University (Medical Science), 2025, 45(9): 1214-1220. |
| [3] | YAN Zhi, WU Xingyue, YAO Weiqin, YAN Lingzhi, JIN Song, SHANG Jingjing, SHI Xiaolan, WU Depei, FU Chengcheng. Dynamic changes and prognostic significance of immunoparesis in newly diagnosed multiple myeloma patients [J]. Journal of Shanghai Jiao Tong University (Medical Science), 2025, 45(7): 807-814. |
| [4] | XU Tianyun, SHEN Yiming, JIANG Meng. Clinical management of heart failure with improved ejection fraction: treatment and maintenance [J]. Journal of Shanghai Jiao Tong University (Medical Science), 2025, 45(4): 493-499. |
| [5] | WANG Boen, CHEN Siyuan, SHI Qing, ZHANG Muchen, YI Hongmei, DONG Lei, WANG Li, CHENG Shu, XU Pengpeng, ZHAO Weili. Clinicopathologic characteristics of patients with kidney-involved diffuse large B-cell lymphoma [J]. Journal of Shanghai Jiao Tong University (Medical Science), 2024, 44(9): 1162-1168. |
| [6] | SONG Chenlu, XIANG Jun, YANG Huizhong. Early alarming effect of serum heparin-binding protein on prognosis and occurrence of sepsis in severely burned patients [J]. Journal of Shanghai Jiao Tong University (Medical Science), 2024, 44(4): 474-481. |
| [7] | WANG Guijie, DU Chuanchong, LU Ye, ZHAO Jian, SHEN Xie, JIN Donglin, GENG Jiacai. Changes of serum high mobility group box 1 and soluble triggering receptor expressed on myeloid cells-1 in patients with multiple injuries and their prognostic significance [J]. Journal of Shanghai Jiao Tong University (Medical Science), 2024, 44(3): 350-357. |
| [8] | LUO Mengxing, ZOU Xin, GAO Yaxian, WU Xiaocui, YU Fangyou, HU Yang, ZENG Qibing, LIU Zhonghua. Analysis of the effect of anti-tuberculosis treatment and lung injury in patients with tuberculosis combined with underlying disease [J]. Journal of Shanghai Jiao Tong University (Medical Science), 2023, 43(8): 1017-1023. |
| [9] | LI Ying, TAN Yangxia, YIN Hongxin, JIANG Yanling, CHEN Li, MENG Guoyu. Research progress in the pathogenesis and prognosis of ZNF384 fusion subtype acute leukemia [J]. Journal of Shanghai Jiao Tong University (Medical Science), 2023, 43(5): 631-640. |
| [10] | MEN Ru, ZHU Minxia, ZHANG Weiming. Serum potassium level in maintenance hemodialysis patients and its effect on outcome [J]. Journal of Shanghai Jiao Tong University (Medical Science), 2023, 43(4): 507-513. |
| [11] | LI Fang, LI Kaiyang, WANG Jue, YAN Ruiyang, SHEN Hui, LIU Min. Expression and clinical significance of PLA2G2A in kidney renal papillary cell carcinoma [J]. Journal of Shanghai Jiao Tong University (Medical Science), 2023, 43(2): 152-161. |
| [12] | HOU Shumin, SHAO Jingbo. Research progress in clinical characteristics, diagnosis and prognosis of TdT-negative lymphoblastic lymphoma/acute lymphoblastic leukemia [J]. Journal of Shanghai Jiao Tong University (Medical Science), 2023, 43(1): 120-124. |
| [13] | QIU Jiahui, CAI Qianqian, YANG Yan, CHENG Feichi, QIU Zhengjun, HUANG Chen. Value of combined perineural lymphovascular invasion and tumor-stroma ratio in guiding the prognosis of colorecatal cancer [J]. Journal of Shanghai Jiao Tong University (Medical Science), 2022, 42(8): 1070-1080. |
| [14] | WEI Xuemin, GAO Chengjin. Research progress of clinical application of ASPECT score in acute ischemic stroke [J]. Journal of Shanghai Jiao Tong University (Medical Science), 2022, 42(7): 919-924. |
| [15] | ZHU Tianyu, ZONG Chunyan, XU Shiqiong, GE Shengfang, FAN Xianqun, JIA Renbing. Relationship between histopathological features, Ki-67 expression and prognosis of conjunctival melanoma [J]. Journal of Shanghai Jiao Tong University (Medical Science), 2022, 42(5): 617-623. |
| Viewed | ||||||
|
Full text |
|
|||||
|
Abstract |
|
|||||