Journal of Shanghai Jiao Tong University (Medical Science) ›› 2024, Vol. 44 ›› Issue (1): 87-97.doi: 10.3969/j.issn.1674-8115.2024.01.010
• Clinical research • Previous Articles Next Articles
HAN Rui1,2( ), WU Qian1,2(), LIU Dan1,2, CHENG Di1,2, ZHANG Ying1,2, NI Jiacheng1, KANG Piao1,2, CHEN Anran1,2, YU Shujie1,2, FANG Qichen1, LI Huating1,2()
Received:2023-05-31
Accepted:2023-12-21
Online:2024-01-28
Published:2024-01-28
Contact:
LI Huating
E-mail:Hanrui517@163.com;wuqian2021@sjtu.edu.cn;huarting99@sjtu.edu.cn
Supported by:CLC Number:
HAN Rui, WU Qian, LIU Dan, CHENG Di, ZHANG Ying, NI Jiacheng, KANG Piao, CHEN Anran, YU Shujie, FANG Qichen, LI Huating. Alteration of cognitive function in overweight and obese adolescents and its relationship with serum FGF21 levels[J]. Journal of Shanghai Jiao Tong University (Medical Science), 2024, 44(1): 87-97.
Add to citation manager EndNote|Ris|BibTeX
URL: https://xuebao.shsmu.edu.cn/EN/10.3969/j.issn.1674-8115.2024.01.010
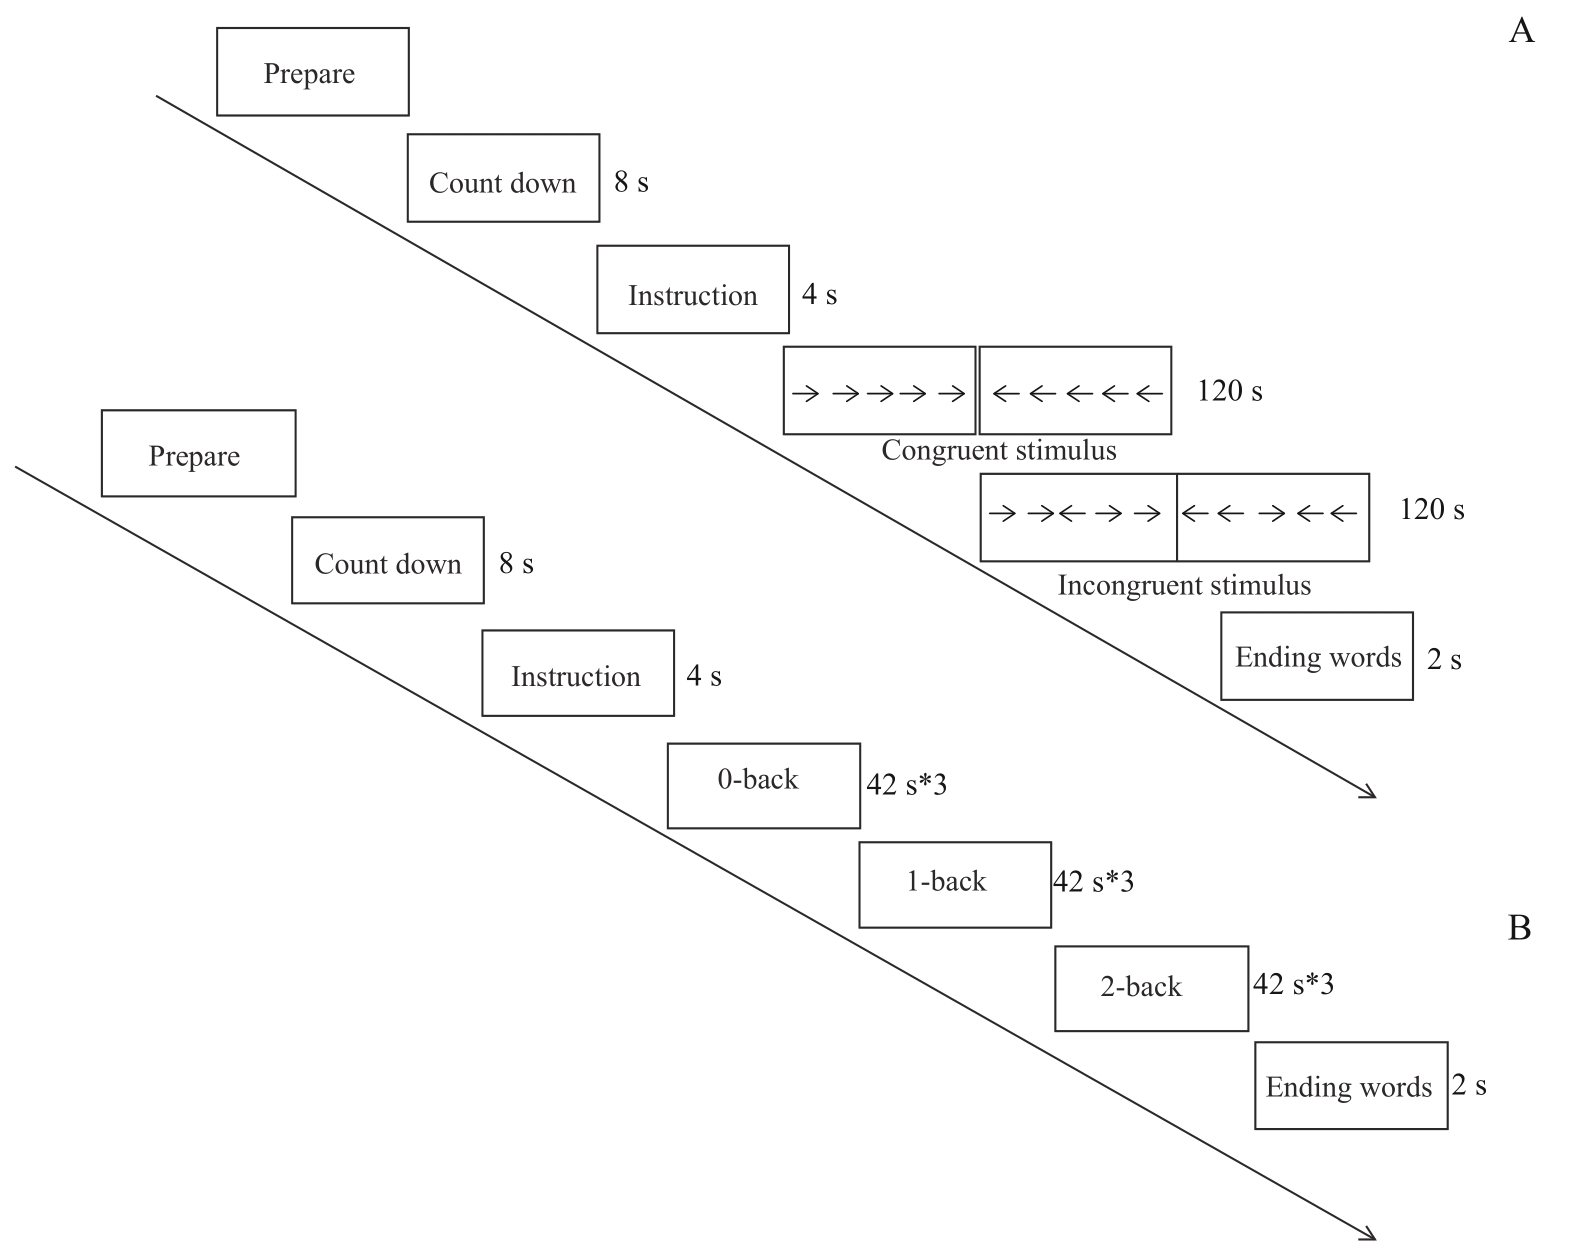
Fig 1 Flowchart of behavioral experiment
| Item | Normal weight group (n=50) | Overweight group (n=50) | Obese group (n=75) | P value |
|---|---|---|---|---|
| General information | ||||
| Age/year | 15.18 ± 0.48 | 15.52 ± 0.58 | 15.31 ± 0.52 | 0.327 |
| Gender (male/female)/n | 29/21 | 30/20 | 50/25 | 0.117 |
| BMI/(kg·m-2) | 21.35 ± 2.16 | 25.26 ± 0.98* | 30.37 ± 2.73*# | 0.000 |
| Body fat mass/kg | 12.73 ± 4.90 | 20.91 ± 4.69* | 29.95 ± 6.62*# | 0.000 |
| Body fat percentage/% | 20.93 ± 7.73 | 28.47 ± 7.21* | 33.55 ± 5.83*# | 0.000 |
| Waist circumference/cm | 73.95 ± 7.48 | 82.87 ± 3.69* | 95.53 ± 9.14*# | 0.000 |
| Hip circumference/cm | 94.70 ± 5.77 | 103.71 ± 3.80* | 110.09 ± 5.38*# | 0.000 |
| Waist-to-hip ratio | 0.80 ± 0.04 | 0.84 ± 0.01* | 0.89 ± 0.03*# | 0.000 |
| SBP/mmHg | 115.04 ± 12.27 | 120.29 ± 11.51 | 124.39 ± 9.98* | 0.000 |
| DBP/mmHg | 63.84 ± 7.42 | 69.09 ± 8.73* | 70.44 ± 9.27* | 0.000 |
| Laboratory testing indicator | ||||
| FPG/(mmol·L-1) | 4.62 ± 0.35 | 4.78 ± 0.30 | 4.79 ± 0.37* | 0.014 |
| FINS/(mmol·L-1) | 15.03 (11.43, 19.28) | 21.67 (17.62, 29.76)* | 29.94 (18.96, 38.32)*# | 0.000 |
| HbA1c/% | 5.31 ± 0.21 | 5.32 ± 0.16 | 5.42 ± 0.27* | 0.008 |
| Scr/(µmol·L-1) | 65.95 (58.40, 76.85) | 66.25 (56.33, 73.83)* | 71.90 (63.50, 79.50)* # | 0.052 |
| UA/(µmol·L-1) | 368.86 ± 85.19 | 397.66 ± 82.31 | 451.24 ± 102.53* | 0.000 |
| ALT/(U·L-1) | 14.00 (11.00, 17.25) | 17.50 (15.00, 27.00)* | 26.00 (20.00, 48.00)*# | 0.000 |
| AST/(U·L-1) | 21.00 (17.75, 24.00) | 21.00 (18.00, 26.25) | 26.00 (20.00, 32.00)* | 0.000 |
| GGT/(U·L-1) | 16.50 (14.00, 21.00) | 19.50 (14.75, 25.00) | 23.00 (17.00, 32.00)*# | 0.000 |
| TC/(mmol·L-1) | 4.36 ± 0.78 | 4.30 ± 0.76* | 4.33 ± 0.74*# | 0.880 |
| TAG/(mmol·L-1) | 0.74 (0.55, 1.04) | 0.87 (0.61, 1.29) | 0.92 (0.69, 1.37) | 0.012 |
| HDL-Ch/(mmol·L-1) | 1.44 ± 0.29 | 1.26 ± 0.26* | 1.21 ± 0.25* | 0.000 |
| LDL-Ch/(mmol·L-1) | 2.48 ± 0.70 | 2.56 ± 0.56 | 2.69 ± 0.69 | 0.076 |
Tab 1 Comparison of general information and laboratory testing indicators among the three groups of subjects
| Item | Normal weight group (n=50) | Overweight group (n=50) | Obese group (n=75) | P value |
|---|---|---|---|---|
| General information | ||||
| Age/year | 15.18 ± 0.48 | 15.52 ± 0.58 | 15.31 ± 0.52 | 0.327 |
| Gender (male/female)/n | 29/21 | 30/20 | 50/25 | 0.117 |
| BMI/(kg·m-2) | 21.35 ± 2.16 | 25.26 ± 0.98* | 30.37 ± 2.73*# | 0.000 |
| Body fat mass/kg | 12.73 ± 4.90 | 20.91 ± 4.69* | 29.95 ± 6.62*# | 0.000 |
| Body fat percentage/% | 20.93 ± 7.73 | 28.47 ± 7.21* | 33.55 ± 5.83*# | 0.000 |
| Waist circumference/cm | 73.95 ± 7.48 | 82.87 ± 3.69* | 95.53 ± 9.14*# | 0.000 |
| Hip circumference/cm | 94.70 ± 5.77 | 103.71 ± 3.80* | 110.09 ± 5.38*# | 0.000 |
| Waist-to-hip ratio | 0.80 ± 0.04 | 0.84 ± 0.01* | 0.89 ± 0.03*# | 0.000 |
| SBP/mmHg | 115.04 ± 12.27 | 120.29 ± 11.51 | 124.39 ± 9.98* | 0.000 |
| DBP/mmHg | 63.84 ± 7.42 | 69.09 ± 8.73* | 70.44 ± 9.27* | 0.000 |
| Laboratory testing indicator | ||||
| FPG/(mmol·L-1) | 4.62 ± 0.35 | 4.78 ± 0.30 | 4.79 ± 0.37* | 0.014 |
| FINS/(mmol·L-1) | 15.03 (11.43, 19.28) | 21.67 (17.62, 29.76)* | 29.94 (18.96, 38.32)*# | 0.000 |
| HbA1c/% | 5.31 ± 0.21 | 5.32 ± 0.16 | 5.42 ± 0.27* | 0.008 |
| Scr/(µmol·L-1) | 65.95 (58.40, 76.85) | 66.25 (56.33, 73.83)* | 71.90 (63.50, 79.50)* # | 0.052 |
| UA/(µmol·L-1) | 368.86 ± 85.19 | 397.66 ± 82.31 | 451.24 ± 102.53* | 0.000 |
| ALT/(U·L-1) | 14.00 (11.00, 17.25) | 17.50 (15.00, 27.00)* | 26.00 (20.00, 48.00)*# | 0.000 |
| AST/(U·L-1) | 21.00 (17.75, 24.00) | 21.00 (18.00, 26.25) | 26.00 (20.00, 32.00)* | 0.000 |
| GGT/(U·L-1) | 16.50 (14.00, 21.00) | 19.50 (14.75, 25.00) | 23.00 (17.00, 32.00)*# | 0.000 |
| TC/(mmol·L-1) | 4.36 ± 0.78 | 4.30 ± 0.76* | 4.33 ± 0.74*# | 0.880 |
| TAG/(mmol·L-1) | 0.74 (0.55, 1.04) | 0.87 (0.61, 1.29) | 0.92 (0.69, 1.37) | 0.012 |
| HDL-Ch/(mmol·L-1) | 1.44 ± 0.29 | 1.26 ± 0.26* | 1.21 ± 0.25* | 0.000 |
| LDL-Ch/(mmol·L-1) | 2.48 ± 0.70 | 2.56 ± 0.56 | 2.69 ± 0.69 | 0.076 |
| Item | Normal weight group (n=50) | Overweight group (n=50) | Obese group (n=75) | P value |
|---|---|---|---|---|
| Flanker task | ||||
| ACC | ||||
| Congruent stimulus | 0.97 ± 0.09 | 0.97 ± 0.04 | 0.98 ± 0.04 | 0.442 |
| Incongruent stimulus | 0.92 ± 0.09 | 0.93 ± 0.10 | 0.92 ± 0.14 | 0.854 |
| Reaction time/ms | ||||
| Congruent stimulus | 406.12 ± 108.32 | 431.35 ± 85.17 | 475.13 ± 84.31 | 0.000 |
| Incongruent stimulus | 465.41 ± 95.59 | 463.55 ± 59.92 | 524.01 ± 103.79 | 0.000 |
| n-back task | ||||
| ACC | ||||
| 0-back | 0.94 ± 0.05 | 0.93 ± 0.07 | 0.93 ± 0.08 | 0.641 |
| 1-back | 0.84 ± 0.12 | 0.85 ± 0.08 | 0.86 ± 0.12 | 0.404 |
| 2-back | 0.78 ± 0.13 | 0.72 ± 0.16 | 0.78 ± 0.15 | 0.751 |
| Reaction time/ms | ||||
| 0-back | 522.52 ± 103.11 | 539.48 ± 104.85 | 564.34 ± 116.74 | 0.050 |
| 1-back | 541.76 ± 149.67 | 587.90 ± 160.04 | 656.60 ± 168.99 | 0.000 |
| 2-back | 570.49 ± 174.48 | 625.08 ± 199.08 | 754.24 ± 201.57 | 0.000 |
Tab 2 Cognitive function assessment of the three groups of subjects
| Item | Normal weight group (n=50) | Overweight group (n=50) | Obese group (n=75) | P value |
|---|---|---|---|---|
| Flanker task | ||||
| ACC | ||||
| Congruent stimulus | 0.97 ± 0.09 | 0.97 ± 0.04 | 0.98 ± 0.04 | 0.442 |
| Incongruent stimulus | 0.92 ± 0.09 | 0.93 ± 0.10 | 0.92 ± 0.14 | 0.854 |
| Reaction time/ms | ||||
| Congruent stimulus | 406.12 ± 108.32 | 431.35 ± 85.17 | 475.13 ± 84.31 | 0.000 |
| Incongruent stimulus | 465.41 ± 95.59 | 463.55 ± 59.92 | 524.01 ± 103.79 | 0.000 |
| n-back task | ||||
| ACC | ||||
| 0-back | 0.94 ± 0.05 | 0.93 ± 0.07 | 0.93 ± 0.08 | 0.641 |
| 1-back | 0.84 ± 0.12 | 0.85 ± 0.08 | 0.86 ± 0.12 | 0.404 |
| 2-back | 0.78 ± 0.13 | 0.72 ± 0.16 | 0.78 ± 0.15 | 0.751 |
| Reaction time/ms | ||||
| 0-back | 522.52 ± 103.11 | 539.48 ± 104.85 | 564.34 ± 116.74 | 0.050 |
| 1-back | 541.76 ± 149.67 | 587.90 ± 160.04 | 656.60 ± 168.99 | 0.000 |
| 2-back | 570.49 ± 174.48 | 625.08 ± 199.08 | 754.24 ± 201.57 | 0.000 |
| Item | ACC | Reaction time | ||
|---|---|---|---|---|
| Incongruent stimulus | Congruent stimulus | Incongruent stimulus | Congruent stimulus | |
| BMI | -0.004 (0.958) | 0.033 (0.678) | 0.259 (0.000) | 0.337 (0.000) |
| Body fat mass | 0.004 (0.963) | 0.014 (0.857) | 0.154 (0.045) | 0.242 (0.000) |
| Body fat percentage | -0.013 (0.874) | -0.024 (0.764) | 0.061 (0.431) | 0.193 (0.011) |
| Waist-to-hip ratio | 0.008 (0.928) | 0.054 (0.495) | 0.217 (0.004) | 0.280 (0.000) |
| Waist circumference | 0.007 (0.930) | -0.018 (0.820) | 0.156 (0.042) | 0.269 (0.000) |
| Hip circumference | -0.016 (0.848) | -0.027 (0.731) | 0.107 (0.162) | 0.238 (0.002) |
| SBP | 0.051 (0.538) | 0.006 (0.940) | 0.041 (0.596) | 0.109 (0.155) |
| DBP | -0.029 (0.729) | 0.034 (0.674) | -0.042 (0.581) | 0.058 (0.452) |
| FINS | -0.053 (0.523) | 0.030 (0.707) | 0.088 (0.250) | 0.132 (0.084) |
| HbA1c | -0.114 (0.168) | -0.037 (0.639) | 0.023 (0.765) | 0.110 (0.153) |
| FPG | 0.072 (0.387) | 0.012 (0.877) | -0.074 (0.336) | 0.032 (0.680) |
| ALT | -0.105 (0.204) | 0.041 (0.607) | 0.100 (0.191) | 0.142 (0.062) |
| AST | -0.099 (0.231) | 0.069 (0.384) | 0.115 (0.133) | 0.099 (0.194) |
| GGT | -0.095 (0.251) | 0.057 (0.473) | 0.088 (0.251) | 0.123 (0.107) |
| Scr | 0.075 (0.363) | 0.077 (0.335) | 0.219 (0.004) | 0.049 (0.521) |
| UA | -0.067 (0.420) | 0.035 (0.662) | 0.171 (0.025) | 0.139 (0.069) |
| TC | 0.026 (0.755) | -0.053 (0.508) | -0.015 (0.849) | -0.116 (0.130) |
| TAG | -0.112 (0.177) | -0.113 (0.154) | 0.002 (0.975) | -0.003 (0.973) |
| HDL-Ch | -0.014 (0.863) | 0.063 (0.425) | 0.014 (0.855) | -0.045 (0.556) |
| LDL-Ch | 0.042 (0.616) | -0.083 (0.293) | -0.005 (0.950) | -0.098 (0.202) |
Tab 3 Correlation between the performance of subjects in the Flanker task and their anthropometric data and laboratory testing indicators [r (P) value]
| Item | ACC | Reaction time | ||
|---|---|---|---|---|
| Incongruent stimulus | Congruent stimulus | Incongruent stimulus | Congruent stimulus | |
| BMI | -0.004 (0.958) | 0.033 (0.678) | 0.259 (0.000) | 0.337 (0.000) |
| Body fat mass | 0.004 (0.963) | 0.014 (0.857) | 0.154 (0.045) | 0.242 (0.000) |
| Body fat percentage | -0.013 (0.874) | -0.024 (0.764) | 0.061 (0.431) | 0.193 (0.011) |
| Waist-to-hip ratio | 0.008 (0.928) | 0.054 (0.495) | 0.217 (0.004) | 0.280 (0.000) |
| Waist circumference | 0.007 (0.930) | -0.018 (0.820) | 0.156 (0.042) | 0.269 (0.000) |
| Hip circumference | -0.016 (0.848) | -0.027 (0.731) | 0.107 (0.162) | 0.238 (0.002) |
| SBP | 0.051 (0.538) | 0.006 (0.940) | 0.041 (0.596) | 0.109 (0.155) |
| DBP | -0.029 (0.729) | 0.034 (0.674) | -0.042 (0.581) | 0.058 (0.452) |
| FINS | -0.053 (0.523) | 0.030 (0.707) | 0.088 (0.250) | 0.132 (0.084) |
| HbA1c | -0.114 (0.168) | -0.037 (0.639) | 0.023 (0.765) | 0.110 (0.153) |
| FPG | 0.072 (0.387) | 0.012 (0.877) | -0.074 (0.336) | 0.032 (0.680) |
| ALT | -0.105 (0.204) | 0.041 (0.607) | 0.100 (0.191) | 0.142 (0.062) |
| AST | -0.099 (0.231) | 0.069 (0.384) | 0.115 (0.133) | 0.099 (0.194) |
| GGT | -0.095 (0.251) | 0.057 (0.473) | 0.088 (0.251) | 0.123 (0.107) |
| Scr | 0.075 (0.363) | 0.077 (0.335) | 0.219 (0.004) | 0.049 (0.521) |
| UA | -0.067 (0.420) | 0.035 (0.662) | 0.171 (0.025) | 0.139 (0.069) |
| TC | 0.026 (0.755) | -0.053 (0.508) | -0.015 (0.849) | -0.116 (0.130) |
| TAG | -0.112 (0.177) | -0.113 (0.154) | 0.002 (0.975) | -0.003 (0.973) |
| HDL-Ch | -0.014 (0.863) | 0.063 (0.425) | 0.014 (0.855) | -0.045 (0.556) |
| LDL-Ch | 0.042 (0.616) | -0.083 (0.293) | -0.005 (0.950) | -0.098 (0.202) |
| Item | ACC | Reaction time | ||||
|---|---|---|---|---|---|---|
| 0-back | 1-back | 2-back | 0-back | 1-back | 2-back | |
| BMI | 0.032 (0.701) | 0.078 (0.344) | 0.087 (0.299) | 0.151 (0.069) | 0.268 (0.000) | 0.351 (0.000) |
| Body fat mass | 0.027 (0.745) | 0.057 (0.489) | 0.061 (0.465) | 0.124 (0.135) | 0.217 (0.004) | 0.282 (0.000) |
| Body fat percentage | 0.030 (0.722) | 0.042 (0.615) | 0.062 (0.459) | 0.065 (0.438) | 0.173 (0.023) | 0.240 (0.000) |
| Waist-to-hip ratio | 0.002 (0.983) | -0.022 (0.794) | 0.077 (0.357) | 0.095 (0.253) | 0.257 (0.000) | 0.320 (0.000) |
| Waist circumference | -0.058 (0.491) | 0.001 (0.986) | 0.008 (0.921) | 0.122 (0.143) | 0.200 (0.008) | 0.248 (0.000) |
| Hip circumference | -0.040 (0.635) | 0.062 (0.454) | 0.044 (0.602) | 0.082 (0.328) | 0.208 (0.006) | 0.257 (0.000) |
| SBP | -0.051 (0.544) | 0.012 (0.887) | 0.101 (0.227) | -0.004 (0.961) | 0.107 (0.164) | 0.101 (0.186) |
| DBP | -0.099 (0.238) | -0.079 (0.344) | -0.056 (0.500) | 0.059 (0.482) | 0.137 (0.074) | 0.059 (0.443) |
| FINS | -0.042 (0.612) | -0.085 (0.303) | -0.080 (0.339) | 0.013 (0.872) | 0.116 (0.128) | 0.138 (0.070) |
| HbA1c | -0.028 (0.738) | -0.149 (0.071) | -0.085 (0.308) | 0.001 (0.988) | 0.103 (0.177) | 0.055 (0.473) |
| FPG | -0.176 (0.035) | -0.114 (0.169) | -0.036 (0.666) | -0.139 (0.095) | -0.021 (0.790) | 0.025 (0.741) |
| ALT | -0.067 (0.420) | -0.046 (0.580) | -0.067 (0.425) | 0.046 (0.579) | 0.161 (0.035) | 0.207 (0.006) |
| AST | -0.008 (0.923) | -0.042 (0.614) | -0.060 (0.469) | 0.045 (0.591) | 0.156 (0.040) | 0.199 (0.009) |
| GGT | 0.061 (0.464) | -0.068 (0.413) | -0.148 (0.075) | 0.017 (0.835) | 0.161 (0.034) | 0.139 (0.068) |
| Scr | -0.050 (0.546) | -0.173 (0.035) | -0.021 (0.798) | 0.032 (0.700) | 0.085 (0.264) | 0.101 (0.188) |
| UA | 0.032 (0.698) | -0.093 (0.260) | -0.140 (0.093) | 0.158 (0.057) | 0.227 (0.003) | 0.310 (0.000) |
| TC | 0.182 (0.028) | -0.016 (0.850) | -0.059 (0.483) | -0.037 (0.656) | 0.029 (0.709) | -0.028 (0.719) |
| TAG | 0.051 (0.539) | -0.092 (0.267) | -0.223 (0.007) | 0.058 (0.488) | 0.027 (0.722) | 0.026 (0.732) |
| HDL-Ch | 0.075 (0.366) | 0.011 (0.893) | 0.098 (0.240) | 0.042 (0.619) | -0.024 (0.752) | -0.116 (0.127) |
| LDL-Ch | 0.158 (0.058) | -0.010 (0.907) | -0.076 (0.364) | -0.058 (0.484) | 0.068 (0.371) | 0.036 (0.638) |
Tab 4 Correlation between the performance of subjects in the n-back task and their anthropometric data and laboratory testing indicators [r (P) value]
| Item | ACC | Reaction time | ||||
|---|---|---|---|---|---|---|
| 0-back | 1-back | 2-back | 0-back | 1-back | 2-back | |
| BMI | 0.032 (0.701) | 0.078 (0.344) | 0.087 (0.299) | 0.151 (0.069) | 0.268 (0.000) | 0.351 (0.000) |
| Body fat mass | 0.027 (0.745) | 0.057 (0.489) | 0.061 (0.465) | 0.124 (0.135) | 0.217 (0.004) | 0.282 (0.000) |
| Body fat percentage | 0.030 (0.722) | 0.042 (0.615) | 0.062 (0.459) | 0.065 (0.438) | 0.173 (0.023) | 0.240 (0.000) |
| Waist-to-hip ratio | 0.002 (0.983) | -0.022 (0.794) | 0.077 (0.357) | 0.095 (0.253) | 0.257 (0.000) | 0.320 (0.000) |
| Waist circumference | -0.058 (0.491) | 0.001 (0.986) | 0.008 (0.921) | 0.122 (0.143) | 0.200 (0.008) | 0.248 (0.000) |
| Hip circumference | -0.040 (0.635) | 0.062 (0.454) | 0.044 (0.602) | 0.082 (0.328) | 0.208 (0.006) | 0.257 (0.000) |
| SBP | -0.051 (0.544) | 0.012 (0.887) | 0.101 (0.227) | -0.004 (0.961) | 0.107 (0.164) | 0.101 (0.186) |
| DBP | -0.099 (0.238) | -0.079 (0.344) | -0.056 (0.500) | 0.059 (0.482) | 0.137 (0.074) | 0.059 (0.443) |
| FINS | -0.042 (0.612) | -0.085 (0.303) | -0.080 (0.339) | 0.013 (0.872) | 0.116 (0.128) | 0.138 (0.070) |
| HbA1c | -0.028 (0.738) | -0.149 (0.071) | -0.085 (0.308) | 0.001 (0.988) | 0.103 (0.177) | 0.055 (0.473) |
| FPG | -0.176 (0.035) | -0.114 (0.169) | -0.036 (0.666) | -0.139 (0.095) | -0.021 (0.790) | 0.025 (0.741) |
| ALT | -0.067 (0.420) | -0.046 (0.580) | -0.067 (0.425) | 0.046 (0.579) | 0.161 (0.035) | 0.207 (0.006) |
| AST | -0.008 (0.923) | -0.042 (0.614) | -0.060 (0.469) | 0.045 (0.591) | 0.156 (0.040) | 0.199 (0.009) |
| GGT | 0.061 (0.464) | -0.068 (0.413) | -0.148 (0.075) | 0.017 (0.835) | 0.161 (0.034) | 0.139 (0.068) |
| Scr | -0.050 (0.546) | -0.173 (0.035) | -0.021 (0.798) | 0.032 (0.700) | 0.085 (0.264) | 0.101 (0.188) |
| UA | 0.032 (0.698) | -0.093 (0.260) | -0.140 (0.093) | 0.158 (0.057) | 0.227 (0.003) | 0.310 (0.000) |
| TC | 0.182 (0.028) | -0.016 (0.850) | -0.059 (0.483) | -0.037 (0.656) | 0.029 (0.709) | -0.028 (0.719) |
| TAG | 0.051 (0.539) | -0.092 (0.267) | -0.223 (0.007) | 0.058 (0.488) | 0.027 (0.722) | 0.026 (0.732) |
| HDL-Ch | 0.075 (0.366) | 0.011 (0.893) | 0.098 (0.240) | 0.042 (0.619) | -0.024 (0.752) | -0.116 (0.127) |
| LDL-Ch | 0.158 (0.058) | -0.010 (0.907) | -0.076 (0.364) | -0.058 (0.484) | 0.068 (0.371) | 0.036 (0.638) |
| Variable | β | STD | t value | P value |
|---|---|---|---|---|
| Flanker task | ||||
| Incongruent stimulus | ||||
| BMI | 11.064 | 0.511 | 4.053 | 0.000 |
| Hip circumference | -3.664 | -0.315 | -2.499 | 0.013 |
| Congruent stimulus | ||||
| BMI | 6.468 | 0.295 | 4.043 | 0.000 |
| n-back task | ||||
| 1-back | ||||
| BMI | 9.505 | 0.250 | 3.378 | 0.001 |
| 2-back | ||||
| BMI | 15.045 | 0.317 | 4.368 | 0.000 |
Tab 5 Multiple linear regression analysis of the influencing factors of reaction time of subjects
| Variable | β | STD | t value | P value |
|---|---|---|---|---|
| Flanker task | ||||
| Incongruent stimulus | ||||
| BMI | 11.064 | 0.511 | 4.053 | 0.000 |
| Hip circumference | -3.664 | -0.315 | -2.499 | 0.013 |
| Congruent stimulus | ||||
| BMI | 6.468 | 0.295 | 4.043 | 0.000 |
| n-back task | ||||
| 1-back | ||||
| BMI | 9.505 | 0.250 | 3.378 | 0.001 |
| 2-back | ||||
| BMI | 15.045 | 0.317 | 4.368 | 0.000 |
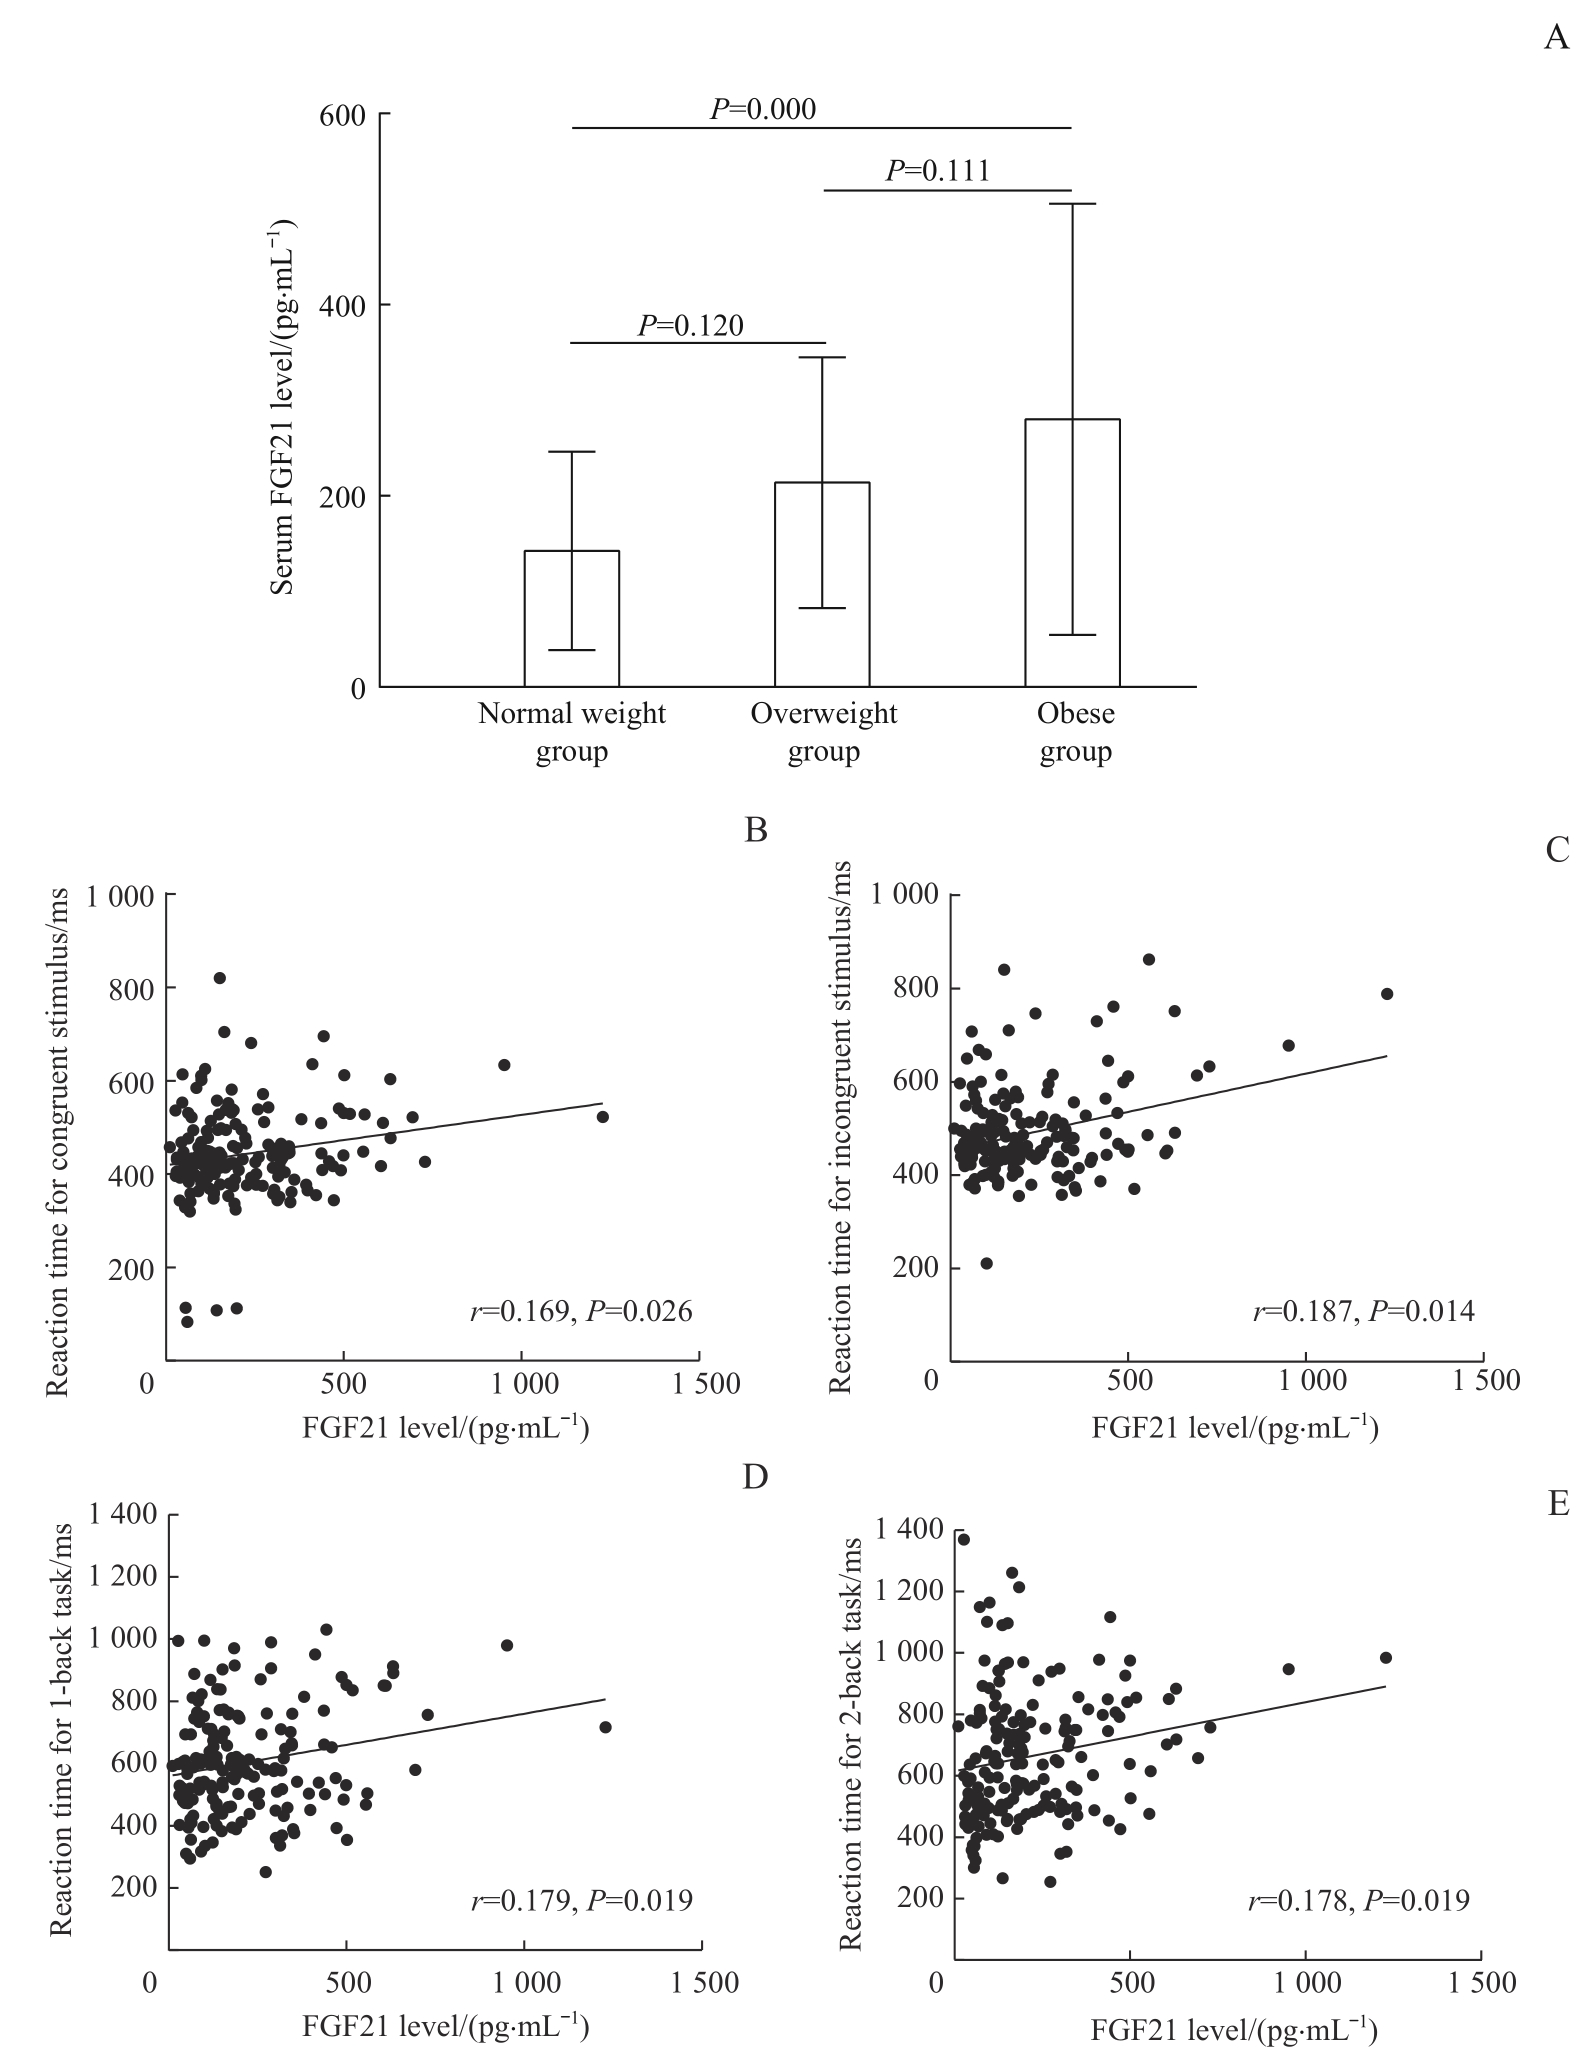
Fig 2 Comparison of serum FGF21 levels among the three groups of subjects and its correlation analysis with reaction time under different conditions
| Variable | β | STD | t value | P value | adjusted R² |
|---|---|---|---|---|---|
| 2-back ACC | -2.090 | -0.334 | -3.687 | 0.000 | 0.110 |
| Reaction time for incongruent stimulus | 0.002 | 0.182 | 2.004 | 0.048 |
Tab 6 Multiple linear regression analysis of cognitive function-related indicators and serum FGF21 levels in subjects
| Variable | β | STD | t value | P value | adjusted R² |
|---|---|---|---|---|---|
| 2-back ACC | -2.090 | -0.334 | -3.687 | 0.000 | 0.110 |
| Reaction time for incongruent stimulus | 0.002 | 0.182 | 2.004 | 0.048 |
| 1 | PAN X F, WANG L M, PAN A. Epidemiology and determinants of obesity in China[J]. Lancet Diabetes Endocrinol, 2021, 9(6): 373-392. |
| 2 | DE MUTSERT R, SUN Q, WILLETT W C, et al. Overweight in early adulthood, adult weight change, and risk of type 2 diabetes, cardiovascular diseases, and certain cancers in men: a cohort study[J]. Am J Epidemiol, 2014, 179(11): 1353-1365. |
| 3 | GUNSTAD J, PAUL R H, COHEN R A, et al. Elevated body mass index is associated with executive dysfunction in otherwise healthy adults[J]. Compr Psychiatry, 2007, 48(1): 57-61. |
| 4 | BOZKURT H, ÖZER S, YıLMAZ R, et al. Assessment of neurocognitive functions in children and adolescents with obesity[J]. Appl Neuropsychol Child, 2017, 6(4): 262-268. |
| 5 | PAN L Y, LI X X, FENG Y, et al. Psychological assessment of children and adolescents with obesity[J]. J Int Med Res, 2018, 46(1): 89-97. |
| 6 | HODEL A S, BRUMBAUGH J E, HUNT R H, et al. Individual differences in ERP measures of executive function in early childhood: relation to low-risk preterm birth and parent-reported behavior[J]. Child Neuropsychol, 2019, 25(7): 914-942. |
| 7 | PIRES L, LEITÃO J, GUERRINI C, et al. Event-related brain potentials in the study of inhibition: cognitive control, source localization and age-related modulations[J]. Neuropsychol Rev, 2014, 24(4): 461-490. |
| 8 | ETNIER J L, CHANG Y K. The effect of physical activity on executive function: a brief commentary on definitions, measurement issues, and the current state of the literature[J]. J Sport Exerc Psychol, 2009, 31(4): 469-483. |
| 9 | RÉVEILLON M, LAZEYRAS F, VAN CALSTER L, et al. Neural functional correlates of the impact of socio-emotional stimuli on performances on a flanker task in children aged 9-11 years[J]. Neuropsychologia, 2020, 145: 106747. |
| 10 | YAPLE Z, ARSALIDOU M. N-back working memory task: meta-analysis of normative fMRI studies with children[J]. Child Dev, 2018, 89(6): 2010-2022. |
| 11 | PELEGRINA S, LECHUGA M T, GARCÍA-MADRUGA J A, et al. Normative data on the n-back task for children and young adolescents[J]. Front Psychol, 2015, 6: 1544. |
| 12 | MÄKELÄ J, TSELYKH T V, MAIORANA F, et al. Fibroblast growth factor-21 enhances mitochondrial functions and increases the activity of PGC-1α in human dopaminergic neurons via Sirtuin-1[J]. SpringerPlus, 2014, 3: 2. |
| 13 | KIM K H, LEE M S. FGF21 as a stress hormone: the roles of FGF21 in stress adaptation and the treatment of metabolic diseases[J]. Diabetes Metab J, 2014, 38(4): 245-251. |
| 14 | KANG K, XU P F, WANG M X, et al. FGF21 attenuates neurodegeneration through modulating neuroinflammation and oxidant-stress[J]. Biomed Pharmacother, 2020, 129: 110439. |
| 15 | 中华人民共和国国家卫生健康委员会. 学龄儿童青少年超重与肥胖筛查[EB/OL]. (2018-02-23) [2023-05-31]. http://www.nhc.gov.cn/wjw/pqt/201803/a7962d1ac01647b9837110bfd2d69b26.shtml. |
| National Health Commission of People's Republic of China. Overweight and obesity screening in school-age children and adolescents[EB/OL]. (2018-02-23) [2023-05-31]. http://www.nhc.gov.cn/wjw/pqt/201803/a7962d1ac01647b9837110bfd2d69b26.shtml. | |
| 16 | LI H T, DONG K, FANG Q C, et al. High serum level of fibroblast growth factor 21 is an independent predictor of non-alcoholic fatty liver disease: a 3-year prospective study in China[J]. J Hepatol, 2013, 58(3): 557-563. |
| 17 | KAMIJO K, PONTIFEX M B, KHAN N A, et al. The negative association of childhood obesity to cognitive control of action monitoring[J]. Cereb Cortex, 2014, 24(3): 654-662. |
| 18 | REDDY S D, SYSKO R, MACKEY E R. Mental health, loss of control eating, and cognitive functioning in adolescents undergoing bariatric surgery[J]. Semin Pediatr Surg, 2020, 29(1): 150892. |
| 19 | CHAN J S Y, YAN J H, PAYNE V G. The impact of obesity and exercise on cognitive aging[J]. Front Aging Neurosci, 2013, 5: 97. |
| 20 | NIEOULLON A, COQUEREL A. Dopamine: a key regulator to adapt action, emotion, motivation and cognition[J]. Curr Opin Neurol, 2003, 16(Suppl 2): S3-S9. |
| 21 | SOLAS M, MILAGRO F I, RAMÍREZ M J, et al. Inflammation and gut-brain axis link obesity to cognitive dysfunction: plausible pharmacological interventions[J]. Curr Opin Pharmacol, 2017, 37: 87-92. |
| 22 | MINA T, YEW Y W, NG H K, et al. Adiposity impacts cognitive function in Asian populations: an epidemiological and Mendelian Randomization study[J]. Lancet Reg Health West Pac, 2023, 33: 100710. |
| 23 | JEON B T, JEONG E A, SHIN H J, et al. Resveratrol attenuates obesity-associated peripheral and central inflammation and improves memory deficit in mice fed a high-fat diet[J]. Diabetes, 2012, 61(6): 1444-1454. |
| 24 | DAVIDSON T L, MONNOT A, NEAL A U, et al. The effects of a high-energy diet on hippocampal-dependent discrimination performance and blood-brain barrier integrity differ for diet-induced obese and diet-resistant rats[J]. Physiol Behav, 2012, 107(1): 26-33. |
| 25 | BOCARSLY M E, FASOLINO M, KANE G A, et al. Obesity diminishes synaptic markers, alters microglial morphology, and impairs cognitive function[J]. Proc Natl Acad Sci U S A, 2015, 112(51): 15731-15736. |
| 26 | XIAO F, SHI X, HUANG P, et al. Dose-response relationship between serum fibroblast growth factor 21 and liver fat content in non-alcoholic fatty liver disease[J]. Diabetes Metab, 2021, 47(6): 101221. |
| 27 | FISHER F M, CHUI P C, ANTONELLIS P J, et al. Obesity is a fibroblast growth factor 21 (FGF21)-resistant state[J]. Diabetes, 2010, 59(11): 2781-2789. |
| 28 | YE L X, WANG X, CAI C C, et al. FGF21 promotes functional recovery after hypoxic-ischemic brain injury in neonatal rats by activating the PI3K/Akt signaling pathway via FGFR1/β-klotho[J]. Exp Neurol, 2019, 317: 34-50. |
| [1] | Jin Feng, Peng Daihui. Research progress on cognitive function and neural mechanisms of non-suicidal self-injury in adolescents [J]. Journal of Shanghai Jiao Tong University (Medical Science), 2026, 46(2): 220-226. |
| [2] | WANG Haihong, YUAN Chenxin, GAN Hong, JIANG Haifeng, ZHAO Yan, DU Jiang, ZHANG Yi. A randomized controlled study on the effect of intermittent theta burst stimulation on craving, mood, and cognitive function in alcohol-dependent patients during the withdrawal period [J]. Journal of Shanghai Jiao Tong University (Medical Science), 2025, 45(3): 349-356. |
| [3] | Ruping LU, Hui GAO, Linna JIANG, Xiaoya CHEN, Hong PENG, Hui SHEN, Qing FAN. Effect of psychomotor therapy on negative symptoms and cognitive function of patients with stable schizophrenia [J]. JOURNAL OF SHANGHAI JIAOTONG UNIVERSITY (MEDICAL SCIENCE), 2022, 42(1): 77-81. |
| [4] | Yi WANG, Cheng CHENG, Hong-yan SHEN, Hong-yan GAO, Yue-ning DAI, Zheng-hui YI. Meta-analysis of efficacy of transcranial magnetic stimulation for the treatment of cognitive function and behavioral and psychological symptoms of dementia in patients with Alzheimer′s disease [J]. JOURNAL OF SHANGHAI JIAOTONG UNIVERSITY (MEDICAL SCIENCE), 2021, 41(7): 931-941. |
| [5] | Guo-qin HU, Cheng-qing YANG, Qin-yu LÜ, Jing ZHAO, Ming-huan ZHU, Zheng-hui YI, Xin-hai DAI. Effects of computerized cognitive correction therapy on cognitive function of schizophrenia [J]. JOURNAL OF SHANGHAI JIAOTONG UNIVERSITY (MEDICAL SCIENCE), 2021, 41(5): 622-627. |
| [6] | Wen-jun HUANG, Su-su JIANG, Min-fang TAO. Correlation between sleep quality and everyday cognitive function in perimenopausal and postmenopausal women [J]. JOURNAL OF SHANGHAI JIAOTONG UNIVERSITY (MEDICAL SCIENCE), 2021, 41(4): 497-501. |
| [7] | ZHOU Shao-yu1, FENG Zhen-xiao1, YAO Xiao-ping2, WANG Wan1, ZHAO Jing3#, YI Zheng-hui4#. Effects of typical or atypical antipsychotics on cognitive symptoms of the patients with schizophrenia [J]. JOURNAL OF SHANGHAI JIAOTONG UNIVERSITY (MEDICAL SCIENCE), 2020, 40(8): 1075-1080. |
| [8] | HONG Bo*, HE Hai-ning*, LIU Yuan-yuan, SU Ning, YAN Feng, SHI Yan-chen, WANG Jing-hua, WANG Tao, XIAO Shi-fu. One year follow-up study of sleep duration and cognitive function changes in the elderly with normal cognitive function [J]. , 2019, 39(9): 1017-. |
| [9] | WANG Dan-dan, ZHANG Chen. Research progress of neuroimmune mechanisms of cognitive function in schizophrenia and effect of atypical antipsychotic drugs on it [J]. , 2019, 39(7): 795-. |
| [10] | ZHU Li-na1, ZHANG Qiong2, CAI Jun1, ZHANG Wei-bo1, ZHU Hong-xia1. Effect of cerebellar vermal repetitive transcranial magnetic stimulation with theta burst stimulation paradigm on cognitive functions of patients with schizophrenia [J]. , 2019, 39(3): 282-. |
| [11] | Lü Wang-qiang, TANG Wei, CAI Jun, LU Wei-hong, YU Yue-guo, FAN Wei-xing, ZHANG Chen. Study on the effects of ANK3 gene on the development of cognitive impairment in patients with schizophrenia [J]. , 2016, 36(9): 1297-. |
| [12] | ZHOU Ze-wen, PANG Ya-qin, QI Guang-zi, et al. Effects of occupational aluminum exposure on psychology, neural behaviors, cognitive function, and autonomic nervous function of workers [J]. , 2015, 35(2): 242-. |
| [13] | CAO Ai-ai, ZHANG Jie, HUANG Jia, ZHU Na, ZHANG Tian-hong, GAO Rong-xin, ZHANG Li, QIU Mei-hui, PENG Dai-hui, XU Yi-feng. Correlation between cognitive function and symptom changes of patients with schizophrenia [J]. , 2015, 35(10): 1516-. |
| [14] | SONG Tai-xia, MA Chao-qun, FU Guang-jian, et al. Effects of smoking on cognitive impairment of elderly people [J]. , 2014, 34(8): 1225-. |
| [15] | XU Wei-qian, QI Gang-qiao, CHEN Xing-yang, et al. Effects of combination of modified electroconvulsive therapy on cognitive function of first-episode schizophrenia of different ages [J]. , 2014, 34(5): 655-. |
| Viewed | ||||||
|
Full text |
|
|||||
|
Abstract |
|
|||||