上海交通大学学报(医学版), 2023, 43(10): 1274-1281 doi: 10.3969/j.issn.1674-8115.2023.10.008

论著 · 临床研究

成人胸部CT胸骨皮质比例对骨量低下及骨质疏松诊断效能的探究

禹茜,1, 孙俊楠1, 张姣姣2, 高月1, 王虎3, 于洋1, 王海嵘,1, 洪雯,4

1.上海交通大学医学院附属新华医院急诊医学科,上海 200092

2.上海交通大学医学院附属仁济医院急诊医学科,上海 200125

3.上海交通大学医学院附属胸科医院急诊科,上海 200030

4.上海交通大学医学院附属第六人民医院心内科,上海 200233

Efficacy of sternal cortical thickness ratio in adult chest CT in the diagnosis of osteopenia and osteoporosis

YU Xi,1, SUN Junnan1, ZHANG Jiaojiao2, GAO Yue1, WANG Hu3, YU Yang1, WANG Hairong,1, HONG Wen,4

1.Department of Emergency Medicine, Xinhua Hospital, Shanghai Jiao Tong University School of Medicine, Shanghai 200092, China

2.Department of Emergency Medicine, Renji Hospital, Shanghai Jiao Tong University School of Medicine, Shanghai 200125, China

3.Emergency Department, Chest Hospital, Shanghai Jiao Tong University School of Medicine, Shanghai 200030, China

4.Department of Cardiology, Shanghai Sixth People's Hospital, Shanghai Jiao Tong University School of Medicine, Shanghai 200233, China

通讯作者: 王海嵘,电子信箱:wanghairong@xinhuamed.com.cn洪 雯,电子信箱:18930172044@189.com

编委: 崔黎明

收稿日期: 2023-03-05   接受日期: 2023-09-15   网络出版日期: 2023-10-28

Corresponding authors: WANG Hairong, E-mail:wanghairong@xinhuamed.com.cnHONG Wen, E-mail:18930172044@189.com.

Received: 2023-03-05   Accepted: 2023-09-15   Online: 2023-10-28

作者简介 About authors

禹茜(1992—),女,硕士;电子信箱:yuxi199263@163.com。 E-mail:yuxi199263@163.com

摘要

目的·比较成人急诊住院患者胸部CT平扫影像中胸骨皮质比例与骨密度之间的关系,评估胸骨皮质比例对骨量低下及骨质疏松的诊断效能。方法·对2020年11月—2022年10月收治于上海交通大学医学院附属新华医院成人急诊病房的住院患者通过双能X射线吸收法(dual energy X-ray absorptiometry,DXA)测定其骨密度。根据骨密度将患者诊断为骨量正常、骨量低下及骨质疏松。对患者根据年龄(>65岁、≤65岁)及骨质疏松情况进行分组。分析各组患者胸部CT平扫影像中气管分叉处平面测量的胸骨皮质比例。用Spearman相关系数分析胸骨皮质比例与骨密度的相关性。采取胸骨皮质比例对骨量低下及骨质疏松进行诊断,绘制受试者操作特征曲线(receiver operator characteristic curve,ROC曲线)并获得最佳截断值,分析胸骨皮质比例在诊断骨量低下及骨质疏松中的诊断效能。结果·研究共纳入198例患者,其中,骨量正常者78例、骨量低下者66例、骨质疏松者54例。在>65岁的患者(n=115)中,骨质疏松组女性占比、患者年龄高于骨量正常组,差异有统计学意义(均P<0.05);而在≤65岁的患者(n=83)中,该差异均无统计学意义(P>0.05)。不论在>65岁患者,还是在≤65岁的患者中,骨量正常组胸骨皮质比例均高于骨量低下组及骨质疏松组,骨量低下组胸骨皮质比例均高于骨质疏松组(均P<0.05);骨量正常组、骨量低下组及骨质疏松组的女性患者胸骨皮质比例均低于男性患者(均P<0.05),男性和女性患者的胸骨皮质比例均与骨密度呈正相关(r=0.704,P=0.000;r=0.785,P=0.000;r=0.735,P=0.000;r=0.479,P=0.000)。在诊断效能方面,在>65岁的患者中,胸骨皮质比例对骨量正常组男性患者的诊断准确率较骨量低下组及骨质疏松组高,对骨质疏松组患者的诊断误诊率较骨量正常组及骨量低下组低;在≤65岁的患者中,胸骨皮质比例对骨质疏松组男性患者的诊断准确率较骨量正常组及骨量低下组高,对骨量正常组患者的诊断误诊率较骨量低下组及骨质疏松组低。结论·男性和女性患者的胸骨皮质比例均与骨密度呈正相关,胸骨皮质比例对骨量低下及骨质疏松有较好的诊断效能。

关键词: 骨质疏松 ; 骨密度 ; 胸骨 ; 骨皮质 ; 诊断价值。

Abstract

Objective ·To compare the relationship between sternal cortical thickness ratio and bone mineral density in adult emergency inpatients with chest CT plain scan, and evaluate the diagnostic ability of sternal cortical thickness ratio for osteopenia and osteoporosis. Methods ·The bone density was measured by dual energy X-ray absorptiometry (DXA) in hospitalized patients collected in the adult emergency ward of Xinhua Hospital, Shanghai Jiao Tong University School of Medicine from November 2020 to October 2022, and the patients were diagnosed as normal bone mass, osteopenia, or osteoporosis according to the bone density. The patients were grouped based on age (>65 years old, ≤65 years old) and osteoporosis status. The sternal cortical thickness ratio measured at the level of tracheal bifurcation in the chest CT scan image of each group was analyzed. Spearman correlation was used to analyze the correlation between the sternal cortical thickness ratio and bone mineral density. The sternal cortical thickness ratio was used to diagnose the osteopenia and the osteoporosis, and the receiver operator characteristic curve (ROC curve) was drawn to obtain the best cut-off value. The diagnostic efficacy of the sternal cortical thickness ratio in the diagnosis of osteopenia and osteoporosis was analyzed. Results ·A total of 198 patients were included in the study, including 78 patients with normal bone mass, 66 patients with osteopenia, and 54 patients with osteoporosis. Among patients aged >65 years old (n=115), the proportion of female patients and the age of patients in the osteoporosis group were significantly higher than those in the normal bone mass group (all P<0.05). However, in patients ≤65 years old (n=83), the difference was not statistically significant (P>0.05). Whether in patients >65 years old or ≤65 years old, the sternal cortical thickness ratio in the normal bone mass group was higher than that in the osteopenia group and the osteoporosis group, and the sternal cortical thickness ratio in the osteopenia group was higher than that in the osteoporosis group (all P<0.05); The sternal cortical thickness ratio in female patients in the normal bone mass group, osteopenia group and osteoporosis group was lower than that in male patients (all P<0.05). The sternal cortical thickness ratio in both male and female patients was positively correlated with bone mineral density (r=0.704, P=0.000; r=0.785, P=0.000; r=0.735, P=0.000; r=0.479, P=0.000). In terms of diagnostic performance, in patients >65 years old, the diagnostic accuracy rate of male patients in the normal bone mass group was higher than that in the osteopenia group and the osteoporosis group, and the diagnosis misdiagnosis rate in the osteoporosis group was lower than that in the normal bone mass group and the osteopenia group; In patients ≤65 years old, the diagnostic accuracy rate of male patients in the osteoporosis group was higher than that in the normal bone mass group and the osteopenia group, and the diagnosis misdiagnosis rate in the normal bone mass group was lower than that in the osteopenia group and the osteoporosis group. Conclusion ·The sternal cortical thickness ratio in both male and female patients is positively correlated with bone mineral density, and the sternal cortical thickness ratio has good diagnostic efficacy for osteopenia and osteoporosis.

Keywords: osteoporosis ; bone mineral density ; sternum ; cortical bone ; diagnostic value

PDF (2329KB) 元数据 多维度评价 相关文章 导出 EndNote| Ris| Bibtex  收藏本文

本文引用格式

禹茜, 孙俊楠, 张姣姣, 高月, 王虎, 于洋, 王海嵘, 洪雯. 成人胸部CT胸骨皮质比例对骨量低下及骨质疏松诊断效能的探究. 上海交通大学学报(医学版)[J], 2023, 43(10): 1274-1281 doi:10.3969/j.issn.1674-8115.2023.10.008

YU Xi, SUN Junnan, ZHANG Jiaojiao, GAO Yue, WANG Hu, YU Yang, WANG Hairong, HONG Wen. Efficacy of sternal cortical thickness ratio in adult chest CT in the diagnosis of osteopenia and osteoporosis. Journal of Shanghai Jiao Tong University (Medical Science)[J], 2023, 43(10): 1274-1281 doi:10.3969/j.issn.1674-8115.2023.10.008

骨质疏松是一种以骨量减低、骨组织微结构损伤作为主要特点的全身性骨病,最终可造成骨量丢失、脆性骨折等1-2。在我国人口老龄化日益严重,骨量低下/骨质疏松的患病率较高,其中50岁以上女性骨质疏松的患病率为20.7%、男性为14.4%,且骨量低下者已超过2亿人3-4。骨质疏松性骨折已成为严重影响健康的慢性疾病之一5。只有少数因骨质疏松导致脆性骨折的患者被诊断,并进行有效的抗骨质疏松药物治疗6。近年来,骨质疏松的发病年龄逐渐年轻化,其起病隐匿且患者重视程度不够,一旦发展到中晚期,严重影响患者的生存质量。因此,早期快速诊断骨质疏松是对其进行预防及治疗的关键。

骨密度是指单位体积或单位面积内所含骨量的多少。目前检验骨密度是诊断骨质疏松的重要手段7。双能X射线吸收法(dual energy X-ray absorptiometry,DXA)和定量CT(quantitative computed tomography,QCT)检查是国际上普遍公认的2种骨密度检测方法,其中DXA是国际学术界常用的骨质疏松诊断方法8-9。但DXA检查方法烦琐、费用相对较高,在临床上未能普及。有调查10发现,超过80%的患有严重骨质疏松相关骨折的患者,没有进行骨密度检测或接受药物治疗,因而骨折概率相对较高。因此,临床上需要一种安全且具有成本效益的替代方案对骨量低下及骨质疏松进行早期识别及诊断。

胸部CT费用较低,应用广泛,是常规体检中的必要项目,也是急诊住院患者乃至各专科住院患者常见的检查项目。我们在临床工作中发现,在骨质疏松患者的胸部CT影像中,胸骨的骨皮质厚度较非骨质疏松患者明显变薄,提示胸骨柄处的骨皮质厚度可能对于骨质疏松的诊断有一定价值。基于此,本研究主要利用常见的胸部CT检测胸骨皮质比例,研究这一简便、易操作的方法与DXA检测获得的骨密度的相关性,评估胸骨皮质比例对骨量低下及骨质疏松的诊断效能,以探讨其用于骨质疏松患者诊断的可行性。

1 对象与方法

1.1 研究对象、资料收集及分组

收集2020年11月—2022年10月在上海交通大学医学院附属新华医院急诊病房住院的患者作为研究对象。纳入标准:①年龄≥18岁。②行胸部CT及DXA检查。排除标准:①3年内服用过影响骨代谢的药物,如激素、肝素等。②存在影响钙磷代谢、骨代谢的疾病及骨肿瘤等病史或因营养不良而使局部骨密度降低或增高。③3年内进行过椎体手术、髋关节置换术等影响骨密度测量准确性。④存在精神、认知等障碍,不能耐受较长时间检查。⑤与医师无法有效沟通。⑥图像质量差无法准确测定胸骨皮质比例。收集患者的年龄、性别等临床资料。对患者根据年龄(>65岁、≤65岁)及骨质疏松情况进行分组。

1.2 利用DXA进行骨密度检测

嘱患者取平卧位,采用Discovery-W型双能X线骨密度仪(Hologic,美国)对患者的2~4节段腰椎进行扫描。参照世界卫生组织(WHO)推荐的诊断标准11,根据DXA测定获得的骨密度判断骨质疏松程度。骨密度通常用T值表示:T值=(实测骨密度值-同种族同性别正常青年人峰值骨密度)/同种族同性别正常青年人峰值骨密度的标准差;T≤-2.5为骨质疏松,-2.5<T<-1.0为骨量低下,T≥-1.0为骨量正常。

1.3 胸部CT检测

嘱患者取平卧位,使用CT扫描仪(GE,美国)自胸廓入口至膈肌进行扫描。在医学影像信息系统工作站处理软件中调整窗宽和窗位值,在气管分叉平面将胸骨皮质结构凸显出来。

1.4 胸骨皮质比例的测定

根据TINGART等12及BLOOM13的平均骨皮质厚度的测定方法,将成人胸骨作为测量模板,将气管进入胸腔后首次分叉的左、右主支气管作为测量平面。按照横断位胸骨平面大小确定水平层面图像。将该图像放大,由2位医师在不同时间对同一测量平面进行测量。使用测距功能,于垂直平面测量外缘、内缘的胸骨长径及短径厚度(图1)。外缘径总厚度减去内缘径总厚度即为皮质厚度,皮质厚度与外缘径总厚度的比值即为胸骨皮质比例。

图1

图1   胸骨测量平面中皮质厚度的测量

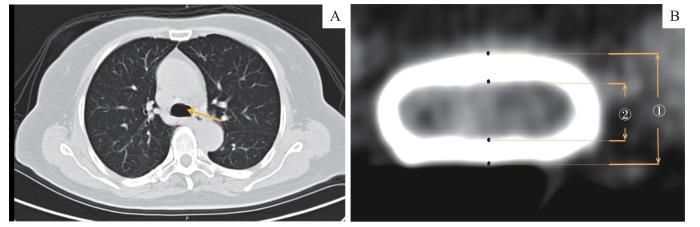
Note: A. The measurement plane at the tracheal bifurcation. The arrow points to the tracheal bifurcation. B. The calculation of the sternal cortical thickness ratio in the measurement plane. ① represents the thickness of the outer edge of the sternal cortex; ② represents the thickness of the inner edge of the sternal cortex; (①‒②)/① is the sternal cortical thickness ratio.

Fig 1   Measurement of cortical thickness in the sternum measurement plane


1.5 统计学方法

采用SPSS 22.0软件进行统计分析。定量资料用x±s表示,2组间数据比较采用独立样本t检验,多组间数据比较采用单因素方差分析。定性资料用n(%)表示,组间比较采用χ2 检验。采用Spearman相关分析胸骨皮质比例与骨密度的相关性;采用受试者操作特征曲线(receiver operator characteristic curve,ROC曲线)计算最佳截断值,并比较曲线下面积(area under the curve,AUC)、特异度、敏感度、误诊率及漏诊率,判断其对骨质疏松的诊断效能。所有检验均为双侧检验,P<0.05表示差异有统计学意义。

2 结果

2.1 病例的一般情况

本研究共纳入198例患者,>65岁的患者115例,≤65岁的患者83例。根据DXA的诊断结果,骨量正常者78例、骨量低下者66例、骨质疏松者54例。

在>65岁患者中,骨量正常组、骨量低下组及骨质疏松组男性及女性人数分布存在差异,有统计学意义(P=0.041);与骨量正常组相比,骨质疏松组女性患者比例更高,差异有统计学意义(P=0.012);骨质疏松组患者的平均年龄高于骨量低下组及骨量正常组,差异均有统计学意义(均P<0.05)。而在≤65岁的患者中,骨量正常组、骨量低下组及骨质疏松组男性及女性人数分布及年龄差异无统计学意义(均P>0.05)。结果见表1表2

表1   骨量正常组、骨量低下组及骨质疏松组患者的性别分布 [n(%)]

Tab 1  Gender distribution of patients with normal bone mass, osteopenia and osteoporosis [n(%)]

Gender>65 years≤65 years
Normal bone mass group (n=33)Osteopenia group (n=41)Osteoporosis group (n=41)

χ2

value

P valueNormal bone mass group (n=45)Osteopenia group (n=25)Osteoporosis group (n=13)

χ2

value

P value
Male21 (63.6)20 (48.8)14 (34.1)6.3960.04124 (53.3)9 (36.0)7 (53.8)2.1310.345
Female12 (36.4)21 (51.2)27 (65.9)21 (46.7)16 (64.0)6 (46.2)

Note:P=0.012, compared with the normal bone mass group.

新窗口打开| 下载CSV


表2   骨量正常组、骨量低下组及骨质疏松组患者的年龄比较 (x±s

Tab 2  Comparison of ages of patients with normal bone mass, osteopenia and osteoporosis (x±s

Gender>65 years≤65 years
Normal bone mass group (n=33)Osteopenia group (n=41)Osteoporosis group (n=41)

F

value

P

value

Normal bone mass group (n=45)Osteopenia group (n=25)Osteoporosis group (n=13)F value

P

value

Male75.14±7.5075.40±9.3882.57±8.06①②3.9800.02555.38±9.7454.11±10.4662.29±2.141.8860.166
Female71.58±4.5673.38±5.1980.00±6.90③④11.5220.00056.29±8.3456.69±8.2458.33±9.870.0800.924

Note:P=0.013, P=0.000, compared with the normal bone mass group; P=0.017, P=0.000, compared with the osteopenia group.

新窗口打开| 下载CSV


2.2 骨量正常组、骨量低下组及骨质疏松组胸骨皮质比例比较

骨量正常组、骨量低下组及骨质疏松组患者胸部CT影像中胸骨皮质差异明显(图2)。不论在>65岁的患者中还是在≤65岁的患者中,骨量正常组胸骨皮质比例均高于骨量低下组及骨质疏松组,骨量低下组胸骨皮质比例均高于骨质疏松组,差异有统计学意义(均P<0.05)。在骨量正常组、骨量低下组及骨质疏松组中,2个年龄段的女性患者的胸骨皮质比例均低于男性患者,差异有统计学意义(均P<0.05)。结果见表3

图2

图2   骨量正常(A)、骨量低下(B)和骨质疏松(C)患者胸部CT中胸骨的典型影像学表现

Fig 2   Typical chest CT imaging findings of sternum in patients with normal bone mass (A), osteopenia (B) and osteoporosis (C)


表3   骨量正常组、骨量低下组及骨质疏松组患者胸骨皮质比例比较 (x±s

Tab 3  Comparison of the sternal cortical thickness ratio in patients with normal bone mass, osteopenia and osteoporosis (x±s

Item>65 years≤65 years
Normal bone mass group (n=33)Osteopenia group (n=41)Osteoporosis group (n=41)

F

value

P

value

Normal bone mass group (n=45)Osteopenia group (n=25)Osteoporosis group (n=13)

F

value

P value
Male0.549±0.1060.398±0.0230.307±0.074①③45.0350.0000.420±0.1070.391±0.0170.298±0.023①③21.6130.000
Female0.464±0.1190.319±0.0460.214±0.058①④52.7340.0000.396±0.0630.348±0.0380.280±0.016①⑤15.9150.000
F value4.51847.69419.72921.98710.42151.454
P value0.0420.0000.0000.0000.0000.000

Note:P=0.000, P=0.010, compared with the normal bone mass group; P=0.000, P=0.001, P=0.035, compared with the osteopenia group.

新窗口打开| 下载CSV


2.3 胸骨皮质比例与骨密度的相关性

对不同年龄及性别患者的胸骨皮质比例与骨密度进行Spearman相关分析。结果显示:不论在>65岁的患者中还是在≤65岁的患者中,男性和女性患者的胸骨皮质比例均与骨密度呈正相关(>65岁男性,r=0.704;>65岁女性,r=0.785;≤65岁男性,r=0.735;≤65岁女性,r=0.479;均P=0.000)。结果见表4

表4   不同年龄组男性及女性患者胸骨皮质比例与骨密度的相关性分析

Tab 4  Correlation analysis of sternal cortical thickness ratio and bone mineral density in male and female patients of different age groups

Gender>65 years≤65 years
r valueSpearman correlation coefficientF valueT valueP valuer valueSpearman correlation coefficientF valueT valueP value
Male0.7040.73252.0062.9660.0000.7350.74544.5502.9440.000
Female0.7850.81993.2139.3100.0000.4790.73211.3373.8570.000

新窗口打开| 下载CSV


2.4 胸骨皮质比例对骨量低下及骨质疏松的诊断情况

利用胸骨皮质比例诊断骨量低下及骨质疏松,绘制ROC曲线,获得胸骨皮质比例的诊断截断值。年龄>65岁的男性患者中,胸骨皮质比例<0.34为骨质疏松(11例),>0.44为骨量正常(21例),0.34~0.44为骨量低下(23例);在年龄≤65岁的男性患者中,胸骨皮质比例<0.32为骨质疏松(9例),>0.42为骨量正常(19例),0.32~0.42为骨量低下(12例)。在年龄>65岁的女性患者中,<0.28为骨质疏松(24例),>0.39为骨量正常(13例),0.28~0.39为骨量低下(23例);在年龄≤65岁的女性患者中,<0.28为骨质疏松(7例),>0.39为骨量正常(17例),0.28~0.39为骨量低下(19例)。

与DXA诊断结果相比,胸骨皮质比例诊断>65岁男性骨量低下患者的AUC[0.924(95%CI 0.824~0.977)]、敏感度(90.5%)及特异度(95.0%)总体较优,诊断>65岁女性骨质疏松患者的AUC[0.930(95%CI 0.852~0.987)]较高;胸骨皮质比例诊断≤65岁男性骨量低下患者的AUC、敏感度(75.0%)及特异度(72.4%)总体较差,诊断≤65岁女性骨质疏松患者的AUC较高,但敏感度(80.0%)及特异度(83.3%)均较低。可见胸骨皮质比例对>65岁患者骨量低下及骨质疏松的诊断效能较好。结果见表5

表5   利用胸骨皮质比例诊断骨量低下及骨质疏松的ROC曲线特性分析

Tab 5  Analysis of ROC curve characteristics of sternal cortical thickness ratio for the diagnosis of osteopenia and osteoporosis

Group>65 years≤65 years
AUC (95%CI)Sensitivity/%Specificity/%Youden indexCut-off valueAUC (95%CI)Sensitivity/%Specificity/%Youden indexCut-off value
Male
Osteopenia0.924 (0.824‒0.977)90.595.00.8550.440.741 (0.721‒0.962)75.072.40.4740.42
Osteoporosis0.813 (0.641‒0.984)96.676.50.7140.340.846 (0.756‒0.927)82.483.30.7650.32
Female
Osteopenia0.897 (0.753‒0.962)83.390.20.8330.390.768 (0.610‒0.926)61.993.70.5560.39
Osteoporosis0.930 (0.852‒0.987)90.585.20.7570.280.937 (0.848‒0.998)80.083.30.6770.28

新窗口打开| 下载CSV


2.5 胸骨皮质比例与DXA的诊断效能比较

对比DXA的诊断结果,计算利用胸骨皮质比例诊断骨量低下及骨质疏松的准确率、漏诊率和误诊率。结果表明,在>65岁患者中,胸骨皮质比例对骨量正常组男性患者的诊断准确率(90.5%)较骨量低下组(90.0%)及骨质疏松组(71.4%)更高,对骨质疏松组男性及女性患者的诊断误诊率(9.1%、4.2%)较骨量正常组(9.5%、15.4%)及骨量低下组(17.7%、17.4%)低;在≤65岁患者中,胸骨皮质比例对骨质疏松组男性患者的诊断准确率(85.7%)较骨量正常组(75.0%)及骨量低下组(77.8%)更高,对骨量正常组男性及女性患者的诊断误诊率(5.3%、5.9%)较骨量低下组(21.7%、15.8%)及骨质疏松组(13.3%、14.3%)低。结果见表6

表6   胸骨皮质比例与DXA诊断结果的比较

Tab 6  Comparison of sternal cortical thickness ratio and DXA diagnostic results

Item>65 years≤65 years
Normal bone mass group (n=33)Osteopenia group (n=41)Osteoporosis group (n=41)Normal bone mass group (n=45)Osteopenia group (n=25)Osteoporosis group (n=13)
Male
Accuracy/%90.590.071.475.077.885.7
False negative rate/%9.510.028.625.022.214.3
False positive rate/%9.517.79.15.321.713.3
Female
Accuracy/%83.390.885.276.287.583.3
False negative rate/%16.79.514.823.812.516.7
False positive rate/%15.417.44.25.915.814.3

新窗口打开| 下载CSV


3 讨论

早期并快速诊断是预防及治疗骨量低下及骨质疏松的重点。我们发现,在骨质疏松患者的胸部CT影像中,胸骨的骨皮质厚度较非骨质疏松患者明显变薄。由于个体间存在差异,胸骨的骨皮质厚度可能受身高、体质量的影响,因此本研究通过胸部CT在气管分叉处平面测量胸骨皮质比例,分析其与DXA检测获得的骨密度的相关性,并评估胸骨皮质比例诊断不同年龄段及性别的患者骨质疏松的能力。该方法简便易操作,不仅可减少个体差异的影响,还可在行常规CT检查时进行骨质疏松的初步诊断,降低患者的辐射暴露及医疗费用。这对于骨质疏松的早期预防干预、提高患者生活质量具有一定的意义。

BARNETT等14于1960年在掌骨上探索皮质厚度与骨质疏松的关系,发现股骨和掌骨骨皮质与骨干厚度间的比值与脊柱的双凹度值存在相关性。此后,多个研究均表明,掌骨15、肱骨12、股骨16、桡骨17-19等处的骨皮质厚度均与骨密度呈高度相关性。且有多个研究20-22表明,利用胸腹CT检查结果可预测骨密度的降低。YAO等23通过腹部CT分析腰1椎体骨皮质厚度并预测骨质疏松,发现骨皮质厚度与骨密度呈正相关(r=0.604)。上述相关研究中采取的脊柱、肱骨、腹部CT等均不是急诊住院患者的常规检查项目。而胸部CT不仅是体检常见项目,也是急诊住院患者乃至各专科住院患者常见的检查项目,更为普遍常用,有利于研究的进一步开展。

性别与年龄是骨质疏松的危险因素。女性及高龄患者是骨质疏松的高危人群。MECZEKALSKI等24发现,女性体内的雌激素能刺激成骨细胞活动。随着年龄增加,雌激素的缺乏会促进破骨细胞的产生25,并减少肠道对钙的吸收26-27,从而导致骨质流失27。ITOH等28研究发现50岁人群开始出现骨密度降低。而骨密度降低可导致髋部骨折的风险增加4倍29。本研究中,骨质疏松组患者平均年龄高,女性人数多于男性,胸骨皮质比例低于男性,与以上研究结论一致。

本研究中,骨量正常组的胸骨皮质比例高于骨量低下组及骨质疏松组,骨量低下组胸骨皮质比例高于骨质疏松组;Spearman相关分析表明,不同年龄、性别患者的胸骨皮质比例与骨密度均呈正相关(>65岁男性,r=0.704;>65岁女性,r=0.785;≤65岁男性,r=0.735;≤65岁女性,r=0.479)。可见,高龄组的患者,尤其是女性患者,胸骨皮质比例与骨密度间的相关性更高,其相关系数高于YAO等23研究发现的骨皮质厚度与骨密度相关系数(r=0.604),提示本研究所使用的方法对于>65岁骨质疏松患者的诊断更为快速且高效。

LI等30及PICKHARDT等20通过腹部CT测量腰1椎体的CT值,绘制ROC曲线分析得出诊断骨质疏松的最佳截断值。在腰1椎体,CT值大于190 Hu考虑为骨量正常,CT值介于135~190 Hu之间考虑为骨量低下,CT值小于135 Hu考虑为骨质疏松。本研究同样使用ROC曲线来确定利用胸骨皮质比例诊断骨量低下及骨质疏松的截断值。根据截断值对198例患者诊断结果与DXA诊断结果进行比较,发现:在>65岁患者中,胸骨皮质比例对骨量正常组男性患者的诊断准确率较骨量低下组及骨质疏松组高,其对骨质疏松组患者的诊断误诊率较骨量正常组及骨量低下组低;在≤65岁患者中,胸骨皮质比例对骨质疏松组男性患者的诊断准确率较骨量正常组及骨量低下组高,其对骨量正常组患者的诊断误诊率较骨量低下组及骨质疏松组低。可见,本研究所使用的胸骨皮质比例指标对于>65岁骨质疏松者及≤65岁骨量正常者的诊断能力较强,误诊率低。

YAO等23通过腹部CT中腰1椎体骨皮质厚度预测骨质疏松,其研究结果与本研究一致,但诊断效能总体较低。本研究通过胸骨皮质比例诊断>65岁患者骨量低下及骨质疏松的敏感度(83.3%~96.6%)与该文献结果(83.8%)接近,但特异度(76.5%~95.0%)及AUC(0.813~0.930)均高于该文献结果(特异度为63.2%AUC=0.81)。胸骨皮质比例诊断骨量低下及骨质疏松的诊断效能更高,原因包括以下2个方面:首先,其他研究者所选用的腰椎形状不规则,在测量时可能存在误差;其次,胸骨作为保护纵隔和胸腔脏器的重要骨质结构,在上肢和躯干之间起到枢纽作用,且胸骨形状规则、清晰,较为稳定,变异率不高,可减少测量时出现的误差。马得廷等31通过分析1 000例受试者的影像学资料发现胸骨体变异人数仅占总人数的6.2%。本研究采取胸骨皮质比例作为研究对象,可确保研究结果相对可靠,更适用于大多数人群。

由此可见,胸骨皮质比例对于早期诊断骨质疏松具有一定的意义。首先,本研究证实了高龄及女性患者更容易出现骨量低下及骨质疏松;其次,对>65岁男性和女性患者可根据胸骨皮质比例可靠地诊断为骨质疏松(<0.34,<0.28),对≤65岁男性和女性患者也可根据胸骨皮质比例可靠地诊断为骨量正常(>0.42,>0.39),且误诊率及漏诊率较低。基于本研究的结果,笔者建议,若患者胸骨皮质比例低于骨量低下截断值,可对其进行早期防治,包括增强营养补充、加强日照、适当运动、戒烟酒、少饮用咖啡及碳酸饮料等生活方式的调整,早期进行钙剂、维生素D等的补充1532;若患者胸骨皮质比例低于骨质疏松截断值,建议其尽早前往专科就诊,使用抗骨质疏松药物治疗。

综上所述,本研究提出可利用胸骨皮质比例对骨量低下及骨质疏松进行诊断。该方法有一定的可行性,可为早期检出并诊断骨量低下及骨质疏松提供参考。但研究样本量较少,且为单中心研究,后续可开展多中心研究,进一步验证本研究结果;并可对于未进行DXA检查及诊断的患者进行胸骨皮质比例测定,持续追踪其诊疗及预后,探讨该方法的诊断效能及其可行性。

作者贡献声明

王海嵘、洪雯、于洋参与了实验设计,孙俊楠、张姣姣、高月、王虎参与了数据分析,王海嵘、禹茜参与了研究实施、论文写作及修改。所有作者均阅读并同意了最终稿件的提交。

The study was designed by WANG Hairong, HONG Wen and YU Yang. The data analysis was enforced by SUN Junnan, ZHANG Jiaojiao, GAO Yue and WANG Hu. The research implementation, and manuscript drafting and revision were enforced by WANG Hairong and YU Xi. All the authors have read the last version of paper and consented for submission.

利益冲突声明

所有作者声明不存在利益冲突。

All authors disclose no relevant conflict of interests.

参考文献

BIJLSMA A Y, MESKERS C M, WESTENDORP R J, et al. Chronology of age-related disease definitions: osteoporosis and sarcopenia[J]. Ageing Res Rev, 2012, 11(2): 320-324.

[本文引用: 1]

NIH Consensus Development Panel on Osteoporosis Prevention, Diagnosis, and Therapy. Osteoporosis prevention, diagnosis, and therapy[J]. JAMA, 2001, 285(6): 785-795.

[本文引用: 1]

中华医学会骨质疏松和骨矿盐疾病分会. 原发性骨质疏松症诊治指南(2011年)[J]. 中华骨质疏松和骨矿盐疾病杂志, 2011, 4(1): 2-17.

[本文引用: 1]

Osteoporosis and Bone Mineral Disease Branch of Chinese Medical Association. Guidelines for the diagnosis and treatment of primary osteoporosis (2011)[J]. Chinese Journal of Osteoporosis and Bone Mineral Research, 2011, 4(1): 2-17.

[本文引用: 1]

中华医学会骨质疏松和骨矿盐疾病分会. 原发性骨质疏松症诊疗指南(2017)[J]. 中国骨质疏松杂志, 2019, 25(3): 281-309.

[本文引用: 1]

Osteoporosis and Bone Mineral Disease Branch of Chinese Medical Association. Guidelines for the diagnosis and treatment of primary osteoporosis (2017)[J]. Chinese Journal of Osteoporosis, 2019, 25(3): 281-309.

[本文引用: 1]

马远征, 王以朋, 刘强, 等. 中国老年骨质疏松症诊疗指南(2018)[J]. 中国骨质疏松杂志, 2018, 24(12): 1541-1565.

[本文引用: 1]

MA Y Z, WANG Y P, LIU Q, et al. Guidelines for the diagnosis and treatment of osteoporosis in the elderly in China (2018)[J]. Chinese Journal of Osteoporosis, 2018, 24(12): 1541-1565.

[本文引用: 1]

LI F Z, ECKSTROM E, HARMER P, et al. Exercise and fall prevention: narrowing the research-to-practice gap and enhancing integration of clinical and community practice[J]. J Am Geriatr Soc, 2016, 64(2): 425-431.

[本文引用: 1]

刘琳. DXA影像评价与骨密度测定联合诊断原发性骨质疏松症的临床探讨[J]. 影像研究与医学应用, 2019, 3(17): 50-51.

[本文引用: 1]

LIU L. Clinical discussion of DXA imaging evaluation and bone densitometry in the diagnosis of primary osteoporosis[J]. Journal of Imaging Research and Medical Applications, 2019, 3(17): 50-51.

[本文引用: 1]

RAMAN-WILMS L. Book review: guidelines for preclinical evaluation and clinical trials in osteoporosis[J]. Ann Pharmacother, 1999, 33: 1377-1378.

[本文引用: 1]

JANG S, GRAFFY P M, ZIEMLEWICZ T J, et al. Opportunistic osteoporosis screening at routine abdominal and thoracic CT: normative L1 trabecular attenuation values in more than 20 000 adults[J]. Radiology, 2019, 291(2): 360-367.

[本文引用: 1]

LESLIE W D, GIANGREGORIO L M, YOGENDRAN M, et al. A population-based analysis of the post-fracture care gap 1996‒2008: the situation is not improving[J]. Osteoporos Int, 2012, 23(5): 1623-1629.

[本文引用: 1]

KANIS J A. Diagnosis of osteoporosis and assessment of fracture risk[J]. Lancet, 2002, 359(9321): 1929-1936.

[本文引用: 1]

TINGART M J, APRELEVA M, VON STECHOW D, et al. The cortical thickness of the proximal humeral diaphysis predicts bone mineral density of the proximal humerus[J]. J Bone Joint Surg Br, 2003, 85(4): 611-617.

[本文引用: 2]

BLOOM R A. A comparative estimation of the combined cortical thickness of various bone sites[J]. Skeletal Radiol, 1980, 5(3): 167-170.

[本文引用: 1]

BARNETT E, NORDIN B E. The radiological diagnosis of osteoporosis: a new approach[J]. Clin Radiol, 1960, 11: 166-174.

[本文引用: 1]

YOSHII I, AKITA K. Cortical thickness relative to the transverse diameter of third metacarpal bone reflects bone mineral density in patients with rheumatoid arthritis[J]. Bone, 2020, 137: 115405.

[本文引用: 2]

MATHER J, MACDERMID J C, FABER K J, et al. Proximal humerus cortical bone thickness correlates with bone mineral density and can clinically rule out osteoporosis[J]. J Shoulder Elbow Surg, 2013, 22(6): 732-738.

[本文引用: 1]

PISTOIA W, VAN RIETBERGEN B, RÜEGSEGGER P. Mechanical consequences of different scenarios for simulated bone atrophy and recovery in the distal radius[J]. Bone, 2003, 33(6): 937-945.

[本文引用: 1]

RAUSCH S, KLOS K, GRAS F, et al. Utility of the cortical thickness of the distal radius as a predictor of distal-radius bone density[J]. Arch Trauma Res, 2013, 2(1): 11-15.

YE C X, GUO Y B, ZHENG Y H, et al. Distal radial cortical bone thickness correlates with bone mineral density and can predict osteoporosis: a cohort study[J]. Injury, 2020, 51(11): 2617-2621.

[本文引用: 1]

PICKHARDT P J, POOLER B D, LAUDER T, et al. Opportunistic screening for osteoporosis using abdominal computed tomography scans obtained for other indications[J]. Ann Intern Med, 2013, 158(8): 588-595.

[本文引用: 2]

LEE S J, BINKLEY N, LUBNER M G, et al. Opportunistic screening for osteoporosis using the sagittal reconstruction from routine abdominal CT for combined assessment of vertebral fractures and density[J]. Osteoporos Int, 2016, 27(3): 1131-1136.

NAZIA FATHIMA S M, TAMILSELVI R, PARISA BEHAM M, et al. Diagnosis of osteoporosis using modified U-net architecture with attention unit in DEXA and X-ray images[J]. J Xray Sci Technol, 2020, 28(5): 953-973.

[本文引用: 1]

YAO Q, LIU J, YUAN K, et al. Comparison of L1 CT-attenuation and cortical thickness in predicting osteoporosis by opportunistic CT[J]. J Xray Sci Technol, 2022, 30(3): 631-640.

[本文引用: 3]

MECZEKALSKI B, PODFIGURNA-STOPA A, GENAZZANI A R. Hypoestrogenism in young women and its influence on bone mass density[J]. Gynecol Endocrinol, 2010, 26(9): 652-657.

[本文引用: 1]

POSTNOV A A, VINOGRADOV A V, VAN DYCK D, et al. Quantitative analysis of bone mineral content by X-ray microtomography[J]. Physiol Meas, 2003, 24(1): 165-178.

[本文引用: 1]

NELSON M E, FISHER E C, CATSOS P D, et al. Diet and bone status in amenorrheic runners[J]. Am J Clin Nutr, 1986, 43(6): 910-916.

[本文引用: 1]

SHUFELT C L, TORBATI T, DUTRA E. Hypothalamic amenorrhea and the long-term health consequences[J]. Semin Reprod Med, 2017, 35(3): 256-262.

[本文引用: 2]

ITOH S, TOMIOKA H, TANAKA J, et al. Relationship between bone mineral density of the distal radius and ulna and fracture characteristics[J]. J Hand Surg Am, 2004, 29(1): 123-130.

[本文引用: 1]

KANIS J A, BORGSTROM F, DE LAET C, et al. Assessment of fracture risk[J]. Osteoporos Int, 2005, 16(6): 581-589.

[本文引用: 1]

LI Y L, WONG K H, LAW M W, et al. Opportunistic screening for osteoporosis in abdominal computed tomography for Chinese population[J]. Arch Osteoporos, 2018, 13(1): 76.

[本文引用: 1]

马得廷, 王君霞, 李瑞光, 等. 基于多模态多层螺旋CT胸骨变异的观察[J]. 中华解剖与临床杂志, 2022, 27(2): 87-91.

[本文引用: 1]

MA D T, WANG J X, LI R G, et al. Observation of sternum variation based on multimodal multi-slice spiral CT[J]. Chinese Journal of Anatomy and Clinics, 2022, 27(2): 87-91.

[本文引用: 1]

徐俪筝, 陈鸣声, 司磊. 骨质疏松症卫生经济学评价研究的现状、挑战及建议[J]. 中华内分泌代谢杂志, 2021, 37(9): 859-862.

[本文引用: 1]

XU L Z, CHEN M S, SI L. Current status, challenges and suggestions of health economics evaluation research on osteoporosis[J].Chinese Journal of Endocrinology and Metabolism, 2021, 37(9): 859-862.

[本文引用: 1]

/