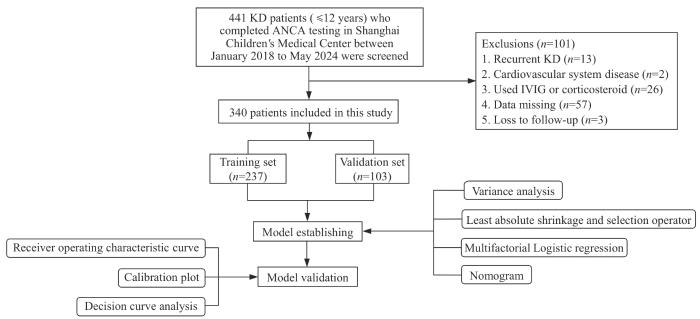
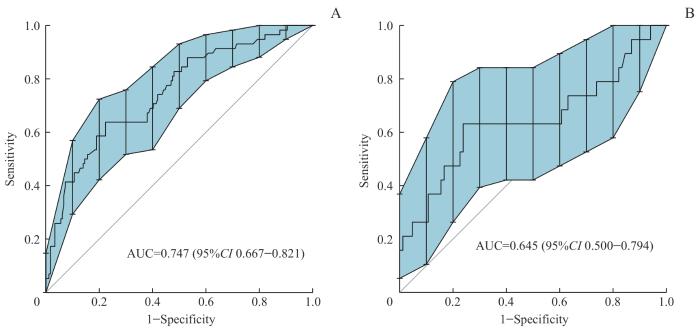
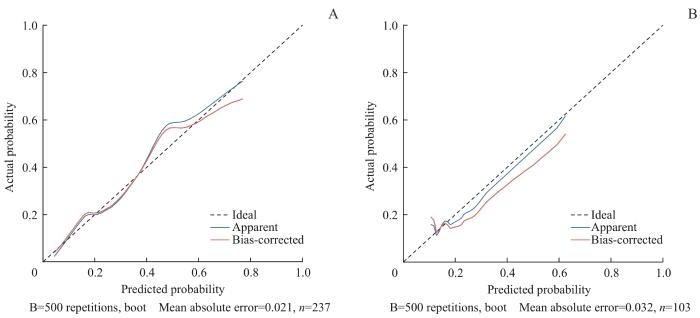
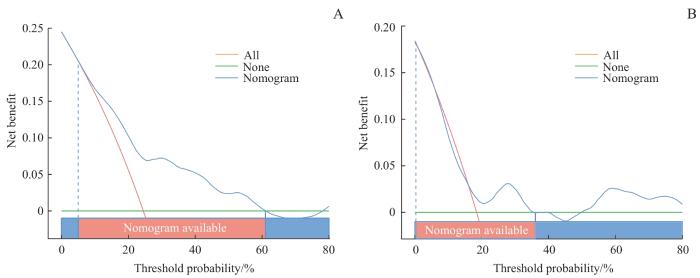
Objective ·To evaluate the predictive value of anti-neutrophil cytoplasmic antibodies (ANCA) in Kawasaki disease (KD) complicated with coronary artery lesions (CALs) and to construct a nomogram prediction model. Methods ·A retrospective study was conducted to collect the clinical data of 340 children with KD admitted to Shanghai Children's Medical Center from January 2018 to May 2024. All patients were randomly divided in a 7:3 ratio into a training set (n=237) and a validation set (n=103). Univariate analysis and least absolute shrinkage and selection operator (LASSO) were applied to screen the risk factors of CALs, which were incorporated into multifactorial Logistic regression analysis to develop the nomogram model. The model's discrimination, calibration and clinical practicability were evaluated using the receiver operating characteristic (ROC) curve, calibration curve, Hosmer-Lemeshow goodness-of-fit test, and decision curve analysis (DCA). A new predictive scoring system was obtained by assigning scores to each variable based on the coefficients of the independent variables in the Logistic regression equation, and its predictive efficacy was then compared with that of three commonly used scoring systems, Kobayashi, Egami, and Sano scoring models. Results ·Male, low serum albumin level, ANCA positivity, and intravenous immunoglobulin resistance were risk factors for the development of CALs in children with KD, based on which a nomogram model was constructed. The area under the ROC curve for the nomogram in the training set and validation set were 0.747 (95%CI 0.667‒0.821) and 0.645 (95%CI 0.500‒0.794), respectively, indicating good effectiveness. The model was verified to have good predictive accuracy through the calibration curve and Hosmer-Lemeshow goodness-of-fit test (training set: χ2 =5.105, P=0.746; validation set:χ2 =13.549, P=0.094). The DCA showed its clinical usefulness. A predictive scoring system for CALs was developed based on the coefficients of the Logistic regression equation, which demonstrated higher sensitivity (58.4%) and specificity (78.7%) compared to the Kobayashi, Egami, and Sano scoring models. Conclusion ·This study developed a new scoring model based on ANCA to effectively predict the risk of CALs in KD patients. The model provides valuable reference for clinicians to identify high-risk patients early, and to formulate personalized treatment plans and management strategies.
CHEN Rong, ZHANG Meng, ZHU Diqi, GUO Ying, SHEN Jie. Nomogram for predicting the risk of coronary artery lesions in patients with Kawasaki disease based on anti-neutrophil cytoplasmic antibodies. Journal of Shanghai Jiao Tong University (Medical Science)[J], 2025, 45(4): 459-467 doi:10.3969/j.issn.1674-8115.2025.04.008
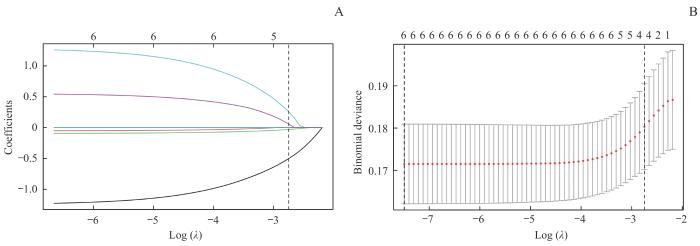
Note: A. LASSO coefficient profiles for 6 variables. B. A 9-fold cross-validation used in the LASSO regression. Dotted vertical lines represent the optimal values, determined using the minimum criteria (left dotted line) and the 1 standard error criterion (right dotted line). λmin=0.000 6, λ1se=0.064 0.
Fig 2
Risk factors selection using a LASSO regression model in the training set
Tab 2
表2
表2训练集KD患儿合并CAL影响因素的Logistic回归分析
Tab 2 Logistic regression analysis of factors associated with CALs in patients with KD in the training set
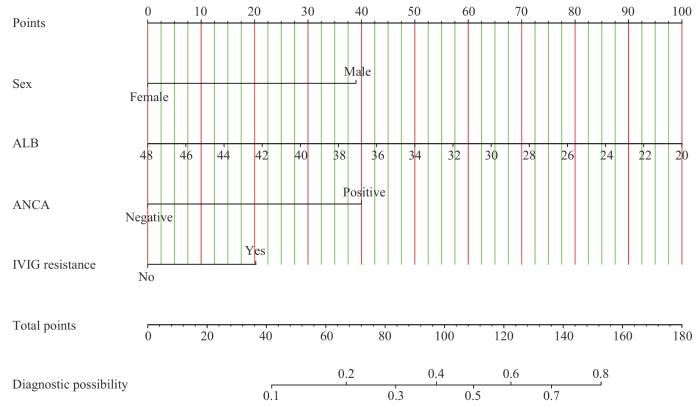
相比于由性别、ALB、ANCA构建的CAL预测模型,由性别、ALB、ANCA、IVIG抵抗4个因素构建的模型赤池信息准则(Akaike information criterion,AIC)值更小,模型拟合更好。根据AIC准则构建的模型方程为Logit P=4.508-1.259×性别-0.115×ALB+1.292×ANCA+0.653×IVIG抵抗;式中ALB单位为g/L。绘制列线图,将回归方程可视化(图3)。通过下方的刻度尺,可以得出每个变量在不同取值下所对应的单项分数,单项分数相加为总得分,与总得分相对应的预测概率即为KD患儿发生CAL的风险。
The study was designed by CHEN Rong and SHEN Jie. The paper was drafted and revised by CHEN Rong and SHEN Jie. The data were collected and analyzed by CHEN Rong, ZHANG Meng and ZHU Diqi. Case follow-up was completed by all the authors. All authors have read the last version of paper and consented to submission.
利益冲突声明
所有作者声明不存在利益冲突。
COMPETING INTERESTS
All authors declare no relevant conflict of interests.
The Subspecialty Group of Cardiology, the Society of Pediatrics, Chinese Medical Association; the Subspecialty Group of Rheumatology, the Society of Pediatrics, Chinese Medical Association; the Subspecialty Group of Immunology, the Society of Pediatrics, Chinese Medical Association, et al. The expert consensus on diagnosis and acute-phase treatment of Kawasaki disease[J]. Chinese Journal of Pediatrics, 2022, 60(1): 6-13.
de GRAEFF N, GROOT N, OZEN S, et al. European consensus-based recommendations for the diagnosis and treatment of Kawasaki disease: the SHARE initiative[J]. Rheumatology (Oxford), 2019, 58(4): 672-682.
JCS Joint Working Group. Guidelines for diagnosis and management of cardiovascular sequelae in Kawasaki disease (JCS 2013), digest version[J]. Circ J, 2014, 78(10): 2521-2562.
MCCRINDLE B W, ROWLEY A H, NEWBURGER J W, et al. Diagnosis, treatment, and long-term management of Kawasaki disease: a scientific statement for health professionals from the American heart association[J]. Circulation, 2017, 135(17): e927-e999.
SCHULTE-PELKUM J, RADICE A, NORMAN G L, et al. Novel clinical and diagnostic aspects of antineutrophil cytoplasmic antibodies[J]. J Immunol Res, 2014, 2014: 185416.
The Subspecialty Group of Cardiology, the Society of Pediatrics, Chinese Medical Association; the Subspecialty Group of Rheumatology, the Society of Pediatrics, Chinese Medical Association. Recommendations for clinical management of Kawasaki disease with coronary arterial lesions[J]. Chinese Journal of Pediatrics, 2012, 50(10): 746-749.
KOBAYASHI T, INOUE Y, TAKEUCHI K, et al. Prediction of intravenous immunoglobulin unresponsiveness in patients with Kawasaki disease[J]. Circulation, 2006, 113(22): 2606-2612.
EGAMI K, MUTA H, ISHII M, et al. Prediction of resistance to intravenous immunoglobulin treatment in patients with Kawasaki disease[J]. J Pediatr, 2006, 149(2): 237-240.
SANO T, KUROTOBI S, MATSUZAKI K, et al. Prediction of non-responsiveness to standard high-dose gamma-globulin therapy in patients with acute Kawasaki disease before starting initial treatment[J]. Eur J Pediatr, 2007, 166(2): 131-137.
TIAN J, LV H T, AN X J, et al. Endothelial microparticles induce vascular endothelial cell injury in children with Kawasaki disease[J]. Eur Rev Med Pharmacol Sci, 2016, 20(9): 1814-1818.
LINDQUIST M E, HICAR M D. B cells and antibodies in Kawasaki disease[J]. Int J Mol Sci, 2019, 20(8): E1834.
TAKAHASHI K, OHARASEKI T, YOKOUCHI Y. Pathogenesis of Kawasaki disease[J]. Clin Exp Immunol, 2011, 164(Supplement 1): 20-22.
del PRINCIPE D, PIETRAFORTE D, GAMBARDELLA L, et al. Pathogenetic determinants in Kawasaki disease: the haematological point of view[J]. J Cell Mol Med, 2017, 21(4): 632-639.
MA L, DU Z D. Advances in the pathogenesis of vascular endothelial cells injury in Kawasaki disease[J]. Chinese Journal of Pediatrics, 2016, 54(2): 158-160.
The Committee of the Autoantibodies Detection of Rheumatology and Immunology Physicians Committee of Chinese Medical Doctor Association. Experts consensus on the clinical application of antineutrophil cytoplasmic antibodies detection[J].Chinese Journal of Laboratory Medicine, 2018,41(9):644-650.
JIANG Z G, LIU L, YANG C Y, et al. Value of anti-neutrophil cytoplasmic antibody in diagnosis of Kawasaki disease[J].Chinese Journal of Contemporary Pediatrics, 2012, 14(1): 45-47.
LIU T, MENG X F, DU S J. Three methods for detecting antineutrophil cytoplasmic antibodies[J].International Medicine and Health Guildance News, 2018, 24(4): 590-592.
BRIGHT P D, SMITH L, USHER J, et al. False interpretation of diagnostic serology tests for patients treated with pooled human immunoglobulin G infusions: a trap for the unwary[J]. Clin Med, 2015, 15(2): 125-129.
ZHAO J M, WANG X H. Clinical significance of anti-neutrophil cytoplasmic antibodies and anti-endothelial cell antibodies in children with Kawasaki disease[J].Chinese Journal of Contemporary Pediatrics, 2014, 16(7): 740-744.
RUAN Y, YE B, ZHAO X. Clinical characteristics of Kawasaki syndrome and the risk factors for coronary artery lesions in China[J]. Pediatr Infect Dis J, 2013, 32(10): e397-402.
PIAO J H, JIN L H, LV J, et al. Epidemiological investigation of Kawasaki disease in Jilin Province of China from 2000 to 2008[J]. Cardiol Young, 2010, 20(4): 426-432.
TAKEKOSHI N, KITANO N, TAKEUCHI T, et al. Analysis of age, sex, lack of response to intravenous immunoglobulin, and development of coronary artery abnormalities in children with Kawasaki disease in Japan[J]. JAMA Netw Open, 2022, 5(6): e2216642.
KAYAPINAR O, OZDE C, KAYA A. Relationship between the reciprocal change in inflammation-related biomarkers (fibrinogen-to-albumin and hsCRP-to-albumin ratios) and the presence and severity of coronary slow flow[J]. Clin Appl Thromb Hemost, 2019, 25: 1076029619835383.
ZHANG Y K, HUANG C H, YANG L, et al. The relationship between albumin, erythrocyte sedimentation rate, platelet/lymphocyte ratio, neutrophil/lymphocyte ratio and the degree of coronary artery disease in children with Kawasaki disease[J]. Journal of Chinese Physician, 2023, 25(1): 23-27.
FUKAZAWA R, KOBAYASHI J, AYUSAWA M, et al. JCS/JSCS 2020 guideline on diagnosis and management of cardiovascular sequelae in Kawasaki disease[J]. Circ J, 2020, 84(8): 1348-1407.
XIE T, WANG Y, FU S, et al. Predictors for intravenous immunoglobulin resistance and coronary artery lesions in Kawasaki disease[J]. Pediatr Rheumatol Online J, 2017, 15(1): 17.


