
上海交通大学学报(医学版) ›› 2026, Vol. 46 ›› Issue (10): 1366-1374.doi: 10.3969/j.issn.1674-8115.2026.10.006
• 论著 · 临床研究 • 上一篇
龚雨薇, 张亦涵, 李冰馨, 冯晓云, 徐浣白, 刘芳, 王育璠, 彭永德, 陈蕊华( )
收稿日期:2025-11-26
接受日期:2026-05-25
出版日期:2026-10-28
发布日期:2026-10-28
通讯作者:
陈蕊华,副主任医师,博士;电子信箱:7240020128@shsmu.edu.cn。基金资助:
Gong Yuwei, Zhang Yihan, Li Bingxin, Feng Xiaoyun, Xu Huanbai, Liu Fang, Wang Yufan, Peng Yongde, Chen Ruihua()
Received:2025-11-26
Accepted:2026-05-25
Online:2026-10-28
Published:2026-10-28
Contact:
Chen Ruihua, E-mail: 7240020128@shsmu.edu.cn.Supported by:摘要:
目的·观察甲状腺功能减退症(简称甲减)患者伴有长新冠的临床特征以及甲状腺功能、左甲状腺素钠剂量、体力活动量的变化。方法·回顾性分析116例甲减患者的长新冠发生情况及临床特征,按病因和是否伴有长新冠分为4个亚组:HL组(桥本甲状腺炎伴长新冠)、HNL组(桥本甲状腺炎不伴长新冠)、NHL组(非桥本甲减伴长新冠)、NNL组(非桥本甲减不伴长新冠)。通过电子病历系统及问卷随访收集患者的一般情况,新型冠状病毒感染及长新冠相关信息,基线及新型冠状病毒感染后1、3、6、12、24个月的左甲状腺素钠剂量及抗体水平等临床资料;采用国际体力活动问卷收集患者的活动量数据。结果·共113例患者有新型冠状病毒感染史,其中77例(68.14%)伴有长新冠。伴有长新冠患者中,具有高脂血症病史的比例显著高于不伴有长新冠患者(P=0.008)。伴有长新冠患者中,90.9%的患者在感染后2年内调整左甲状腺素钠剂量,呈现先增后减的动态变化。HL组患者较NHL组患者更易出现头痛、头晕及脑雾症状。伴有长新冠的患者在新型冠状病毒感染2年余后活动量与感染前比较显著降低,与不伴有长新冠患者比较也显著降低(均P<0.05)。结论·甲减患者长新冠发生率较高;长新冠显著影响患者体力活动水平及甲状腺激素稳态,对左甲状腺素钠的剂量需求阶段性增加。
中图分类号:
龚雨薇, 张亦涵, 李冰馨, 冯晓云, 徐浣白, 刘芳, 王育璠, 彭永德, 陈蕊华. 甲状腺功能减退症患者长新冠发生情况及临床特征变化[J]. 上海交通大学学报(医学版), 2026, 46(10): 1366-1374.
Gong Yuwei, Zhang Yihan, Li Bingxin, Feng Xiaoyun, Xu Huanbai, Liu Fang, Wang Yufan, Peng Yongde, Chen Ruihua. Incidence and clinical characteristics changes of Long COVID in patients with hypothyroidism[J]. Journal of Shanghai Jiao Tong University (Medical Science), 2026,(10): 1366-1374.
| Group | Age/year | Male/n(%) | Alcohol/n(%) | Smoking/n(%) | BMI/(kg·m-2) | Hyperlipidemia/n(%) | Obesity/n(%) |
|---|---|---|---|---|---|---|---|
| L (n=77) | 48.49±14.14 | 17 (22.1) | 20 (26.0) | 24 (31.2) | 23.85±3.22 | 26 (33.8) | 9 (11.7) |
| NL (n=36) | 46.83±16.35 | 11 (30.6) | 5 (13. 9) | 9 (25.0) | 23.12±3.14 | 3 (8.3) | 3 (8.3) |
| χ2 /t value | -0.553 | 0.946 | 2.079 | 0.452 | -1.125 | 7.038 | 0.045 |
| P value | 0.581 | 0.331 | 0.149 | 0.502 | 0.263 | 0.008 | 0.832 |
| HL (n=33) | 48.45±13.39 | 7 (21.2) | 6 (18.2) | 7 (21.2) | 24.46±3.44 | 9 (27.3) | 6 (18.2) |
| NHL (n=44) | 48.52±14.83 | 10 (22.7) | 14 (31.8) | 17 (38.6) | 23.39±3.00 | 17 (38.6) | 3 (6.8) |
| HNL (n=20) | 45.7±16.95 | 7 (35.0) | 3 (15.0) | 4 (20.0) | 22.57±3.02 | 1 (5.0) | 1 (5.0) |
| NNL (n=16) | 48.25±15.99 | 4 (25.0) | 2 (12.5) | 5 (31.3) | 23.82±3.25 | 2 (12.5) | 2 (12.5) |
| χ2 /F value | 0.186 | 1.446 | 3.638 | 3.765 | 1.613 | 9.918 | 3.118 |
| P value | 0.906 | 0.725 | 0.300 | 0.290 | 0.190 | 0.017 | 0.385 |
表1 患者基线情况及合并症
Tab 1 Baseline characteristics and comorbidities of the patients
| Group | Age/year | Male/n(%) | Alcohol/n(%) | Smoking/n(%) | BMI/(kg·m-2) | Hyperlipidemia/n(%) | Obesity/n(%) |
|---|---|---|---|---|---|---|---|
| L (n=77) | 48.49±14.14 | 17 (22.1) | 20 (26.0) | 24 (31.2) | 23.85±3.22 | 26 (33.8) | 9 (11.7) |
| NL (n=36) | 46.83±16.35 | 11 (30.6) | 5 (13. 9) | 9 (25.0) | 23.12±3.14 | 3 (8.3) | 3 (8.3) |
| χ2 /t value | -0.553 | 0.946 | 2.079 | 0.452 | -1.125 | 7.038 | 0.045 |
| P value | 0.581 | 0.331 | 0.149 | 0.502 | 0.263 | 0.008 | 0.832 |
| HL (n=33) | 48.45±13.39 | 7 (21.2) | 6 (18.2) | 7 (21.2) | 24.46±3.44 | 9 (27.3) | 6 (18.2) |
| NHL (n=44) | 48.52±14.83 | 10 (22.7) | 14 (31.8) | 17 (38.6) | 23.39±3.00 | 17 (38.6) | 3 (6.8) |
| HNL (n=20) | 45.7±16.95 | 7 (35.0) | 3 (15.0) | 4 (20.0) | 22.57±3.02 | 1 (5.0) | 1 (5.0) |
| NNL (n=16) | 48.25±15.99 | 4 (25.0) | 2 (12.5) | 5 (31.3) | 23.82±3.25 | 2 (12.5) | 2 (12.5) |
| χ2 /F value | 0.186 | 1.446 | 3.638 | 3.765 | 1.613 | 9.918 | 3.118 |
| P value | 0.906 | 0.725 | 0.300 | 0.290 | 0.190 | 0.017 | 0.385 |
| Group | T>38 ℃/n(%) | Loss or reduction of smell and taste /n(%) | Myalgia/n(%) | Chest tightness/n(%) | Nausea/n(%) | Vomiting/n(%) |
|---|---|---|---|---|---|---|
| L (n=77) | 58 (75.3) | 32 (41.6) | 44 (57.1) | 39 (50.6) | 34 (44.2) | 27 (35.1) |
| NL (n=36) | 21 (58.3) | 5 (13.9) | 10 (27.8) | 11 (30.6) | 7 (19.4) | 6 (16.7) |
| χ² value | 3.367 | 8.528 | 8.478 | 4.015 | 6.480 | 4.016 |
| P value | 0.067 | 0.003 | 0.004 | 0.045 | 0.011 | 0.045 |
| HL (n=33) | 21 (63.6 ) | 19 (57.6)② | 17 (51.5) | 16 (48.5) | 17 (51.5) | 12 (36.4) |
| NHL (n=44) | 37 (84.1 )① | 13 (29.5) | 27 (61.4) | 23 (52.3)① | 17 (38.6)① | 15 (34.1)① |
| HNL (n=20) | 13 (65.0 ) | 4 (20.0) | 4 (20.0) | 9 (45.0) | 7 (35.0) | 6 (30.0 ) |
| NNL (n=16) | 8 (50.0 ) | 1 (6.3) | 6 (37.5) | 2 (12.5) | 0 (0) | 0 (0) |
| χ² value | 8.068 | 15.648 | 10.302 | 7.931 | 14.709 | 9.568 |
| P value | 0.044 | 0.001 | 0.016 | 0.049 | 0.002 | 0.021 |
表2 COVID-19诊断时患者症状比较
Tab 2 Symptoms at the time of COVID-19 diagnosis
| Group | T>38 ℃/n(%) | Loss or reduction of smell and taste /n(%) | Myalgia/n(%) | Chest tightness/n(%) | Nausea/n(%) | Vomiting/n(%) |
|---|---|---|---|---|---|---|
| L (n=77) | 58 (75.3) | 32 (41.6) | 44 (57.1) | 39 (50.6) | 34 (44.2) | 27 (35.1) |
| NL (n=36) | 21 (58.3) | 5 (13.9) | 10 (27.8) | 11 (30.6) | 7 (19.4) | 6 (16.7) |
| χ² value | 3.367 | 8.528 | 8.478 | 4.015 | 6.480 | 4.016 |
| P value | 0.067 | 0.003 | 0.004 | 0.045 | 0.011 | 0.045 |
| HL (n=33) | 21 (63.6 ) | 19 (57.6)② | 17 (51.5) | 16 (48.5) | 17 (51.5) | 12 (36.4) |
| NHL (n=44) | 37 (84.1 )① | 13 (29.5) | 27 (61.4) | 23 (52.3)① | 17 (38.6)① | 15 (34.1)① |
| HNL (n=20) | 13 (65.0 ) | 4 (20.0) | 4 (20.0) | 9 (45.0) | 7 (35.0) | 6 (30.0 ) |
| NNL (n=16) | 8 (50.0 ) | 1 (6.3) | 6 (37.5) | 2 (12.5) | 0 (0) | 0 (0) |
| χ² value | 8.068 | 15.648 | 10.302 | 7.931 | 14.709 | 9.568 |
| P value | 0.044 | 0.001 | 0.016 | 0.049 | 0.002 | 0.021 |
| Variables | L group (n=77) | NL group (n=36) | z/t value | P value | HLgroup (n=33) | NHL group (n=44) | HNL group (n=20) | NNL group (n=16) | F/H value | P value |
|---|---|---|---|---|---|---|---|---|---|---|
| Levothyroxine dose/μg | 50.00 (43.75,87.50) | 62.50 (50.00,100.00) | -2.523 | 0.012 | 50.00 (37.50,81.25) | 50.00 (43.75,87.50) | 68.75 (50.00,187.50) | 62.50 (50.00,100.00) | 7.020 | 0.071 |
| TT4/(nmol·L-1) | 116.44 (99.89,131.81) | 129.18 (98.77,140.20) | -1.078 | 0.281 | 121.19 (94.13,137.94) | 114.80 (101.07,130.16) | 131.17 (82.90,146.22) | 126.41 (106.93,132.05) | 1.248 | 0.742 |
| FT3/(pmol·L-1) | 5.15 (4.39,6.53) | 5.41 (4.15,7.67) | -0.838 | 0.402 | 5.24 (4.47,6.53) | 4.96 (4.37,6.58) | 6.49 (4.39,8.42) | 4.82 (4.15,6.03) | 4.815 | 0.186 |
| FT4/(pmol·L-1) | 15.55 (12.98,19.16) | 17.13 (13.56,22.35) | -1.564 | 0.118 | 14.49 (12.60,18.63) | 16.00 (14.02,19.54) | 17.47 (13.33,22.50) | 16.64 (13.56,19.33) | 3.998 | 0.262 |
| TSH/(μIU·mL-1) | 1.54 (0.43,4.14) | 2.03 (0.39,3.64) | -0.124 | 0.901 | 2.91 (0.64,4.59) | 1.05 (0.41,2.69) | 2.00 (0.35,3.95) | 2.24 (0.76,3.43) | 4.832 | 0.185 |
| TPOAb/(IU·mL-1) | 16.50 (8.67,139.50) | 77.65 (8.46,297.00) | -1.198 | 0.231 | 210.00 (77.40,384.50) | 9.00 (8.28,11.08) | 237.50 (143.25,529.82) | 8.28 (8.28,9.00) | 85.582 | <0.001 |
| TGAb/(IU·mL-1) | 15.00 (12.70,64.60) | 24.85 (12.85,211.00) | -0.635 | 0.525 | 179.00 (37.60,675.66) | 12.85 (12.10,14.43) | 207.50 (32.25,306.25) | 12.63 (11.53,13.98) | 59.556 | <0.001 |
| Tg/(ng·mL-1) | 3.06 (0.22,19.82) | 9.64 (1.64,60.65) | -1.657 | 0.097 | 2.39 (0.20,25.48) | 4.00 (0.33,14.85) | 18.15 (1.65,64.93) | 5.50 (1.04,26.42) | 3.268 | 0.352 |
| TSHI | 2.70 (1.75,3.22) | 2.74 (1.98,3.30) | -0.718 | 0.473 | 2.93 (2.00,3.47) | 2.17 (1.51,3.09) | 2.70 (1.98,3.27) | 2.76 (1.98,3.82) | 4.819 | 0.186 |
| TT4RI | 25.02 (7.88,53.19) | 32.34 (7.88,51.21) | -0.570 | 0.568 | 42.77 (12.42,62.56) | 15.68 (7.21,45.28) | 32.34 (7.88,48.45) | 34.36 (11.57,58.10) | 5.858 | 0.119 |
| FT3/FT4 | 0.34 (0.29,0.39) | 0.35 (0.26,0.38) | -0.228 | 0.820 | 0.36 (0.30,0.40) | 0.34 (0.28,0.40) | 0.38 (0.30,0.40) | 0.35 (0.24,0.36) | 3.814 | 0.282 |
| ESR/(mm·h-1) | 12.00 (5.21,20.37) | 6.95 (3.10,13.73) | -2.294 | 0.022 | 15.00 (5.57,21.93) | 10.62 (5.00,16.16) | 6.28 (3.00,14.48) | 9.05 (4.11,13.55) | 5.826 | 0.120 |
| Hb/(g·L-1) | 137.44±16.19 | 135.92±23.33 | -0.354 | 0.725 | 138.00 (129.00,151.00) | 134.01 (126.00,141.75) | 139.50 (113.50,158.00) | 133.50 (128.00,150.25) | 1.311 | 0.726 |
| PLT/(×109·L-1) | 240.88±68.49 | 235.17±68.32 | -0.413 | 0.680 | 252.80±69.88 | 231.93±66.83 | 232.50±48.92 | 238.51±88.52 | 0.663 | 0.576 |
| Cr/(μmol·L-1) | 58.00 (49.60,67.69) | 63.20 (51.83,89.79) | -1.818 | 0.069 | 60.30 (47.85,68.84) | 57.90 (52.60,67.69) | 65.05 (53.97,92.36) | 61.05 (49.60,75.95) | 4.215 | 0.239 |
| UA/(μmol·L-1) | 298.84 (240.30,353.41) | 342.05 (265.60,407.48) | -1.750 | 0.080 | 298.84 (239.55,387.80) | 296.90 (240.23,343.78) | 372.37 (274.60,455.75) | 301.55 (259.90,388.01) | 4.068 | 0.254 |
表3 患者基线甲状腺功能、左甲状腺素钠剂量及其他实验室指标
Tab 3 Baseline thyroid function, levothyroxine dose, and other laboratory parameters of the patients
| Variables | L group (n=77) | NL group (n=36) | z/t value | P value | HLgroup (n=33) | NHL group (n=44) | HNL group (n=20) | NNL group (n=16) | F/H value | P value |
|---|---|---|---|---|---|---|---|---|---|---|
| Levothyroxine dose/μg | 50.00 (43.75,87.50) | 62.50 (50.00,100.00) | -2.523 | 0.012 | 50.00 (37.50,81.25) | 50.00 (43.75,87.50) | 68.75 (50.00,187.50) | 62.50 (50.00,100.00) | 7.020 | 0.071 |
| TT4/(nmol·L-1) | 116.44 (99.89,131.81) | 129.18 (98.77,140.20) | -1.078 | 0.281 | 121.19 (94.13,137.94) | 114.80 (101.07,130.16) | 131.17 (82.90,146.22) | 126.41 (106.93,132.05) | 1.248 | 0.742 |
| FT3/(pmol·L-1) | 5.15 (4.39,6.53) | 5.41 (4.15,7.67) | -0.838 | 0.402 | 5.24 (4.47,6.53) | 4.96 (4.37,6.58) | 6.49 (4.39,8.42) | 4.82 (4.15,6.03) | 4.815 | 0.186 |
| FT4/(pmol·L-1) | 15.55 (12.98,19.16) | 17.13 (13.56,22.35) | -1.564 | 0.118 | 14.49 (12.60,18.63) | 16.00 (14.02,19.54) | 17.47 (13.33,22.50) | 16.64 (13.56,19.33) | 3.998 | 0.262 |
| TSH/(μIU·mL-1) | 1.54 (0.43,4.14) | 2.03 (0.39,3.64) | -0.124 | 0.901 | 2.91 (0.64,4.59) | 1.05 (0.41,2.69) | 2.00 (0.35,3.95) | 2.24 (0.76,3.43) | 4.832 | 0.185 |
| TPOAb/(IU·mL-1) | 16.50 (8.67,139.50) | 77.65 (8.46,297.00) | -1.198 | 0.231 | 210.00 (77.40,384.50) | 9.00 (8.28,11.08) | 237.50 (143.25,529.82) | 8.28 (8.28,9.00) | 85.582 | <0.001 |
| TGAb/(IU·mL-1) | 15.00 (12.70,64.60) | 24.85 (12.85,211.00) | -0.635 | 0.525 | 179.00 (37.60,675.66) | 12.85 (12.10,14.43) | 207.50 (32.25,306.25) | 12.63 (11.53,13.98) | 59.556 | <0.001 |
| Tg/(ng·mL-1) | 3.06 (0.22,19.82) | 9.64 (1.64,60.65) | -1.657 | 0.097 | 2.39 (0.20,25.48) | 4.00 (0.33,14.85) | 18.15 (1.65,64.93) | 5.50 (1.04,26.42) | 3.268 | 0.352 |
| TSHI | 2.70 (1.75,3.22) | 2.74 (1.98,3.30) | -0.718 | 0.473 | 2.93 (2.00,3.47) | 2.17 (1.51,3.09) | 2.70 (1.98,3.27) | 2.76 (1.98,3.82) | 4.819 | 0.186 |
| TT4RI | 25.02 (7.88,53.19) | 32.34 (7.88,51.21) | -0.570 | 0.568 | 42.77 (12.42,62.56) | 15.68 (7.21,45.28) | 32.34 (7.88,48.45) | 34.36 (11.57,58.10) | 5.858 | 0.119 |
| FT3/FT4 | 0.34 (0.29,0.39) | 0.35 (0.26,0.38) | -0.228 | 0.820 | 0.36 (0.30,0.40) | 0.34 (0.28,0.40) | 0.38 (0.30,0.40) | 0.35 (0.24,0.36) | 3.814 | 0.282 |
| ESR/(mm·h-1) | 12.00 (5.21,20.37) | 6.95 (3.10,13.73) | -2.294 | 0.022 | 15.00 (5.57,21.93) | 10.62 (5.00,16.16) | 6.28 (3.00,14.48) | 9.05 (4.11,13.55) | 5.826 | 0.120 |
| Hb/(g·L-1) | 137.44±16.19 | 135.92±23.33 | -0.354 | 0.725 | 138.00 (129.00,151.00) | 134.01 (126.00,141.75) | 139.50 (113.50,158.00) | 133.50 (128.00,150.25) | 1.311 | 0.726 |
| PLT/(×109·L-1) | 240.88±68.49 | 235.17±68.32 | -0.413 | 0.680 | 252.80±69.88 | 231.93±66.83 | 232.50±48.92 | 238.51±88.52 | 0.663 | 0.576 |
| Cr/(μmol·L-1) | 58.00 (49.60,67.69) | 63.20 (51.83,89.79) | -1.818 | 0.069 | 60.30 (47.85,68.84) | 57.90 (52.60,67.69) | 65.05 (53.97,92.36) | 61.05 (49.60,75.95) | 4.215 | 0.239 |
| UA/(μmol·L-1) | 298.84 (240.30,353.41) | 342.05 (265.60,407.48) | -1.750 | 0.080 | 298.84 (239.55,387.80) | 296.90 (240.23,343.78) | 372.37 (274.60,455.75) | 301.55 (259.90,388.01) | 4.068 | 0.254 |
| Variables | HL group (n=33) | NHL group (n=44) | χ²/t value | P value |
|---|---|---|---|---|
| Fatigue/n(%) | 22 (66.7) | 29 (65.9) | 0.005 | 0.945 |
| Headache and dizziness/n(%) | 23 (69.7) | 15 (34.1) | 9.564 | 0.002 |
| Shortness of breath/n(%) | 14 (42.4) | 17 (38.6) | 0.112 | 0.737 |
| Memory decline/n(%) | 18 (54.5) | 27 (61.4) | 0.361 | 0.548 |
| Brain fog/n(%) | 19 (57.6) | 15 (34.1) | 4.218 | 0.040 |
| Motor function decline/n(%) | 22 (66.7) | 29 (65.9) | 0.005 | 0.945 |
| Palpitations/n(%) | 19 (57.6) | 22 (50.0) | 0.435 | 0.510 |
| Taste alteration/n(%) | 6 (18.2) | 12 (27.3) | 0.87 | 0.351 |
| Olfactory changes/n(%) | 1 (3.0) | 4 (9.1) | 0.361 | 0.548 |
| Chest pain/n(%) | 12 (36.4) | 10 (22.7) | 1.718 | 0.190 |
| Muscle or joint pain/n(%) | 16 (48.5) | 14 (31.8) | 2.203 | 0.138 |
| Sleep disturbance/n(%) | 7 (21.2) | 16 (36.4) | 2.067 | 0.151 |
| Depressive state/n(%) | 4 (12.1) | 12 (27.3) | 1.790 | 0.181 |
| Anxiety state /n(%) | 9 (27.3) | 9 (20.5) | 0.489 | 0.484 |
| Thirst/n(%) | 15 (45.5) | 20 (45.5) | 0.000 | >0.999 |
| Vertigo/n(%) | 17 (51.5) | 16 (36.4) | 1.768 | 0.184 |
| Lymphadenopathy/n(%) | 10 (30.3) | 34 (22.7) | 0.563 | 0.453 |
| Chills/n(%) | 18 (54.5) | 16 (36.4) | 2.528 | 0.112 |
| Cough with sputum/n(%) | 14 (42.4) | 12 (27.3) | 1.936 | 0.164 |
| Sneezing/n(%) | 12 (36.4) | 14 (31.8) | 0.174 | 0.676 |
| Gastrointestinal discomfort/n(%) | 15 (45.5) | 15 (34.1) | 1.024 | 0.312 |
| Increased hair loss/n(%) | 20 (60.6) | 22 (50.0) | 0.856 | 0.355 |
| Number of symptoms | 9.48±4.60 | 8.09±4.35 | -1.359 | 0.178 |
表4 HL组与NHL组长新冠症状比较
Tab 4 Comparison of Long COVID symptoms between the HL and NHL groups
| Variables | HL group (n=33) | NHL group (n=44) | χ²/t value | P value |
|---|---|---|---|---|
| Fatigue/n(%) | 22 (66.7) | 29 (65.9) | 0.005 | 0.945 |
| Headache and dizziness/n(%) | 23 (69.7) | 15 (34.1) | 9.564 | 0.002 |
| Shortness of breath/n(%) | 14 (42.4) | 17 (38.6) | 0.112 | 0.737 |
| Memory decline/n(%) | 18 (54.5) | 27 (61.4) | 0.361 | 0.548 |
| Brain fog/n(%) | 19 (57.6) | 15 (34.1) | 4.218 | 0.040 |
| Motor function decline/n(%) | 22 (66.7) | 29 (65.9) | 0.005 | 0.945 |
| Palpitations/n(%) | 19 (57.6) | 22 (50.0) | 0.435 | 0.510 |
| Taste alteration/n(%) | 6 (18.2) | 12 (27.3) | 0.87 | 0.351 |
| Olfactory changes/n(%) | 1 (3.0) | 4 (9.1) | 0.361 | 0.548 |
| Chest pain/n(%) | 12 (36.4) | 10 (22.7) | 1.718 | 0.190 |
| Muscle or joint pain/n(%) | 16 (48.5) | 14 (31.8) | 2.203 | 0.138 |
| Sleep disturbance/n(%) | 7 (21.2) | 16 (36.4) | 2.067 | 0.151 |
| Depressive state/n(%) | 4 (12.1) | 12 (27.3) | 1.790 | 0.181 |
| Anxiety state /n(%) | 9 (27.3) | 9 (20.5) | 0.489 | 0.484 |
| Thirst/n(%) | 15 (45.5) | 20 (45.5) | 0.000 | >0.999 |
| Vertigo/n(%) | 17 (51.5) | 16 (36.4) | 1.768 | 0.184 |
| Lymphadenopathy/n(%) | 10 (30.3) | 34 (22.7) | 0.563 | 0.453 |
| Chills/n(%) | 18 (54.5) | 16 (36.4) | 2.528 | 0.112 |
| Cough with sputum/n(%) | 14 (42.4) | 12 (27.3) | 1.936 | 0.164 |
| Sneezing/n(%) | 12 (36.4) | 14 (31.8) | 0.174 | 0.676 |
| Gastrointestinal discomfort/n(%) | 15 (45.5) | 15 (34.1) | 1.024 | 0.312 |
| Increased hair loss/n(%) | 20 (60.6) | 22 (50.0) | 0.856 | 0.355 |
| Number of symptoms | 9.48±4.60 | 8.09±4.35 | -1.359 | 0.178 |
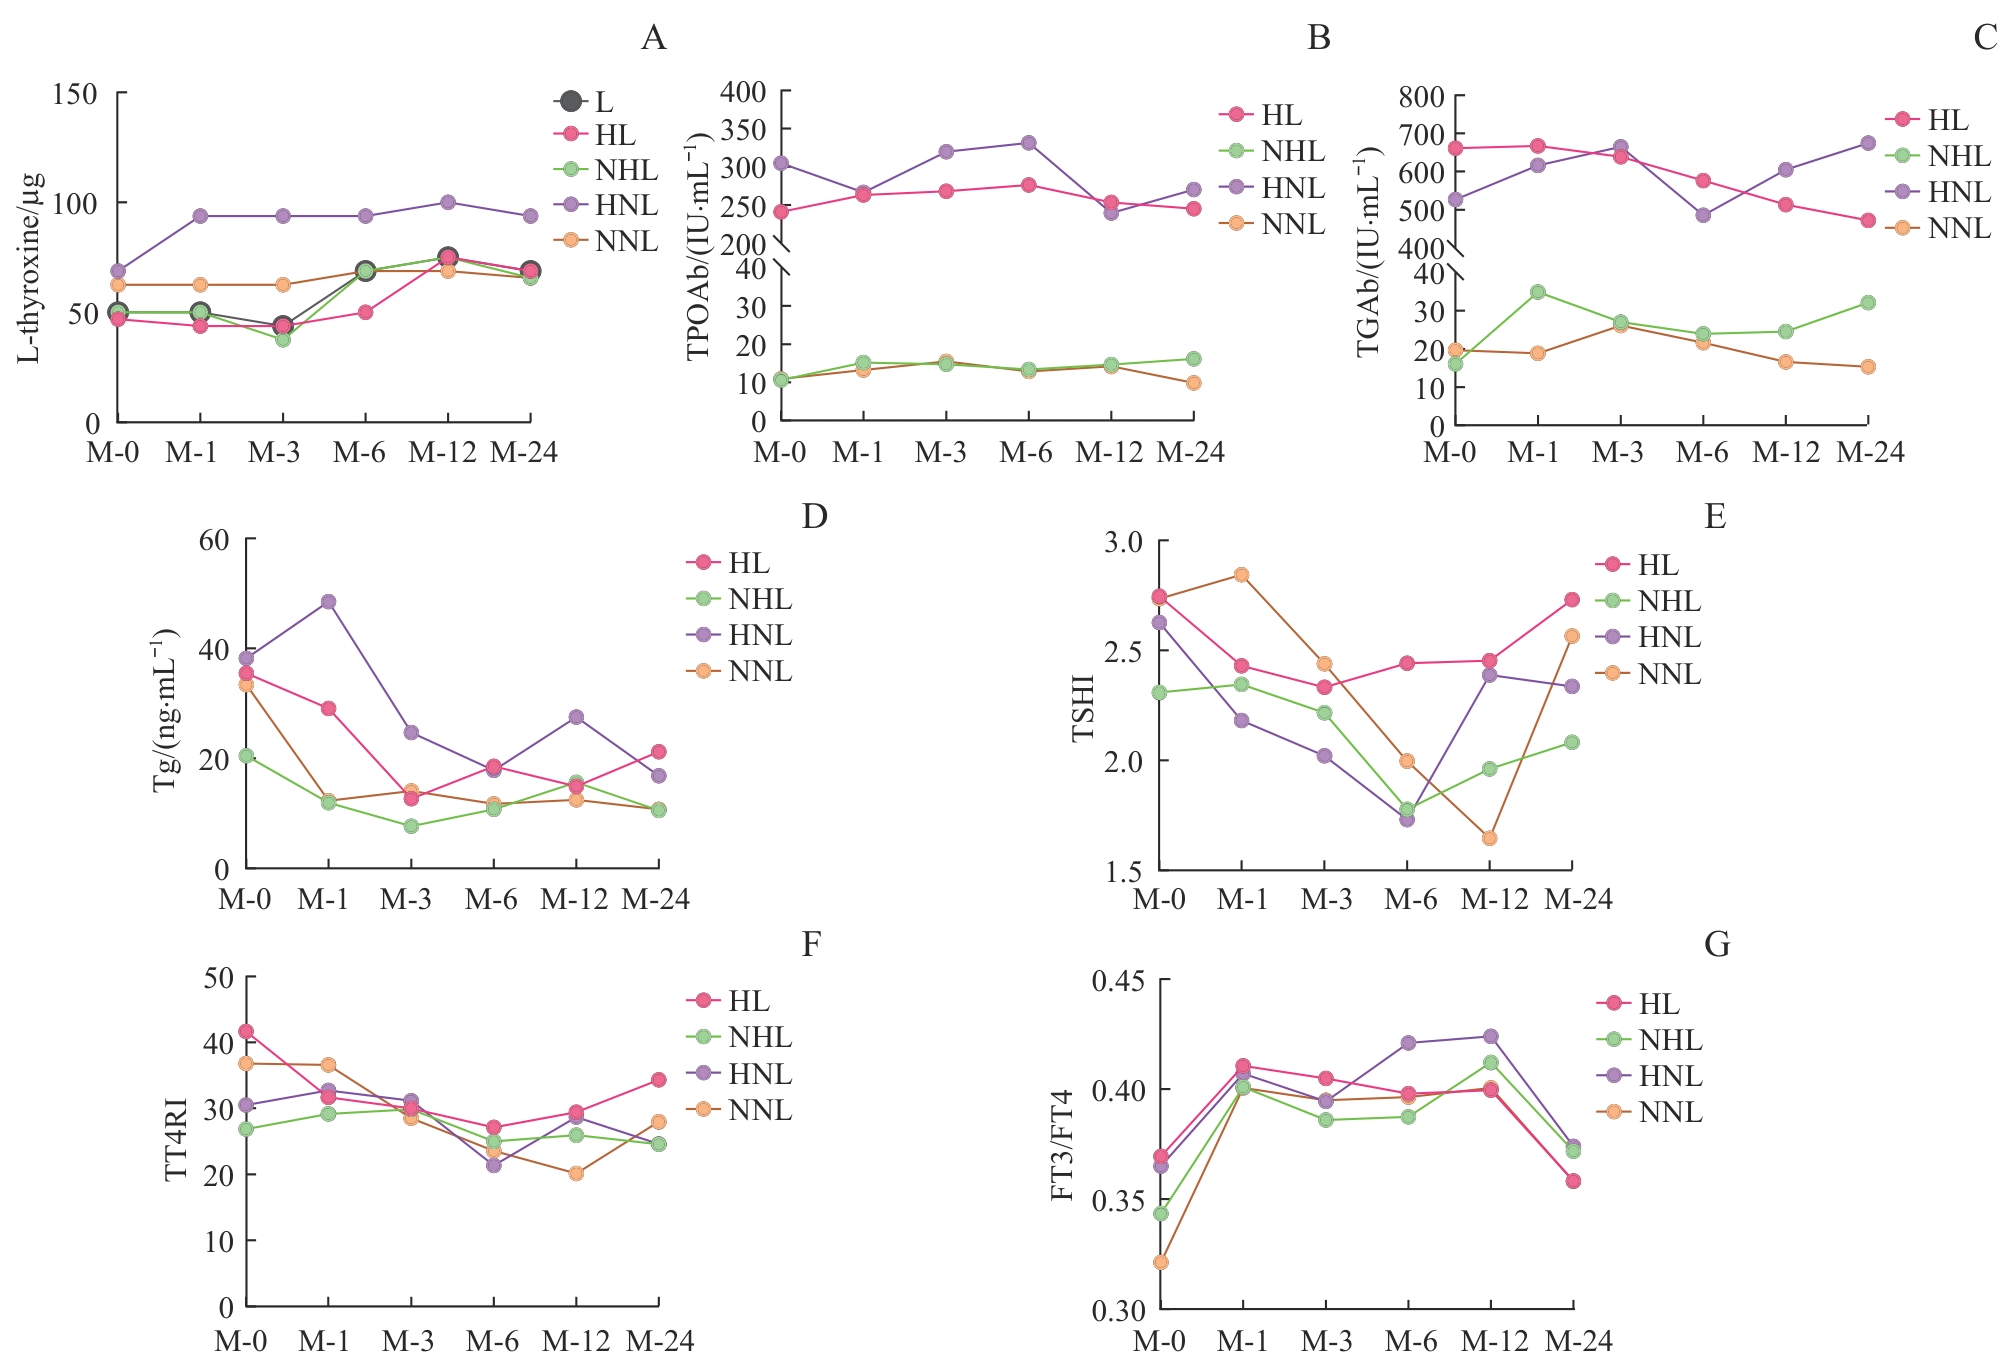
图1 各组患者新型冠状病毒感染后左甲状腺素钠剂量及甲状腺相关指标变化
Fig 1 Changes in levothyroxine dose and thyroid-related parameters in each group after COVID-19Note: A. Levothyroxine dose. B.TPOAb. C.TGAb. D.Tg. E.TSHI. F.TT4RI. G.FT3/FT4. M-0—baseline; M-1—1 month after initial infection; M-3—3 months after initial infection; M-6—6 months after initial infection; M-12—12 months after initial infection; M-24—24 months after initial infection.
| Group | Reduced exercise level/n(%) | Engagement in physical activity/n(%) | Total physical activity/(MET-min·week-1) | Vigorous-intensity activity/(MET-min·week-1) | Moderate-intensity activity/(MET-min·week-1) | Walking activity/(MET-min·week-1) | Low-level physical activity/n(%) | Moderate-level physical activity/n(%) | High-level physical activity/n(%) |
|---|---|---|---|---|---|---|---|---|---|
| L (n=77) | 31 (40.3) | 74 (96.1) | 1233.58 (710.05,1633.96) | 52.07 (0.00,348.52) | 120.00 (0.00,240.06) | 704.97 (458.37,1075.17) | 5 (6.5) | 68 (88.3) | 4 (5.2) |
| NL (n=36) | 3 (8.3) | 36 (100.00) | 1493.00 (1033.74,2556.89) | 683.22 (106.15,1606.11) | 117.80 (0.00,371.99) | 725.23 (336.12,1174.11) | 1 (2.8) | 28 (77.8) | 7 (19.4) |
| χ²/z value | 10.418 | ‒ | -2.674 | -3.995 | -0.518 | -0.832 | 5.492 | ||
| P value | 0.001 | 0.550 | 0.007 | <0.001 | 0.604 | 0.405 | 0.055 | ||
| HL (n=33) | 16(48.5)① | 31 (93.9) | 1325.24 (724.50,1796.64) | 155.41 (0.00,543.68) | 104.52 (0.00, 236.43) | 902.57 (401.05,1076.64) | 3 (9.1) | 29 (87.9) | 1 (3.0) |
| NHL (n=44) | 15(34.1) | 43 (97.7) | 1066.83 (701.53,1371.10) | 0.00 (0.00,278.85)② | 131.32 (0.00,276.28) | 693.00 (464.18,1069.62) | 2 (4.5) | 39 (88.6) | 3 (6.8) |
| HNL (n=20) | 1(5) | 20 (100.00) | 1464.38 (1172.79,2537.01) | 567.89 (25.82,1606.11) | 101.44 (0.00,356.59) | 668.48 (349.52,977.74) | 1 (5.0) | 16 (80.0) | 3 (15.0) |
| NNL (n=16) | 2(12.5) | 16 (100.00) | 1493.00 (891.72,3252.26) | 683.81 (160.25,1618.15) | 190.92 (0.00,385.15) | 763.23 (324.09,1338.37) | 0 (0) | 12 (75.0) | 4 (25.0) |
| χ²/H value | 14.411 | 1.753 | 8.422 | 18.197 | 0.655 | 1.042 | 7.479 | ||
| P value | 0.002 | 0.743 | 0.038 | <0.001 | 0.884 | 0.791 | 0.208 | ||
表5 各组患者初次新型冠状病毒感染后的运动水平变化
Tab 5 Changes in physical activity levels after the initial COVID-19 in each group
| Group | Reduced exercise level/n(%) | Engagement in physical activity/n(%) | Total physical activity/(MET-min·week-1) | Vigorous-intensity activity/(MET-min·week-1) | Moderate-intensity activity/(MET-min·week-1) | Walking activity/(MET-min·week-1) | Low-level physical activity/n(%) | Moderate-level physical activity/n(%) | High-level physical activity/n(%) |
|---|---|---|---|---|---|---|---|---|---|
| L (n=77) | 31 (40.3) | 74 (96.1) | 1233.58 (710.05,1633.96) | 52.07 (0.00,348.52) | 120.00 (0.00,240.06) | 704.97 (458.37,1075.17) | 5 (6.5) | 68 (88.3) | 4 (5.2) |
| NL (n=36) | 3 (8.3) | 36 (100.00) | 1493.00 (1033.74,2556.89) | 683.22 (106.15,1606.11) | 117.80 (0.00,371.99) | 725.23 (336.12,1174.11) | 1 (2.8) | 28 (77.8) | 7 (19.4) |
| χ²/z value | 10.418 | ‒ | -2.674 | -3.995 | -0.518 | -0.832 | 5.492 | ||
| P value | 0.001 | 0.550 | 0.007 | <0.001 | 0.604 | 0.405 | 0.055 | ||
| HL (n=33) | 16(48.5)① | 31 (93.9) | 1325.24 (724.50,1796.64) | 155.41 (0.00,543.68) | 104.52 (0.00, 236.43) | 902.57 (401.05,1076.64) | 3 (9.1) | 29 (87.9) | 1 (3.0) |
| NHL (n=44) | 15(34.1) | 43 (97.7) | 1066.83 (701.53,1371.10) | 0.00 (0.00,278.85)② | 131.32 (0.00,276.28) | 693.00 (464.18,1069.62) | 2 (4.5) | 39 (88.6) | 3 (6.8) |
| HNL (n=20) | 1(5) | 20 (100.00) | 1464.38 (1172.79,2537.01) | 567.89 (25.82,1606.11) | 101.44 (0.00,356.59) | 668.48 (349.52,977.74) | 1 (5.0) | 16 (80.0) | 3 (15.0) |
| NNL (n=16) | 2(12.5) | 16 (100.00) | 1493.00 (891.72,3252.26) | 683.81 (160.25,1618.15) | 190.92 (0.00,385.15) | 763.23 (324.09,1338.37) | 0 (0) | 12 (75.0) | 4 (25.0) |
| χ²/H value | 14.411 | 1.753 | 8.422 | 18.197 | 0.655 | 1.042 | 7.479 | ||
| P value | 0.002 | 0.743 | 0.038 | <0.001 | 0.884 | 0.791 | 0.208 | ||
| [1] | Du Z W, Wang Y C, Bai Y, et al. Estimate of COVID-19 deaths, China, December 2022-February 2023[J]. Emerg Infect Dis, 2023, 29(10): 2121-2124. |
| [2] | Bai Y, Peng Z H, Wei F Y, et al. Study on the COVID-19 epidemic in mainland China between November 2022 and January 2023, with prediction of its tendency[J]. J Biosaf Biosecur, 2023, 5(1): 39-44. |
| [3] | Soriano J B, Murthy S, Marshall J C, et al. A clinical case definition of post-COVID-19 condition by a Delphi consensus[J]. Lancet Infect Dis, 2022, 22(4): e102-e7. |
| [4] | Crook H, Raza S, Nowell J, et al. Long covid: mechanisms, risk factors, and management[J]. BMJ, 2021: n1648. |
| [5] | Gupta G, Buonsenso D, Wood J, et al. Mechanistic insights into long COVID: viral persistence, immune dysregulation, and multi-organ dysfunction[J]. Compr Physiol, 2025, 15(3): e70019. |
| [6] | Taylor P N, Medici M M, Hubalewska-Dydejczyk A, et al. Hypothyroidism[J]. Lancet, 2024, 404(10460): 1347-1364. |
| [7] | Nham E, Song E Y, Hyun H, et al. Concurrent subacute thyroiditis and Graves' disease after COVID-19: a case report[J]. J Korean Med Sci, 2023, 38(18): e134. |
| [8] | Sebők S, Gyires K. Long COVID and possible preventive options[J]. Inflammopharmacology, 2023, 31(6): 2807-2817. |
| [9] | Jostel A, Ryder W D, Shalet S M. The use of thyroid function tests in the diagnosis of hypopituitarism: definition and evaluation of the TSH Index[J]. Clin Endocrinol, 2009, 71(4): 529-534. |
| [10] | Yagi H, Pohlenz J, Hayashi Y, et al. Resistance to thyroid hormone caused by two mutant thyroid hormone receptors beta, R243Q and R243W, with marked impairment of function that cannot be explained by altered in vitro 3, 5, 3'-triiodothyroinine binding affinity[J]. J Clin Endocrinol Metab, 1997, 82(5): 1608-1614. |
| [11] | Chen X X, Zhou Y L, Zhou M X, et al. Diagnostic values of free triiodothyronine and free thyroxine and the ratio of free triiodothyronine to free thyroxine in thyrotoxicosis[J]. Int J Endocrinol, 2018, 2018: 4836736. |
| [12] | Qin S J, Zhang Y N, Li Y H, et al. Long COVID facts and findings: a large-scale online survey in 74, 075 Chinese participants[J]. Lancet Reg Health West Pac, 2024, 52: 101218. |
| [13] | Nabavi N. Long covid: how to define it and how to manage it[J]. BMJ, 2020: m3489. |
| [14] | Asadi-Pooya A A, Akbari A, Emami A, et al. Risk factors associated with Long COVID syndrome: a retrospective study [J]. Iran J Med Sci, 2021, 46(6): 428-436. |
| [15] | Astin R, Banerjee A, Baker M R, et al. Long COVID: mechanisms, risk factors and recovery[J]. Exp Physiol, 2023, 108(1): 12-27. |
| [16] | Bae G, Yang Z Q, Bucci D, et al. Longitudinal lipoprotein and inflammatory mediators analysis uncover persisting inflammation and hyperlipidemia following SARS-CoV-2 infection in long COVID-19[J]. Metabolomics, 2025, 21(3): 65. |
| [17] | Huang L A, Lo S C, Yang Y S, et al. Association of COVID-19 infection with subsequent thyroid dysfunction: an international population-based propensity score matched analysis[J]. Thyroid, 2024, 34(4): 442-449. |
| [18] | Lania A, Sandri M T, Cellini M, et al. Thyrotoxicosis in patients with COVID-19: the THYRCOV study[J]. Eur J Endocrinol, 2020, 183(4): 381-387. |
| [19] | Khoo B, Tan T, Clarke S A, et al. Thyroid function before, during, and after COVID-19[J]. J Clin Endocrinol Metab, 2021, 106(2): e803-e811. |
| [20] | Jung Y H, Ha E H, Park J, et al. Neurological and psychiatric manifestations of post-COVID-19 conditions[J]. J Korean Med Sci, 2023, 38(11): e83. |
| [21] | Song W J, Hui C K M, Hull J H, et al. Confronting COVID-19-associated cough and the post-COVID syndrome: role of viral neurotropism, neuroinflammation, and neuroimmune responses[J]. Lancet Respir Med, 2021, 9(5): 533-544. |
| [22] | Soh H S, Cho B. Long COVID-19 and health-related quality of life of mild cases in Korea: 3-months follow-up of a single community treatment center[J]. J Korean Med Sci, 2022, 37(46): e326. |
| [23] | Woodruff M C, Ramonell R P, Nguyen D C, et al. Extrafollicular B cell responses correlate with neutralizing antibodies and morbidity in COVID-19[J]. Nat Immunol, 2020, 21(12): 1506-1516. |
| [24] | Najjar S, Pahlajani S, de Sanctis V, et al. Neurovascular unit dysfunction and blood-brain barrier hyperpermeability contribute to schizophrenia neurobiology: a theoretical integration of clinical and experimental evidence[J]. Front Psychiatry, 2017, 8: 83. |
| [25] | Hoogland I C, Houbolt C, van Westerloo D J, et al. Systemic inflammation and microglial activation: systematic review of animal experiments[J]. J Neuroinflammation, 2015, 12: 114. |
| [26] | Feter N, Caputo E L, Delpino F M, et al. Physical activity and long COVID: findings from the Prospective Study About Mental and Physical Health in Adults cohort[J]. Public Health, 2023, 220: 148-154. |
| [27] | Palau P, Calvo B, Sastre C, et al. Unraveling the mechanisms behind exercise intolerance and recovery in long COVID[J]. Am J Med, 2025, 138(2): 362-367. |
| [28] | Aschman T, Wyler E, Baum O, et al. Post-COVID exercise intolerance is associated with capillary alterations and immune dysregulations in skeletal muscles[J]. Acta Neuropathol Commun, 2023, 11(1): 193. |
| [1] | 徐婷, 张豫文. 1例甲巯咪唑乳膏治疗口服不耐受的甲状腺功能亢进症病例报道[J]. 上海交通大学学报(医学版), 2024, 44(3): 412-416. |
| [2] | 陈惠, 朱唯一, 姚屹瑾. 调整左旋甲状腺素治疗剂量对甲状腺功能减退孕妇母婴结局影响的meta分析[J]. 上海交通大学学报(医学版), 2023, 43(7): 906-915. |
| [3] | 许飞,汤玲琳,袁红,宋少莉,黄钢. 分化型甲状腺癌患者碘治疗前肝功能、血脂及血常规水平变化[J]. 上海交通大学学报(医学版), 2018, 38(6): 632-. |
| [4] | 成玮,蒋瑛,张维佳,李晓华,徐艳红,贝鹏剑 . 以甲状腺功能减退症合并全身性水肿、肺动脉高压为首发表现的POEMS综合征1例报道[J]. 上海交通大学学报(医学版), 2017, 37(1): 134-. |
| [5] | 郭艾,刘纯. 从TPOAb阳性值探讨妊娠期甲状腺功能正常取值范围[J]. 上海交通大学学报(医学版), 2016, 36(12): 1740-. |
| [6] | 顾爱春,周雯婷,马玉波. 抗甲状腺药物对131I治疗Graves'病疗效的影响分析[J]. 上海交通大学学报(医学版), 2015, 35(9): 1340-. |
| [7] | 傅宏亮,杜学亮,李佳宁,等. 计算剂量方案行格雷夫斯病甲状腺功能亢进放射性碘治疗的疗效分析[J]. 上海交通大学学报(医学版), 2014, 34(7): 1039-. |
| [8] | 卢永霞,李启富,舒小雨,等. 不同孕期及年龄妇女甲状腺功能的分析[J]. 上海交通大学学报(医学版), 2014, 34(2): 197-. |
| [9] | 赵泽飞, 赵咏桔, 顾明君, 等. 灵芝多糖在Graves病小鼠模型中对甲亢及甲亢肝脏功能损伤的影响[J]. , 2013, 33(5): 607-. |
| [10] | 黄 融,曹 勤,顾静莉,等. 亚临床甲状腺功能异常与高尿酸血症的临床研究[J]. 上海交通大学学报(医学版), 2013, 33(10): 1348-. |
| [11] | 盛矢薇, 陆汉魁, 陈立波, 等. 分化型甲状腺癌合并甲状腺功能亢进症患者的临床特征及131I清除甲状腺残余组织的疗效[J]. , 2012, 32(1): 82-. |
| [12] | 袁 民, 蒋 莹, 管 樑, 等. 五十营针刺疗法配合穴位注射治疗甲状腺功能减退的疗效观察[J]. , 2010, 30(9): 1156-. |
| [13] | 聂秀利, 蒋 莹, 严惟力, 等. 131I治疗甲状腺Ⅲ度肿大伴甲状腺功能亢进一例报道[J]. , 2010, 30(9): 1081-. |
| [14] | 侯莎莎, 王 辉, 傅宏亮, 等. 影响131I治疗甲状腺功能亢进症疗效的临床多因素分析[J]. , 2010, 30(9): 1055-. |
| 阅读次数 | ||||||
|
全文 |
|
|||||
|
摘要 |
|
|||||
