JOURNAL OF SHANGHAI JIAOTONG UNIVERSITY (MEDICAL SCIENCE) ›› 2021, Vol. 41 ›› Issue (12): 1636-1641.doi: 10.3969/j.issn.1674-8115.2021.12.013
• Clinical research • Previous Articles Next Articles
Ye-zi CHAI( ), Meng JIANG(), Jun PU()
Received:2021-08-04
Online:2021-12-28
Published:2021-01-28
Contact:
Meng JIANG,Jun PU
E-mail:cyz960707@126.com;jiangmeng0919@163.com;pujun310@hotmail.com
Supported by:CLC Number:
Ye-zi CHAI, Meng JIANG, Jun PU. Relation between body mass index and left ventricular structure and function in patients with hypertrophic cardiomyopathy: a cardiovascular magnetic resonance imaging study[J]. JOURNAL OF SHANGHAI JIAOTONG UNIVERSITY (MEDICAL SCIENCE), 2021, 41(12): 1636-1641.
Add to citation manager EndNote|Ris|BibTeX
URL: https://xuebao.shsmu.edu.cn/EN/10.3969/j.issn.1674-8115.2021.12.013
| Indicator | Control group (n=22) | HCM group (n=92) | P value |
|---|---|---|---|
| Age/year | 46 (42, 52) | 53 (43, 61) | 0.077 |
| Female/n(%) | 9 (40.9) | 26 (28.3) | 0.250 |
| BMI/(kg·m-2) | 22.51 (20.06, 25.04) | 26.58 (25.26, 28.70) | 0.000 |
| Clinical feature | |||
| Hypertension/n(%) | 0 (0) | 49 (53.3) | 0.000 |
| Hyperlipidemia/n(%) | 2 (9.1) | 24 (26.1) | 0.088 |
| Smoking/n(%) | 0 (0) | 22 (23.9) | 0.011 |
| Laboratory examination | |||
| TNI/(ng·mL-1) | 0 (0, 0.01) | 0.01 (0, 0.04) | 0.004 |
| BNP/(pg·mL-1) | 17.00 (12.48, 31.50) | 82.50 (33.75, 207.25) | 0.000 |
| Cardiac function classification (NYHA Ⅰ‒Ⅱ)/n(%) | 20 (100.0)① | 80 (100.0)① | 1.000 |
| Concurrent medicine in HCM | |||
| β-blocker/n(%) | 0 (0) | 49 (53.3) | 0.000 |
| ACEI or ARB/n(%) | 0 (0) | 37 (40.2) | 0.000 |
| CCB/n(%) | 0 (0) | 29 (31.5) | 0.000 |
| Diuretics/n(%) | 0 (0) | 16 (17.4) | 0.000 |
Tab 1 Comparison of demographic data and clinical indicators between the HCM group and the control group
| Indicator | Control group (n=22) | HCM group (n=92) | P value |
|---|---|---|---|
| Age/year | 46 (42, 52) | 53 (43, 61) | 0.077 |
| Female/n(%) | 9 (40.9) | 26 (28.3) | 0.250 |
| BMI/(kg·m-2) | 22.51 (20.06, 25.04) | 26.58 (25.26, 28.70) | 0.000 |
| Clinical feature | |||
| Hypertension/n(%) | 0 (0) | 49 (53.3) | 0.000 |
| Hyperlipidemia/n(%) | 2 (9.1) | 24 (26.1) | 0.088 |
| Smoking/n(%) | 0 (0) | 22 (23.9) | 0.011 |
| Laboratory examination | |||
| TNI/(ng·mL-1) | 0 (0, 0.01) | 0.01 (0, 0.04) | 0.004 |
| BNP/(pg·mL-1) | 17.00 (12.48, 31.50) | 82.50 (33.75, 207.25) | 0.000 |
| Cardiac function classification (NYHA Ⅰ‒Ⅱ)/n(%) | 20 (100.0)① | 80 (100.0)① | 1.000 |
| Concurrent medicine in HCM | |||
| β-blocker/n(%) | 0 (0) | 49 (53.3) | 0.000 |
| ACEI or ARB/n(%) | 0 (0) | 37 (40.2) | 0.000 |
| CCB/n(%) | 0 (0) | 29 (31.5) | 0.000 |
| Diuretics/n(%) | 0 (0) | 16 (17.4) | 0.000 |
| Indicator | Control group (n=22) | HCM group (n=92) | P value |
|---|---|---|---|
| LVEF/% | 65.63 (63.88, 68.59) | 71.67 (67.67, 75.52) | 0.001 |
| LVEDV/mL | 136.36 (115.04, 151.50) | 154.95 (133.83, 176.92) | 0.008 |
| LVEDV/BSA/(mL·m-2) | 77.35 (71.40, 87.15) | 83.29 (74.03, 93.27) | 0.329 |
| LVESV/mL | 46.51 (39.21, 51.84) | 42.95 (33.96, 52.61) | 0.409 |
| LVESV/BSA/(mL·m-2) | 27.03 (23.62, 30.85) | 23.45 (18.61, 27.24) | 0.023 |
| SV/mL | 90.26 (77.06, 98.30) | 108.88 (90.70, 124.57) | 0.001 |
| SV/BSA/(mL·m-2) | 51.50 (48.75, 58.53) | 57.89 (50.97, 65.20) | 0.044 |
| CO/(L·min-1) | 5.83 (5.06, 7.12) | 7.15 (6.06, 8.06) | 0.003 |
| LVM/g | 73.23 (59.83, 86.18) | 159.65 (122.75, 190.84) | 0.000 |
| LVMI/(g·m-2) | 43.97 (38.32, 47.47) | 82.52 (68.37, 97.43) | 0.000 |
| GRS/% | 38.21 (34.44, 43.75) | 28.03 (23.87, 34.02) | 0.000 |
| GCS/% | 20.97 (19.78, 22.51) | 16.85 (15.06, 119.21) | 0.000 |
| GLS/% | 15.77 (15.03, 17.22) | 11.43 (9.65, 13.23) | 0.000 |
Tab 2 Comparison of CMR indexes between the HCM group and the control group
| Indicator | Control group (n=22) | HCM group (n=92) | P value |
|---|---|---|---|
| LVEF/% | 65.63 (63.88, 68.59) | 71.67 (67.67, 75.52) | 0.001 |
| LVEDV/mL | 136.36 (115.04, 151.50) | 154.95 (133.83, 176.92) | 0.008 |
| LVEDV/BSA/(mL·m-2) | 77.35 (71.40, 87.15) | 83.29 (74.03, 93.27) | 0.329 |
| LVESV/mL | 46.51 (39.21, 51.84) | 42.95 (33.96, 52.61) | 0.409 |
| LVESV/BSA/(mL·m-2) | 27.03 (23.62, 30.85) | 23.45 (18.61, 27.24) | 0.023 |
| SV/mL | 90.26 (77.06, 98.30) | 108.88 (90.70, 124.57) | 0.001 |
| SV/BSA/(mL·m-2) | 51.50 (48.75, 58.53) | 57.89 (50.97, 65.20) | 0.044 |
| CO/(L·min-1) | 5.83 (5.06, 7.12) | 7.15 (6.06, 8.06) | 0.003 |
| LVM/g | 73.23 (59.83, 86.18) | 159.65 (122.75, 190.84) | 0.000 |
| LVMI/(g·m-2) | 43.97 (38.32, 47.47) | 82.52 (68.37, 97.43) | 0.000 |
| GRS/% | 38.21 (34.44, 43.75) | 28.03 (23.87, 34.02) | 0.000 |
| GCS/% | 20.97 (19.78, 22.51) | 16.85 (15.06, 119.21) | 0.000 |
| GLS/% | 15.77 (15.03, 17.22) | 11.43 (9.65, 13.23) | 0.000 |
| Indicator | Normal BMI group (n=20) | Overweight group (n=43) | Obesity group (n=29) | P value among three group | P value between normal BMI group and overweight group | P value between normal group and obesity group |
|---|---|---|---|---|---|---|
| Age/year | 45 (37, 59) | 57 (49, 61) | 52 (41, 60) | 0.060 | - | - |
| BMI/(kg·m-2) | 21.50 (20.35, 22.34) | 26.33 (25.59, 26.96) | 30.19 (28.73, 31.85) | 0.000 | 0.000 | 0.000 |
| CMR | ||||||
| LVEF/% | 69.44 (65.74, 72.65) | 72.75 (68.28, 76.66) | 71.98 (67.31, 75.32) | 0.210 | - | - |
| LVEDV/mL | 118.62 (101.07, 149.01) | 163.32 (142.49, 177.03) | 169.17 (144.02, 202.72) | 0.000 | 0.000 | 0.000 |
| LVEDV/BSA/(mL·m-2) | 76.92 (62.67, 86.33) | 84.56 (76.70, 96.76) | 82.07 (73.22, 98.33) | 0.140 | - | - |
| LVESV/mL | 35.03 (29.90, 45.43) | 42.94 (34.01, 50.22) | 47.66 (39.48, 58.74) | 0.022 | 0.128 | 0.006 |
| LVESV/BSA/(mL·m-2) | 21.10 (18.62, 27.59) | 23.88 (17.52, 26.78) | 23.95 (19.07, 28.20) | 0.746 | - | - |
| SV/mL | 82.53 (73.48, 101.35) | 114.17 (100.38, 125.98) | 111.88 (100.18, 144.52) | 0.000 | 0.000 | 0.000 |
| SV/BSA/(mL·m-2) | 54.36 (47.25, 59.13) | 59.63 (54.30, 67.56) | 55.07 (48.18, 67.08) | 0.030 | 0.005 | 0.222 |
| CO/(L·min-1) | 5.80 (5.17, 6.26) | 7.45 (6.45, 8.23) | 7.72 (6.83, 8.83) | 0.000 | 0.000 | 0.000 |
| LVM/g | 102.13 (87.70, 127.45) | 158.13 (142.04, 190.90) | 176.42 (162.29, 225.32) | 0.000 | 0.000 | 0.000 |
| LVMI/(g·m-2) | 64.85 (51.67, 74.04) | 85.36 (75.86, 97.40) | 86.22 (77.68, 111.38) | 0.000 | 0.001 | 0.000 |
| GRS/% | 36.43 (26.65, 41.14) | 28.71 (24.27, 32.44)① | 25.69 (20.54, 29.70) | 0.005 | 0.033 | 0.003 |
| GCS/% | 19.60 (15.54, 21.33) | 16.81 (15.50, 18.64)② | 15.70 (13.64, 17.66) | 0.006 | 0.049 | 0.003 |
| GLS/% | 14.17 (11.37, 16.06) | 11.73 (9.83, 13.07)③ | 9.97 (8.62, 11.45) | 0.000 | 0.005 | 0.000 |
Tab 3 Comparison of CMR indexes in patients with HCM between the three BMI subgroups
| Indicator | Normal BMI group (n=20) | Overweight group (n=43) | Obesity group (n=29) | P value among three group | P value between normal BMI group and overweight group | P value between normal group and obesity group |
|---|---|---|---|---|---|---|
| Age/year | 45 (37, 59) | 57 (49, 61) | 52 (41, 60) | 0.060 | - | - |
| BMI/(kg·m-2) | 21.50 (20.35, 22.34) | 26.33 (25.59, 26.96) | 30.19 (28.73, 31.85) | 0.000 | 0.000 | 0.000 |
| CMR | ||||||
| LVEF/% | 69.44 (65.74, 72.65) | 72.75 (68.28, 76.66) | 71.98 (67.31, 75.32) | 0.210 | - | - |
| LVEDV/mL | 118.62 (101.07, 149.01) | 163.32 (142.49, 177.03) | 169.17 (144.02, 202.72) | 0.000 | 0.000 | 0.000 |
| LVEDV/BSA/(mL·m-2) | 76.92 (62.67, 86.33) | 84.56 (76.70, 96.76) | 82.07 (73.22, 98.33) | 0.140 | - | - |
| LVESV/mL | 35.03 (29.90, 45.43) | 42.94 (34.01, 50.22) | 47.66 (39.48, 58.74) | 0.022 | 0.128 | 0.006 |
| LVESV/BSA/(mL·m-2) | 21.10 (18.62, 27.59) | 23.88 (17.52, 26.78) | 23.95 (19.07, 28.20) | 0.746 | - | - |
| SV/mL | 82.53 (73.48, 101.35) | 114.17 (100.38, 125.98) | 111.88 (100.18, 144.52) | 0.000 | 0.000 | 0.000 |
| SV/BSA/(mL·m-2) | 54.36 (47.25, 59.13) | 59.63 (54.30, 67.56) | 55.07 (48.18, 67.08) | 0.030 | 0.005 | 0.222 |
| CO/(L·min-1) | 5.80 (5.17, 6.26) | 7.45 (6.45, 8.23) | 7.72 (6.83, 8.83) | 0.000 | 0.000 | 0.000 |
| LVM/g | 102.13 (87.70, 127.45) | 158.13 (142.04, 190.90) | 176.42 (162.29, 225.32) | 0.000 | 0.000 | 0.000 |
| LVMI/(g·m-2) | 64.85 (51.67, 74.04) | 85.36 (75.86, 97.40) | 86.22 (77.68, 111.38) | 0.000 | 0.001 | 0.000 |
| GRS/% | 36.43 (26.65, 41.14) | 28.71 (24.27, 32.44)① | 25.69 (20.54, 29.70) | 0.005 | 0.033 | 0.003 |
| GCS/% | 19.60 (15.54, 21.33) | 16.81 (15.50, 18.64)② | 15.70 (13.64, 17.66) | 0.006 | 0.049 | 0.003 |
| GLS/% | 14.17 (11.37, 16.06) | 11.73 (9.83, 13.07)③ | 9.97 (8.62, 11.45) | 0.000 | 0.005 | 0.000 |
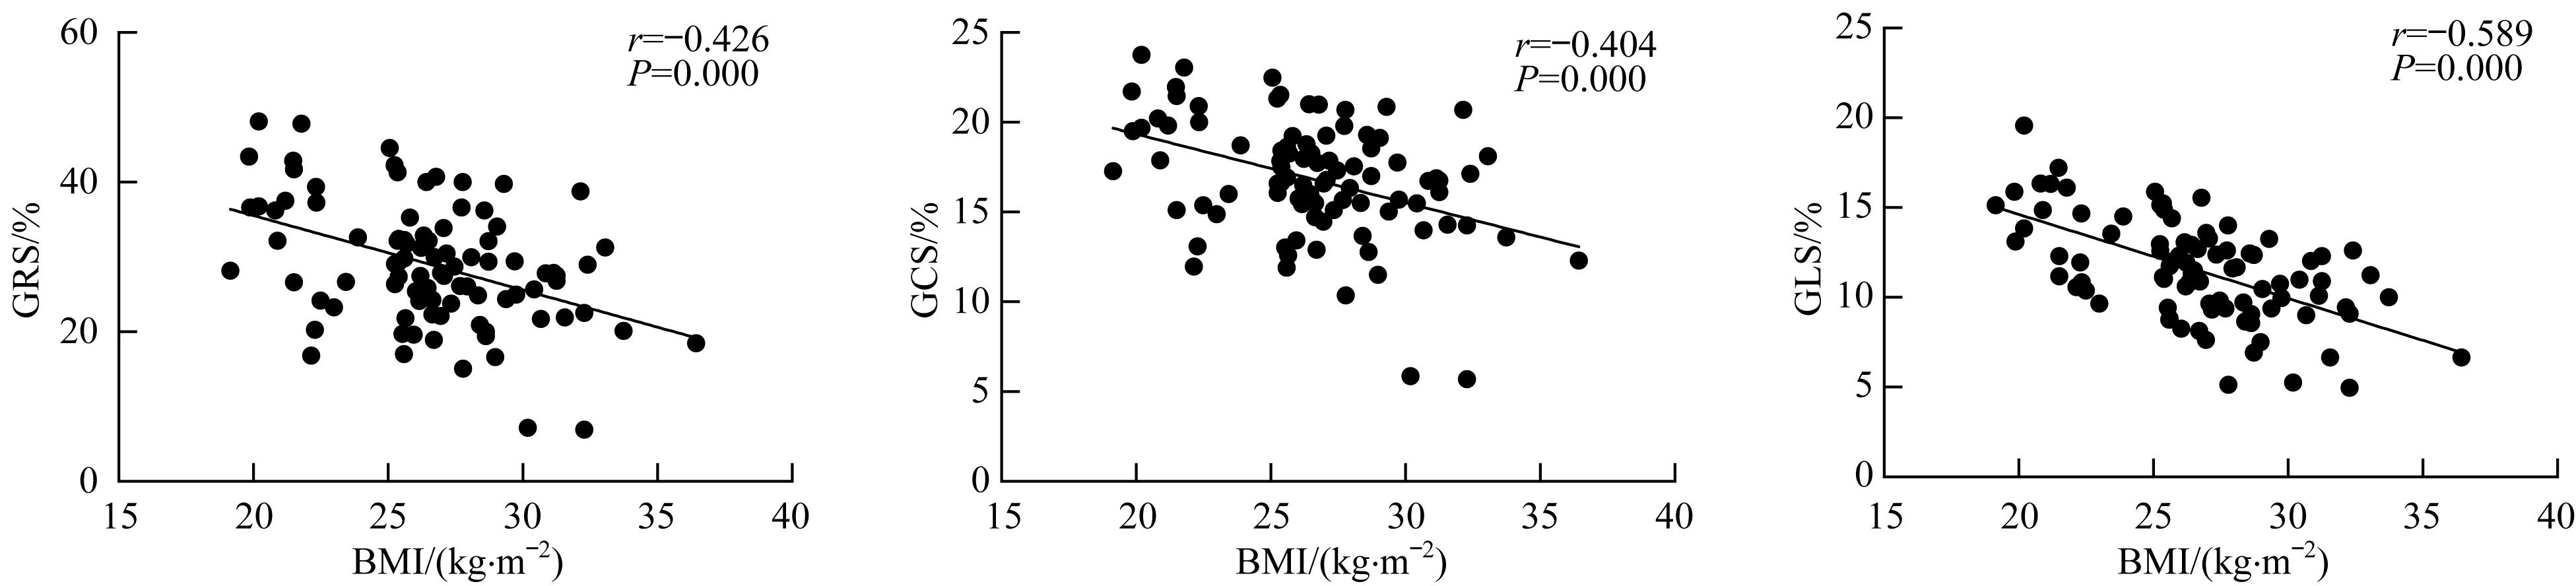
Fig 1 Correlation between BMI and global strain of left ventricle in the HCM group
| Indicator | Unstandardized β | SE | Standardized β | t value | P value |
|---|---|---|---|---|---|
| Gender | 1.106 | 0.480 | 0.179 | 2.306 | 0.023 |
| BMI | -0.343 | 0.066 | -0.431 | -5.215 | 0.000 |
| LVMI | -0.040 | 0.010 | -0.342 | -4.163 | 0.000 |
Tab 4 Multivariable linear regression analysis of clinical features and GLS in the HCM group
| Indicator | Unstandardized β | SE | Standardized β | t value | P value |
|---|---|---|---|---|---|
| Gender | 1.106 | 0.480 | 0.179 | 2.306 | 0.023 |
| BMI | -0.343 | 0.066 | -0.431 | -5.215 | 0.000 |
| LVMI | -0.040 | 0.010 | -0.342 | -4.163 | 0.000 |
| 1 | Maron BJ, Maron MS. Hypertrophic cardiomyopathy[J]. Lancet, 2013, 381(9862): 242-255. |
| 2 | Powell-Wiley TM, Poirier P, Burke LE, et al. Obesity and cardiovascular disease: a scientific statement from the American Heart Association[J]. Circulation, 2021, 143(21): e984-e1010. |
| 3 | Ortega FB, Lavie CJ, Blair SN. Obesity and cardiovascular disease[J]. Circ Res, 2016, 118(11): 1752-1770. |
| 4 | Hubert HB, Feinleib M, McNamara PM, et al. Obesity as an independent risk factor for cardiovascular disease: a 26-year follow-up of participants in the Framingham Heart Study[J]. Circulation, 1983, 67(5): 968-977. |
| 5 | Antonopoulos AS, Oikonomou EK, Antoniades C, et al. From the BMI paradox to the obesity paradox: the obesity-mortality association in coronary heart disease[J]. Obes Rev, 2016, 17(10): 989-1000. |
| 6 | Hainer V, Aldhoon-Hainerová I. Obesity paradox does exist[J]. Diabetes Care, 2013, 36(): S276-S281. |
| 7 | Lavie CJ, Ventura HO. The obesity paradox in heart failure: is it all about fitness, fat, or sex? [J]. JACC Heart Fail, 2015, 3(11): 927-930. |
| 8 | 中国超重/肥胖医学营养治疗专家共识编写委员会. 中国超重/肥胖医学营养治疗专家共识(2016年版)[J]. 糖尿病天地(临床), 2016, 10(10): 451-455. |
| 9 | World Health Organization. Regional Office for the Western Pacific. Overweight and obesity in the Western Pacific Region: an equity perspective[DB/OL]. [2021-07-30]. . |
| 10 | Ma S, Xi B, Yang L, et al. Trends in the prevalence of overweight, obesity, and abdominal obesity among Chinese adults between 1993 and 2015[J]. Int J Obes (Lond), 2021, 45(2): 427-437. |
| 11 | Wade KH, Chiesa ST, Hughes AD, et al. Assessing the causal role of body mass index on cardiovascular health in young adults: Mendelian randomization and recall-by-genotype analyses[J]. Circulation, 2018, 138(20): 2187-2201. |
| 12 | Lavie CJ, De Schutter A, Parto P, et al. Obesity and prevalence of cardiovascular diseases and prognosis: the obesity paradox updated[J]. Prog Cardiovasc Dis, 2016, 58(5): 537-547. |
| 13 | Shah RV, Murthy VL, Abbasi SA, et al. Weight loss and progressive left ventricular remodelling: the Multi-Ethnic Study of Atherosclerosis (MESA)[J]. Eur J Prev Cardiol, 2015, 22(11): 1408-1418. |
| 14 | Rider OJ, Lewandowski A, Nethononda R, et al. Gender-specific differences in left ventricular remodelling in obesity: insights from cardiovascular magnetic resonance imaging[J]. Eur Heart J, 2013, 34(4): 292-299. |
| 15 | Grassi G, Dell′Oro R, Facchini A, et al. Effect of central and peripheral body fat distribution on sympathetic and baroreflex function in obese normotensives[J]. J Hypertens, 2004, 22(12): 2363-2369. |
| 16 | Lauer MS, Anderson KM, Kannel WB, et al. The impact of obesity on left ventricular mass and geometry. The Framingham Heart Study[J]. JAMA, 1991, 266(2): 231-236. |
| 17 | Muhib S, Fujino T, Sato N, et al. Epicardial adipose tissue is associated with prevalent atrial fibrillation in patients with hypertrophic cardiomyopathy[J]. Int Heart J, 2013, 54(5): 297-303. |
| 18 | Obokata M, Nagata Y, Wu VC, et al. Direct comparison of cardiac magnetic resonance feature tracking and 2D/3D echocardiography speckle tracking for evaluation of global left ventricular strain[J]. Eur Heart J Cardiovasc Imaging, 2016, 17(5): 525-532. |
| 19 | 陈玄祖, 罗太阳, 戴天医, 等. 肥胖和超重对冠状动脉粥样硬化性心脏病患者左心室结构和功能的影响[J]. 中国医药, 2017, 12(1): 33-36. |
| 20 | Taylor RJ, Moody WE, Umar F, et al. Myocardial strain measurement with feature-tracking cardiovascular magnetic resonance: normal values[J]. Eur Heart J Cardiovasc Imaging, 2015, 16(8): 871-881. |
| 21 | Hinojar R, Fernández-Golfín C, González-Gómez A, et al. Prognostic implications of global myocardial mechanics in hypertrophic cardiomyopathy by cardiovascular magnetic resonance feature tracking. Relations to left ventricular hypertrophy and fibrosis[J]. Int J Cardiol, 2017, 249: 467-472. |
| 22 | 王姿, 冯泽豪, 武睿, 等. 心肌肥厚性疾病的心肌环周应变与左心室功能的相关性[J]. 中国医学影像学杂志, 2018, 26(5): 341-346. |
| 23 | Pichard AD, Gorlin R, Smith H, et al. Coronary flow studies in patients with left ventricular hypertrophy of the hypertensive type: evidence for an impaired coronary vascular reserve[J]. Am J Cardiol, 1981, 47(3): 547-554. |
| 24 | Mundhenke M, Schwartzkopff B, Strauer BE. Structural analysis of arteriolar and myocardial remodelling in the subendocardial region of patients with hypertensive heart disease and hypertrophic cardiomyopathy[J]. Virchows Arch, 1997, 431(4): 265-273. |
| 25 | Voilliot D, Huttin O, Hammache N, et al. Impact of global and segmental hypertrophy on two-dimensional strain derived from three-dimensional echocardiography in hypertrophic cardiomyopathy: comparison with healthy subjects[J]. J Am Soc Echocardiogr, 2015, 28(9): 1093-1102. |
| 26 | Sellers SL, Fonte TA, Grover R, et al. Hypertrophic cardiomyopathy (HCM): new insights into coronary artery remodelling and ischemia from FFRCT[J]. J Cardiovasc Comput Tomogr, 2018, 12(6): 467-471. |
| 27 | Kalam K, Otahal P, Marwick TH. Prognostic implications of global LV dysfunction: a systematic review and meta-analysis of global longitudinal strain and ejection fraction[J]. Heart, 2014, 100(21): 1673-1680. |
| [1] | JIN Bu, CHEN Hanzhang, XU Hudong, CHEN Wanyu, YUAN Ying, ZHAO Tingting, HUANG Xiaolei, HE Jialu, YU Hong. Study on the mechanism of trimethylamine oxide damaging cardiac function in mice with hypertrophic cardiomyopathy [J]. Journal of Shanghai Jiao Tong University (Medical Science), 2024, 44(3): 325-333. |
| [2] | JIANG Ying, LI Qingyao, CHEN Zhiqi, WANG Jialu, LI Yun, XU Renying. Association between body mass index and chronic metabolic diseases in Chinese aged population [J]. Journal of Shanghai Jiao Tong University (Medical Science), 2024, 44(2): 250-257. |
| [3] | LIU Qiming, LU Qifan, CHAI Yezi, JIANG Meng, PU Jun. Short-axis cine cardiac magnetic resonance images-derived radiomics for hypertrophic cardiomyopathy and healthy control classification [J]. Journal of Shanghai Jiao Tong University (Medical Science), 2024, 44(1): 79-86. |
| [4] | Ze-hao FENG, Ye-zi CHAI, Xuan SU, Bao-hang-xing SUN, Qi-ming LIU, Meng JIANG, Jun PU. Association between body mass index and myocardial involvements in patients with systemic lupus erythematosus [J]. JOURNAL OF SHANGHAI JIAOTONG UNIVERSITY (MEDICAL SCIENCE), 2021, 41(2): 180-186. |
| [5] | Ye-zi CHAI, Jun MA, Wen-long JIANG, Qi-ming LIU, Qi-fan LU, Zheng-yu TAO, Meng JIANG, Jun PU. Assessment of cardiopulmonary exercise capacity in early stage of patients with breast cancer undergoing neoadjuvant chemotherapy and related factors [J]. JOURNAL OF SHANGHAI JIAOTONG UNIVERSITY (MEDICAL SCIENCE), 2021, 41(12): 1643-1648. |
| [6] | Ya-jie GAO, Wen-kun MA, Cheng-jie GAO, Yi ZHOU, Jing-wei PAN. Exploration of the predictive value of myocardial strain on ventricular remodeling after acute ST-segment elevation myocardial infarction [J]. JOURNAL OF SHANGHAI JIAOTONG UNIVERSITY (MEDICAL SCIENCE), 2021, 41(11): 1478-1484. |
| [7] | JIANG Xun-wei, SUN Xing-hua, ZHANG Han, XIAO Ting-ting, ZHANG Yong-wei, XIE Li-jian. Change of left ventricular torsion function and systolic synchronization in children with hypertrophic cardiomyopathy [J]. JOURNAL OF SHANGHAI JIAOTONG UNIVERSITY (MEDICAL SCIENCE), 2020, 40(7): 929-935. |
| [8] | HU Xu-lin, CHEN Yan, XIA Hong-ping, ZHANG Yong-jun. Analysis of maternal clinical risk factors for different degrees of small for gestational age infant [J]. , 2020, 40(4): 489-. |
| [9] | WANG Dan-dan, WANG Ye-wei, FANG Xin-yu, CHEN Yan, YU Ling-fang, ZHANG Chen. Meta-analysis of topiramate to improve body weight increase causedatypical antipsychotic drugs [J]. , 2020, 40(2): 200-. |
| [10] | CHAO Hui-juan, MA Jin, TANG Bi-wen, HU Yue-liang, WANG Qian, XUAN Yan, ZUO Jun-li. Relationship between body mass index and central haemodynamic indices [J]. , 2019, 39(12): 1422-. |
| [11] | XU Ren-ying, ZHOU Yi-quan, LI Yun, ZHANG Xiao-min, CHEN Zhi-qi, LU Li-ping, WAN Yan-ping. Impact of one-child on body mass index and percentage of body fat in primary school students: a longitudinal study#br# [J]. , 2017, 37(12): 1691-. |
| Viewed | ||||||
|
Full text |
|
|||||
|
Abstract |
|
|||||