
Journal of Shanghai Jiao Tong University (Medical Science) ›› 2026, Vol. 46 ›› Issue (10): 1366-1374.doi: 10.3969/j.issn.1674-8115.2026.10.006
• Clinical research • Previous Articles
Gong Yuwei, Zhang Yihan, Li Bingxin, Feng Xiaoyun, Xu Huanbai, Liu Fang, Wang Yufan, Peng Yongde, Chen Ruihua( )
Received:2025-11-26
Accepted:2026-05-25
Online:2026-10-28
Published:2026-10-28
Contact:
Chen Ruihua
E-mail:7240020128@shsmu.edu.cn
Supported by:CLC Number:
Gong Yuwei, Zhang Yihan, Li Bingxin, Feng Xiaoyun, Xu Huanbai, Liu Fang, Wang Yufan, Peng Yongde, Chen Ruihua. Incidence and clinical characteristics changes of Long COVID in patients with hypothyroidism[J]. Journal of Shanghai Jiao Tong University (Medical Science), 2026,(10): 1366-1374.
Add to citation manager EndNote|Ris|BibTeX
URL: https://xuebao.shsmu.edu.cn/EN/10.3969/j.issn.1674-8115.2026.10.006
| Group | Age/year | Male/n(%) | Alcohol/n(%) | Smoking/n(%) | BMI/(kg·m-2) | Hyperlipidemia/n(%) | Obesity/n(%) |
|---|---|---|---|---|---|---|---|
| L (n=77) | 48.49±14.14 | 17 (22.1) | 20 (26.0) | 24 (31.2) | 23.85±3.22 | 26 (33.8) | 9 (11.7) |
| NL (n=36) | 46.83±16.35 | 11 (30.6) | 5 (13. 9) | 9 (25.0) | 23.12±3.14 | 3 (8.3) | 3 (8.3) |
| χ2 /t value | -0.553 | 0.946 | 2.079 | 0.452 | -1.125 | 7.038 | 0.045 |
| P value | 0.581 | 0.331 | 0.149 | 0.502 | 0.263 | 0.008 | 0.832 |
| HL (n=33) | 48.45±13.39 | 7 (21.2) | 6 (18.2) | 7 (21.2) | 24.46±3.44 | 9 (27.3) | 6 (18.2) |
| NHL (n=44) | 48.52±14.83 | 10 (22.7) | 14 (31.8) | 17 (38.6) | 23.39±3.00 | 17 (38.6) | 3 (6.8) |
| HNL (n=20) | 45.7±16.95 | 7 (35.0) | 3 (15.0) | 4 (20.0) | 22.57±3.02 | 1 (5.0) | 1 (5.0) |
| NNL (n=16) | 48.25±15.99 | 4 (25.0) | 2 (12.5) | 5 (31.3) | 23.82±3.25 | 2 (12.5) | 2 (12.5) |
| χ2 /F value | 0.186 | 1.446 | 3.638 | 3.765 | 1.613 | 9.918 | 3.118 |
| P value | 0.906 | 0.725 | 0.300 | 0.290 | 0.190 | 0.017 | 0.385 |
Tab 1 Baseline characteristics and comorbidities of the patients
| Group | Age/year | Male/n(%) | Alcohol/n(%) | Smoking/n(%) | BMI/(kg·m-2) | Hyperlipidemia/n(%) | Obesity/n(%) |
|---|---|---|---|---|---|---|---|
| L (n=77) | 48.49±14.14 | 17 (22.1) | 20 (26.0) | 24 (31.2) | 23.85±3.22 | 26 (33.8) | 9 (11.7) |
| NL (n=36) | 46.83±16.35 | 11 (30.6) | 5 (13. 9) | 9 (25.0) | 23.12±3.14 | 3 (8.3) | 3 (8.3) |
| χ2 /t value | -0.553 | 0.946 | 2.079 | 0.452 | -1.125 | 7.038 | 0.045 |
| P value | 0.581 | 0.331 | 0.149 | 0.502 | 0.263 | 0.008 | 0.832 |
| HL (n=33) | 48.45±13.39 | 7 (21.2) | 6 (18.2) | 7 (21.2) | 24.46±3.44 | 9 (27.3) | 6 (18.2) |
| NHL (n=44) | 48.52±14.83 | 10 (22.7) | 14 (31.8) | 17 (38.6) | 23.39±3.00 | 17 (38.6) | 3 (6.8) |
| HNL (n=20) | 45.7±16.95 | 7 (35.0) | 3 (15.0) | 4 (20.0) | 22.57±3.02 | 1 (5.0) | 1 (5.0) |
| NNL (n=16) | 48.25±15.99 | 4 (25.0) | 2 (12.5) | 5 (31.3) | 23.82±3.25 | 2 (12.5) | 2 (12.5) |
| χ2 /F value | 0.186 | 1.446 | 3.638 | 3.765 | 1.613 | 9.918 | 3.118 |
| P value | 0.906 | 0.725 | 0.300 | 0.290 | 0.190 | 0.017 | 0.385 |
| Group | T>38 ℃/n(%) | Loss or reduction of smell and taste /n(%) | Myalgia/n(%) | Chest tightness/n(%) | Nausea/n(%) | Vomiting/n(%) |
|---|---|---|---|---|---|---|
| L (n=77) | 58 (75.3) | 32 (41.6) | 44 (57.1) | 39 (50.6) | 34 (44.2) | 27 (35.1) |
| NL (n=36) | 21 (58.3) | 5 (13.9) | 10 (27.8) | 11 (30.6) | 7 (19.4) | 6 (16.7) |
| χ² value | 3.367 | 8.528 | 8.478 | 4.015 | 6.480 | 4.016 |
| P value | 0.067 | 0.003 | 0.004 | 0.045 | 0.011 | 0.045 |
| HL (n=33) | 21 (63.6 ) | 19 (57.6)② | 17 (51.5) | 16 (48.5) | 17 (51.5) | 12 (36.4) |
| NHL (n=44) | 37 (84.1 )① | 13 (29.5) | 27 (61.4) | 23 (52.3)① | 17 (38.6)① | 15 (34.1)① |
| HNL (n=20) | 13 (65.0 ) | 4 (20.0) | 4 (20.0) | 9 (45.0) | 7 (35.0) | 6 (30.0 ) |
| NNL (n=16) | 8 (50.0 ) | 1 (6.3) | 6 (37.5) | 2 (12.5) | 0 (0) | 0 (0) |
| χ² value | 8.068 | 15.648 | 10.302 | 7.931 | 14.709 | 9.568 |
| P value | 0.044 | 0.001 | 0.016 | 0.049 | 0.002 | 0.021 |
Tab 2 Symptoms at the time of COVID-19 diagnosis
| Group | T>38 ℃/n(%) | Loss or reduction of smell and taste /n(%) | Myalgia/n(%) | Chest tightness/n(%) | Nausea/n(%) | Vomiting/n(%) |
|---|---|---|---|---|---|---|
| L (n=77) | 58 (75.3) | 32 (41.6) | 44 (57.1) | 39 (50.6) | 34 (44.2) | 27 (35.1) |
| NL (n=36) | 21 (58.3) | 5 (13.9) | 10 (27.8) | 11 (30.6) | 7 (19.4) | 6 (16.7) |
| χ² value | 3.367 | 8.528 | 8.478 | 4.015 | 6.480 | 4.016 |
| P value | 0.067 | 0.003 | 0.004 | 0.045 | 0.011 | 0.045 |
| HL (n=33) | 21 (63.6 ) | 19 (57.6)② | 17 (51.5) | 16 (48.5) | 17 (51.5) | 12 (36.4) |
| NHL (n=44) | 37 (84.1 )① | 13 (29.5) | 27 (61.4) | 23 (52.3)① | 17 (38.6)① | 15 (34.1)① |
| HNL (n=20) | 13 (65.0 ) | 4 (20.0) | 4 (20.0) | 9 (45.0) | 7 (35.0) | 6 (30.0 ) |
| NNL (n=16) | 8 (50.0 ) | 1 (6.3) | 6 (37.5) | 2 (12.5) | 0 (0) | 0 (0) |
| χ² value | 8.068 | 15.648 | 10.302 | 7.931 | 14.709 | 9.568 |
| P value | 0.044 | 0.001 | 0.016 | 0.049 | 0.002 | 0.021 |
| Variables | L group (n=77) | NL group (n=36) | z/t value | P value | HLgroup (n=33) | NHL group (n=44) | HNL group (n=20) | NNL group (n=16) | F/H value | P value |
|---|---|---|---|---|---|---|---|---|---|---|
| Levothyroxine dose/μg | 50.00 (43.75,87.50) | 62.50 (50.00,100.00) | -2.523 | 0.012 | 50.00 (37.50,81.25) | 50.00 (43.75,87.50) | 68.75 (50.00,187.50) | 62.50 (50.00,100.00) | 7.020 | 0.071 |
| TT4/(nmol·L-1) | 116.44 (99.89,131.81) | 129.18 (98.77,140.20) | -1.078 | 0.281 | 121.19 (94.13,137.94) | 114.80 (101.07,130.16) | 131.17 (82.90,146.22) | 126.41 (106.93,132.05) | 1.248 | 0.742 |
| FT3/(pmol·L-1) | 5.15 (4.39,6.53) | 5.41 (4.15,7.67) | -0.838 | 0.402 | 5.24 (4.47,6.53) | 4.96 (4.37,6.58) | 6.49 (4.39,8.42) | 4.82 (4.15,6.03) | 4.815 | 0.186 |
| FT4/(pmol·L-1) | 15.55 (12.98,19.16) | 17.13 (13.56,22.35) | -1.564 | 0.118 | 14.49 (12.60,18.63) | 16.00 (14.02,19.54) | 17.47 (13.33,22.50) | 16.64 (13.56,19.33) | 3.998 | 0.262 |
| TSH/(μIU·mL-1) | 1.54 (0.43,4.14) | 2.03 (0.39,3.64) | -0.124 | 0.901 | 2.91 (0.64,4.59) | 1.05 (0.41,2.69) | 2.00 (0.35,3.95) | 2.24 (0.76,3.43) | 4.832 | 0.185 |
| TPOAb/(IU·mL-1) | 16.50 (8.67,139.50) | 77.65 (8.46,297.00) | -1.198 | 0.231 | 210.00 (77.40,384.50) | 9.00 (8.28,11.08) | 237.50 (143.25,529.82) | 8.28 (8.28,9.00) | 85.582 | <0.001 |
| TGAb/(IU·mL-1) | 15.00 (12.70,64.60) | 24.85 (12.85,211.00) | -0.635 | 0.525 | 179.00 (37.60,675.66) | 12.85 (12.10,14.43) | 207.50 (32.25,306.25) | 12.63 (11.53,13.98) | 59.556 | <0.001 |
| Tg/(ng·mL-1) | 3.06 (0.22,19.82) | 9.64 (1.64,60.65) | -1.657 | 0.097 | 2.39 (0.20,25.48) | 4.00 (0.33,14.85) | 18.15 (1.65,64.93) | 5.50 (1.04,26.42) | 3.268 | 0.352 |
| TSHI | 2.70 (1.75,3.22) | 2.74 (1.98,3.30) | -0.718 | 0.473 | 2.93 (2.00,3.47) | 2.17 (1.51,3.09) | 2.70 (1.98,3.27) | 2.76 (1.98,3.82) | 4.819 | 0.186 |
| TT4RI | 25.02 (7.88,53.19) | 32.34 (7.88,51.21) | -0.570 | 0.568 | 42.77 (12.42,62.56) | 15.68 (7.21,45.28) | 32.34 (7.88,48.45) | 34.36 (11.57,58.10) | 5.858 | 0.119 |
| FT3/FT4 | 0.34 (0.29,0.39) | 0.35 (0.26,0.38) | -0.228 | 0.820 | 0.36 (0.30,0.40) | 0.34 (0.28,0.40) | 0.38 (0.30,0.40) | 0.35 (0.24,0.36) | 3.814 | 0.282 |
| ESR/(mm·h-1) | 12.00 (5.21,20.37) | 6.95 (3.10,13.73) | -2.294 | 0.022 | 15.00 (5.57,21.93) | 10.62 (5.00,16.16) | 6.28 (3.00,14.48) | 9.05 (4.11,13.55) | 5.826 | 0.120 |
| Hb/(g·L-1) | 137.44±16.19 | 135.92±23.33 | -0.354 | 0.725 | 138.00 (129.00,151.00) | 134.01 (126.00,141.75) | 139.50 (113.50,158.00) | 133.50 (128.00,150.25) | 1.311 | 0.726 |
| PLT/(×109·L-1) | 240.88±68.49 | 235.17±68.32 | -0.413 | 0.680 | 252.80±69.88 | 231.93±66.83 | 232.50±48.92 | 238.51±88.52 | 0.663 | 0.576 |
| Cr/(μmol·L-1) | 58.00 (49.60,67.69) | 63.20 (51.83,89.79) | -1.818 | 0.069 | 60.30 (47.85,68.84) | 57.90 (52.60,67.69) | 65.05 (53.97,92.36) | 61.05 (49.60,75.95) | 4.215 | 0.239 |
| UA/(μmol·L-1) | 298.84 (240.30,353.41) | 342.05 (265.60,407.48) | -1.750 | 0.080 | 298.84 (239.55,387.80) | 296.90 (240.23,343.78) | 372.37 (274.60,455.75) | 301.55 (259.90,388.01) | 4.068 | 0.254 |
Tab 3 Baseline thyroid function, levothyroxine dose, and other laboratory parameters of the patients
| Variables | L group (n=77) | NL group (n=36) | z/t value | P value | HLgroup (n=33) | NHL group (n=44) | HNL group (n=20) | NNL group (n=16) | F/H value | P value |
|---|---|---|---|---|---|---|---|---|---|---|
| Levothyroxine dose/μg | 50.00 (43.75,87.50) | 62.50 (50.00,100.00) | -2.523 | 0.012 | 50.00 (37.50,81.25) | 50.00 (43.75,87.50) | 68.75 (50.00,187.50) | 62.50 (50.00,100.00) | 7.020 | 0.071 |
| TT4/(nmol·L-1) | 116.44 (99.89,131.81) | 129.18 (98.77,140.20) | -1.078 | 0.281 | 121.19 (94.13,137.94) | 114.80 (101.07,130.16) | 131.17 (82.90,146.22) | 126.41 (106.93,132.05) | 1.248 | 0.742 |
| FT3/(pmol·L-1) | 5.15 (4.39,6.53) | 5.41 (4.15,7.67) | -0.838 | 0.402 | 5.24 (4.47,6.53) | 4.96 (4.37,6.58) | 6.49 (4.39,8.42) | 4.82 (4.15,6.03) | 4.815 | 0.186 |
| FT4/(pmol·L-1) | 15.55 (12.98,19.16) | 17.13 (13.56,22.35) | -1.564 | 0.118 | 14.49 (12.60,18.63) | 16.00 (14.02,19.54) | 17.47 (13.33,22.50) | 16.64 (13.56,19.33) | 3.998 | 0.262 |
| TSH/(μIU·mL-1) | 1.54 (0.43,4.14) | 2.03 (0.39,3.64) | -0.124 | 0.901 | 2.91 (0.64,4.59) | 1.05 (0.41,2.69) | 2.00 (0.35,3.95) | 2.24 (0.76,3.43) | 4.832 | 0.185 |
| TPOAb/(IU·mL-1) | 16.50 (8.67,139.50) | 77.65 (8.46,297.00) | -1.198 | 0.231 | 210.00 (77.40,384.50) | 9.00 (8.28,11.08) | 237.50 (143.25,529.82) | 8.28 (8.28,9.00) | 85.582 | <0.001 |
| TGAb/(IU·mL-1) | 15.00 (12.70,64.60) | 24.85 (12.85,211.00) | -0.635 | 0.525 | 179.00 (37.60,675.66) | 12.85 (12.10,14.43) | 207.50 (32.25,306.25) | 12.63 (11.53,13.98) | 59.556 | <0.001 |
| Tg/(ng·mL-1) | 3.06 (0.22,19.82) | 9.64 (1.64,60.65) | -1.657 | 0.097 | 2.39 (0.20,25.48) | 4.00 (0.33,14.85) | 18.15 (1.65,64.93) | 5.50 (1.04,26.42) | 3.268 | 0.352 |
| TSHI | 2.70 (1.75,3.22) | 2.74 (1.98,3.30) | -0.718 | 0.473 | 2.93 (2.00,3.47) | 2.17 (1.51,3.09) | 2.70 (1.98,3.27) | 2.76 (1.98,3.82) | 4.819 | 0.186 |
| TT4RI | 25.02 (7.88,53.19) | 32.34 (7.88,51.21) | -0.570 | 0.568 | 42.77 (12.42,62.56) | 15.68 (7.21,45.28) | 32.34 (7.88,48.45) | 34.36 (11.57,58.10) | 5.858 | 0.119 |
| FT3/FT4 | 0.34 (0.29,0.39) | 0.35 (0.26,0.38) | -0.228 | 0.820 | 0.36 (0.30,0.40) | 0.34 (0.28,0.40) | 0.38 (0.30,0.40) | 0.35 (0.24,0.36) | 3.814 | 0.282 |
| ESR/(mm·h-1) | 12.00 (5.21,20.37) | 6.95 (3.10,13.73) | -2.294 | 0.022 | 15.00 (5.57,21.93) | 10.62 (5.00,16.16) | 6.28 (3.00,14.48) | 9.05 (4.11,13.55) | 5.826 | 0.120 |
| Hb/(g·L-1) | 137.44±16.19 | 135.92±23.33 | -0.354 | 0.725 | 138.00 (129.00,151.00) | 134.01 (126.00,141.75) | 139.50 (113.50,158.00) | 133.50 (128.00,150.25) | 1.311 | 0.726 |
| PLT/(×109·L-1) | 240.88±68.49 | 235.17±68.32 | -0.413 | 0.680 | 252.80±69.88 | 231.93±66.83 | 232.50±48.92 | 238.51±88.52 | 0.663 | 0.576 |
| Cr/(μmol·L-1) | 58.00 (49.60,67.69) | 63.20 (51.83,89.79) | -1.818 | 0.069 | 60.30 (47.85,68.84) | 57.90 (52.60,67.69) | 65.05 (53.97,92.36) | 61.05 (49.60,75.95) | 4.215 | 0.239 |
| UA/(μmol·L-1) | 298.84 (240.30,353.41) | 342.05 (265.60,407.48) | -1.750 | 0.080 | 298.84 (239.55,387.80) | 296.90 (240.23,343.78) | 372.37 (274.60,455.75) | 301.55 (259.90,388.01) | 4.068 | 0.254 |
| Variables | HL group (n=33) | NHL group (n=44) | χ²/t value | P value |
|---|---|---|---|---|
| Fatigue/n(%) | 22 (66.7) | 29 (65.9) | 0.005 | 0.945 |
| Headache and dizziness/n(%) | 23 (69.7) | 15 (34.1) | 9.564 | 0.002 |
| Shortness of breath/n(%) | 14 (42.4) | 17 (38.6) | 0.112 | 0.737 |
| Memory decline/n(%) | 18 (54.5) | 27 (61.4) | 0.361 | 0.548 |
| Brain fog/n(%) | 19 (57.6) | 15 (34.1) | 4.218 | 0.040 |
| Motor function decline/n(%) | 22 (66.7) | 29 (65.9) | 0.005 | 0.945 |
| Palpitations/n(%) | 19 (57.6) | 22 (50.0) | 0.435 | 0.510 |
| Taste alteration/n(%) | 6 (18.2) | 12 (27.3) | 0.87 | 0.351 |
| Olfactory changes/n(%) | 1 (3.0) | 4 (9.1) | 0.361 | 0.548 |
| Chest pain/n(%) | 12 (36.4) | 10 (22.7) | 1.718 | 0.190 |
| Muscle or joint pain/n(%) | 16 (48.5) | 14 (31.8) | 2.203 | 0.138 |
| Sleep disturbance/n(%) | 7 (21.2) | 16 (36.4) | 2.067 | 0.151 |
| Depressive state/n(%) | 4 (12.1) | 12 (27.3) | 1.790 | 0.181 |
| Anxiety state /n(%) | 9 (27.3) | 9 (20.5) | 0.489 | 0.484 |
| Thirst/n(%) | 15 (45.5) | 20 (45.5) | 0.000 | >0.999 |
| Vertigo/n(%) | 17 (51.5) | 16 (36.4) | 1.768 | 0.184 |
| Lymphadenopathy/n(%) | 10 (30.3) | 34 (22.7) | 0.563 | 0.453 |
| Chills/n(%) | 18 (54.5) | 16 (36.4) | 2.528 | 0.112 |
| Cough with sputum/n(%) | 14 (42.4) | 12 (27.3) | 1.936 | 0.164 |
| Sneezing/n(%) | 12 (36.4) | 14 (31.8) | 0.174 | 0.676 |
| Gastrointestinal discomfort/n(%) | 15 (45.5) | 15 (34.1) | 1.024 | 0.312 |
| Increased hair loss/n(%) | 20 (60.6) | 22 (50.0) | 0.856 | 0.355 |
| Number of symptoms | 9.48±4.60 | 8.09±4.35 | -1.359 | 0.178 |
Tab 4 Comparison of Long COVID symptoms between the HL and NHL groups
| Variables | HL group (n=33) | NHL group (n=44) | χ²/t value | P value |
|---|---|---|---|---|
| Fatigue/n(%) | 22 (66.7) | 29 (65.9) | 0.005 | 0.945 |
| Headache and dizziness/n(%) | 23 (69.7) | 15 (34.1) | 9.564 | 0.002 |
| Shortness of breath/n(%) | 14 (42.4) | 17 (38.6) | 0.112 | 0.737 |
| Memory decline/n(%) | 18 (54.5) | 27 (61.4) | 0.361 | 0.548 |
| Brain fog/n(%) | 19 (57.6) | 15 (34.1) | 4.218 | 0.040 |
| Motor function decline/n(%) | 22 (66.7) | 29 (65.9) | 0.005 | 0.945 |
| Palpitations/n(%) | 19 (57.6) | 22 (50.0) | 0.435 | 0.510 |
| Taste alteration/n(%) | 6 (18.2) | 12 (27.3) | 0.87 | 0.351 |
| Olfactory changes/n(%) | 1 (3.0) | 4 (9.1) | 0.361 | 0.548 |
| Chest pain/n(%) | 12 (36.4) | 10 (22.7) | 1.718 | 0.190 |
| Muscle or joint pain/n(%) | 16 (48.5) | 14 (31.8) | 2.203 | 0.138 |
| Sleep disturbance/n(%) | 7 (21.2) | 16 (36.4) | 2.067 | 0.151 |
| Depressive state/n(%) | 4 (12.1) | 12 (27.3) | 1.790 | 0.181 |
| Anxiety state /n(%) | 9 (27.3) | 9 (20.5) | 0.489 | 0.484 |
| Thirst/n(%) | 15 (45.5) | 20 (45.5) | 0.000 | >0.999 |
| Vertigo/n(%) | 17 (51.5) | 16 (36.4) | 1.768 | 0.184 |
| Lymphadenopathy/n(%) | 10 (30.3) | 34 (22.7) | 0.563 | 0.453 |
| Chills/n(%) | 18 (54.5) | 16 (36.4) | 2.528 | 0.112 |
| Cough with sputum/n(%) | 14 (42.4) | 12 (27.3) | 1.936 | 0.164 |
| Sneezing/n(%) | 12 (36.4) | 14 (31.8) | 0.174 | 0.676 |
| Gastrointestinal discomfort/n(%) | 15 (45.5) | 15 (34.1) | 1.024 | 0.312 |
| Increased hair loss/n(%) | 20 (60.6) | 22 (50.0) | 0.856 | 0.355 |
| Number of symptoms | 9.48±4.60 | 8.09±4.35 | -1.359 | 0.178 |
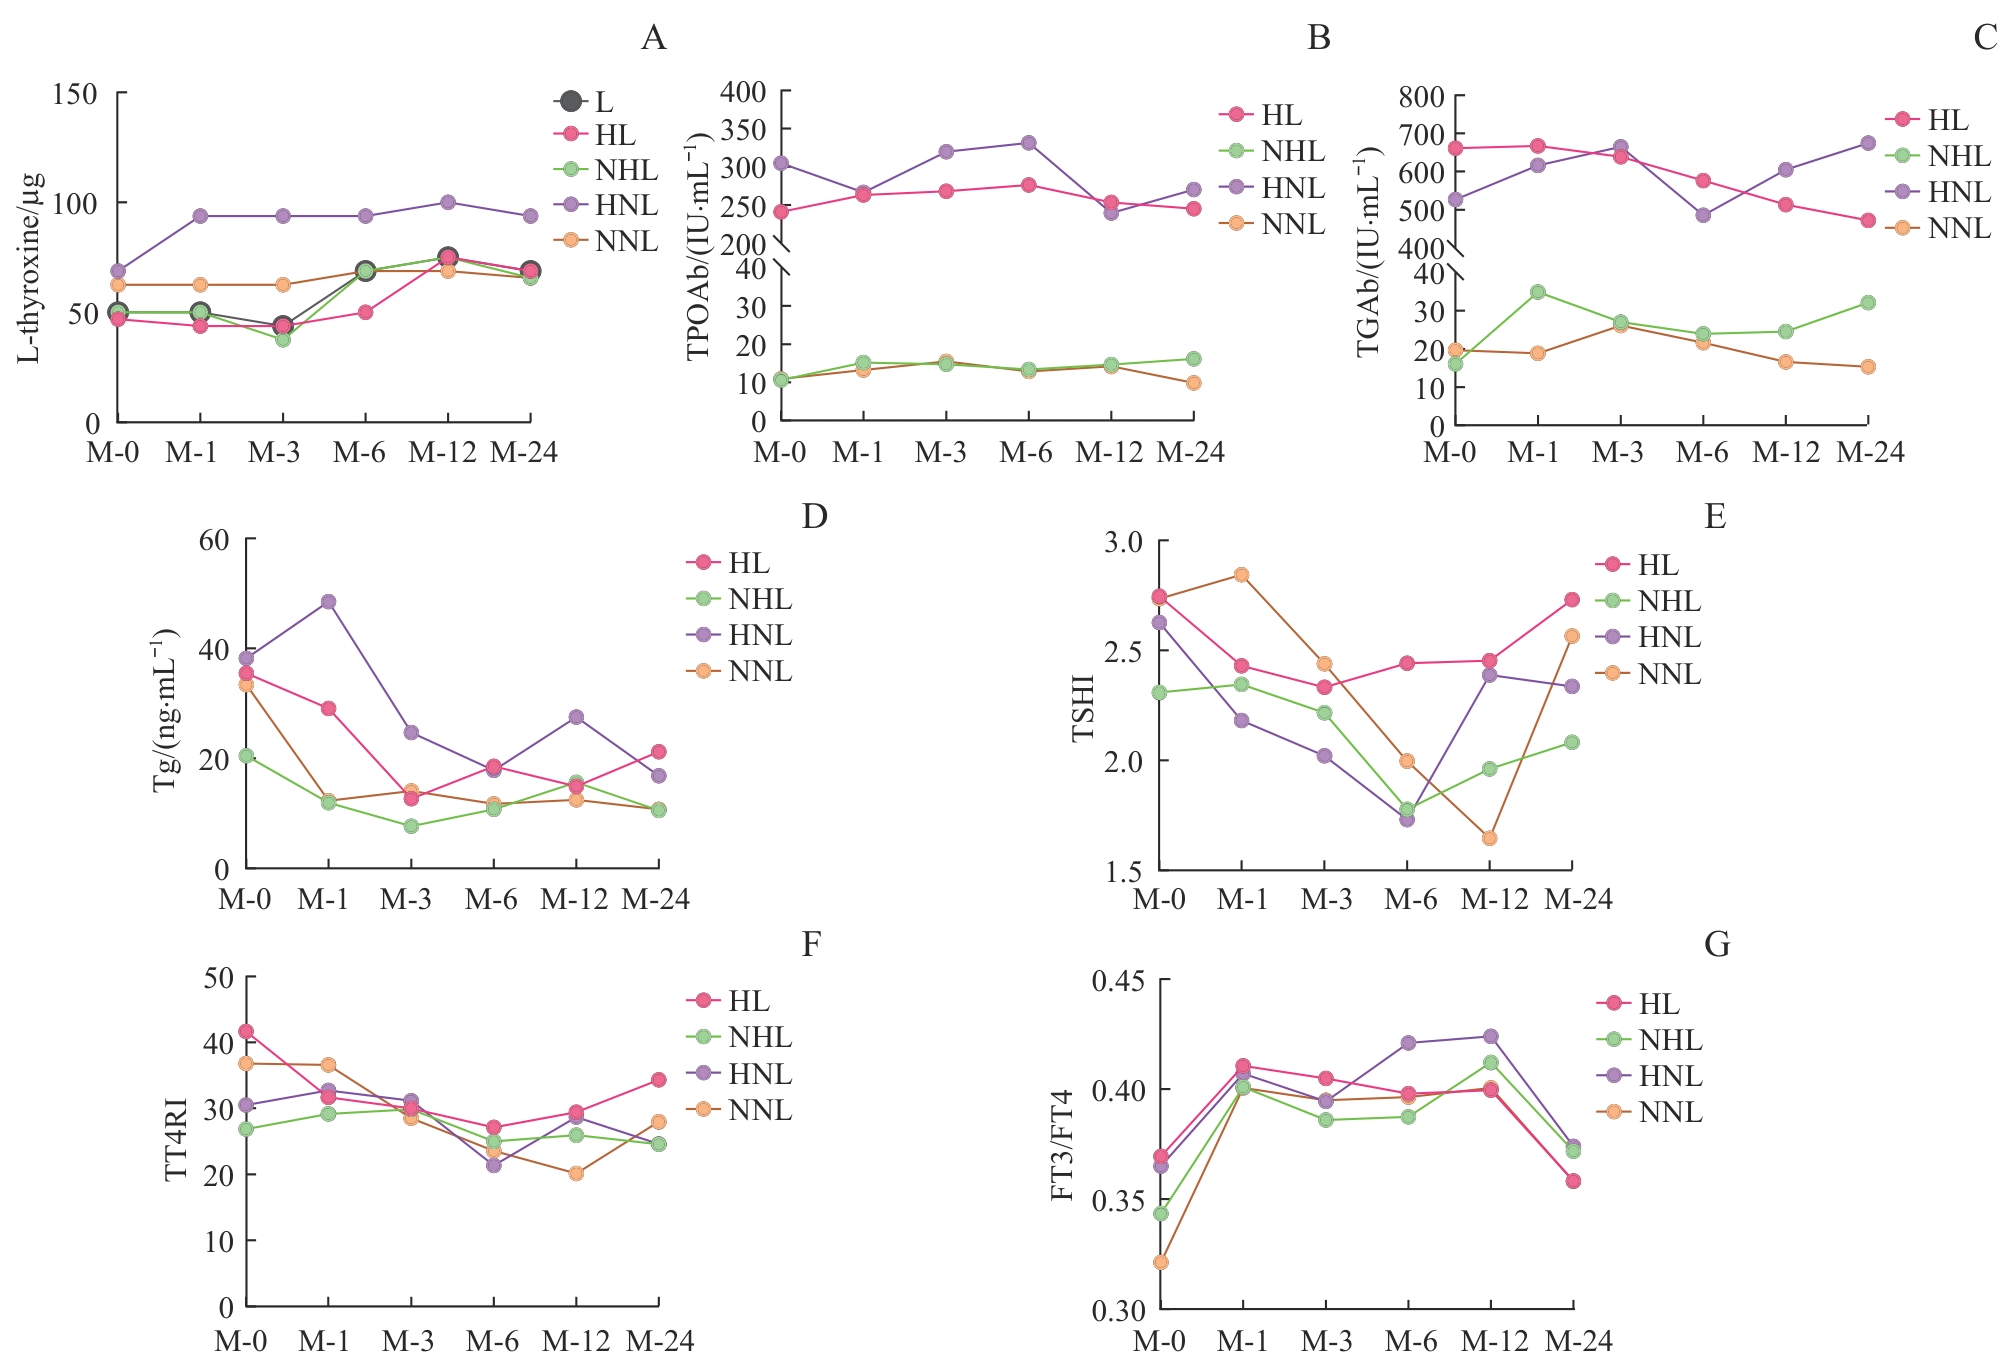
Fig 1 Changes in levothyroxine dose and thyroid-related parameters in each group after COVID-19Note: A. Levothyroxine dose. B.TPOAb. C.TGAb. D.Tg. E.TSHI. F.TT4RI. G.FT3/FT4. M-0—baseline; M-1—1 month after initial infection; M-3—3 months after initial infection; M-6—6 months after initial infection; M-12—12 months after initial infection; M-24—24 months after initial infection.
| Group | Reduced exercise level/n(%) | Engagement in physical activity/n(%) | Total physical activity/(MET-min·week-1) | Vigorous-intensity activity/(MET-min·week-1) | Moderate-intensity activity/(MET-min·week-1) | Walking activity/(MET-min·week-1) | Low-level physical activity/n(%) | Moderate-level physical activity/n(%) | High-level physical activity/n(%) |
|---|---|---|---|---|---|---|---|---|---|
| L (n=77) | 31 (40.3) | 74 (96.1) | 1233.58 (710.05,1633.96) | 52.07 (0.00,348.52) | 120.00 (0.00,240.06) | 704.97 (458.37,1075.17) | 5 (6.5) | 68 (88.3) | 4 (5.2) |
| NL (n=36) | 3 (8.3) | 36 (100.00) | 1493.00 (1033.74,2556.89) | 683.22 (106.15,1606.11) | 117.80 (0.00,371.99) | 725.23 (336.12,1174.11) | 1 (2.8) | 28 (77.8) | 7 (19.4) |
| χ²/z value | 10.418 | ‒ | -2.674 | -3.995 | -0.518 | -0.832 | 5.492 | ||
| P value | 0.001 | 0.550 | 0.007 | <0.001 | 0.604 | 0.405 | 0.055 | ||
| HL (n=33) | 16(48.5)① | 31 (93.9) | 1325.24 (724.50,1796.64) | 155.41 (0.00,543.68) | 104.52 (0.00, 236.43) | 902.57 (401.05,1076.64) | 3 (9.1) | 29 (87.9) | 1 (3.0) |
| NHL (n=44) | 15(34.1) | 43 (97.7) | 1066.83 (701.53,1371.10) | 0.00 (0.00,278.85)② | 131.32 (0.00,276.28) | 693.00 (464.18,1069.62) | 2 (4.5) | 39 (88.6) | 3 (6.8) |
| HNL (n=20) | 1(5) | 20 (100.00) | 1464.38 (1172.79,2537.01) | 567.89 (25.82,1606.11) | 101.44 (0.00,356.59) | 668.48 (349.52,977.74) | 1 (5.0) | 16 (80.0) | 3 (15.0) |
| NNL (n=16) | 2(12.5) | 16 (100.00) | 1493.00 (891.72,3252.26) | 683.81 (160.25,1618.15) | 190.92 (0.00,385.15) | 763.23 (324.09,1338.37) | 0 (0) | 12 (75.0) | 4 (25.0) |
| χ²/H value | 14.411 | 1.753 | 8.422 | 18.197 | 0.655 | 1.042 | 7.479 | ||
| P value | 0.002 | 0.743 | 0.038 | <0.001 | 0.884 | 0.791 | 0.208 | ||
Tab 5 Changes in physical activity levels after the initial COVID-19 in each group
| Group | Reduced exercise level/n(%) | Engagement in physical activity/n(%) | Total physical activity/(MET-min·week-1) | Vigorous-intensity activity/(MET-min·week-1) | Moderate-intensity activity/(MET-min·week-1) | Walking activity/(MET-min·week-1) | Low-level physical activity/n(%) | Moderate-level physical activity/n(%) | High-level physical activity/n(%) |
|---|---|---|---|---|---|---|---|---|---|
| L (n=77) | 31 (40.3) | 74 (96.1) | 1233.58 (710.05,1633.96) | 52.07 (0.00,348.52) | 120.00 (0.00,240.06) | 704.97 (458.37,1075.17) | 5 (6.5) | 68 (88.3) | 4 (5.2) |
| NL (n=36) | 3 (8.3) | 36 (100.00) | 1493.00 (1033.74,2556.89) | 683.22 (106.15,1606.11) | 117.80 (0.00,371.99) | 725.23 (336.12,1174.11) | 1 (2.8) | 28 (77.8) | 7 (19.4) |
| χ²/z value | 10.418 | ‒ | -2.674 | -3.995 | -0.518 | -0.832 | 5.492 | ||
| P value | 0.001 | 0.550 | 0.007 | <0.001 | 0.604 | 0.405 | 0.055 | ||
| HL (n=33) | 16(48.5)① | 31 (93.9) | 1325.24 (724.50,1796.64) | 155.41 (0.00,543.68) | 104.52 (0.00, 236.43) | 902.57 (401.05,1076.64) | 3 (9.1) | 29 (87.9) | 1 (3.0) |
| NHL (n=44) | 15(34.1) | 43 (97.7) | 1066.83 (701.53,1371.10) | 0.00 (0.00,278.85)② | 131.32 (0.00,276.28) | 693.00 (464.18,1069.62) | 2 (4.5) | 39 (88.6) | 3 (6.8) |
| HNL (n=20) | 1(5) | 20 (100.00) | 1464.38 (1172.79,2537.01) | 567.89 (25.82,1606.11) | 101.44 (0.00,356.59) | 668.48 (349.52,977.74) | 1 (5.0) | 16 (80.0) | 3 (15.0) |
| NNL (n=16) | 2(12.5) | 16 (100.00) | 1493.00 (891.72,3252.26) | 683.81 (160.25,1618.15) | 190.92 (0.00,385.15) | 763.23 (324.09,1338.37) | 0 (0) | 12 (75.0) | 4 (25.0) |
| χ²/H value | 14.411 | 1.753 | 8.422 | 18.197 | 0.655 | 1.042 | 7.479 | ||
| P value | 0.002 | 0.743 | 0.038 | <0.001 | 0.884 | 0.791 | 0.208 | ||
| [1] | Du Z W, Wang Y C, Bai Y, et al. Estimate of COVID-19 deaths, China, December 2022-February 2023[J]. Emerg Infect Dis, 2023, 29(10): 2121-2124. |
| [2] | Bai Y, Peng Z H, Wei F Y, et al. Study on the COVID-19 epidemic in mainland China between November 2022 and January 2023, with prediction of its tendency[J]. J Biosaf Biosecur, 2023, 5(1): 39-44. |
| [3] | Soriano J B, Murthy S, Marshall J C, et al. A clinical case definition of post-COVID-19 condition by a Delphi consensus[J]. Lancet Infect Dis, 2022, 22(4): e102-e7. |
| [4] | Crook H, Raza S, Nowell J, et al. Long covid: mechanisms, risk factors, and management[J]. BMJ, 2021: n1648. |
| [5] | Gupta G, Buonsenso D, Wood J, et al. Mechanistic insights into long COVID: viral persistence, immune dysregulation, and multi-organ dysfunction[J]. Compr Physiol, 2025, 15(3): e70019. |
| [6] | Taylor P N, Medici M M, Hubalewska-Dydejczyk A, et al. Hypothyroidism[J]. Lancet, 2024, 404(10460): 1347-1364. |
| [7] | Nham E, Song E Y, Hyun H, et al. Concurrent subacute thyroiditis and Graves' disease after COVID-19: a case report[J]. J Korean Med Sci, 2023, 38(18): e134. |
| [8] | Sebők S, Gyires K. Long COVID and possible preventive options[J]. Inflammopharmacology, 2023, 31(6): 2807-2817. |
| [9] | Jostel A, Ryder W D, Shalet S M. The use of thyroid function tests in the diagnosis of hypopituitarism: definition and evaluation of the TSH Index[J]. Clin Endocrinol, 2009, 71(4): 529-534. |
| [10] | Yagi H, Pohlenz J, Hayashi Y, et al. Resistance to thyroid hormone caused by two mutant thyroid hormone receptors beta, R243Q and R243W, with marked impairment of function that cannot be explained by altered in vitro 3, 5, 3'-triiodothyroinine binding affinity[J]. J Clin Endocrinol Metab, 1997, 82(5): 1608-1614. |
| [11] | Chen X X, Zhou Y L, Zhou M X, et al. Diagnostic values of free triiodothyronine and free thyroxine and the ratio of free triiodothyronine to free thyroxine in thyrotoxicosis[J]. Int J Endocrinol, 2018, 2018: 4836736. |
| [12] | Qin S J, Zhang Y N, Li Y H, et al. Long COVID facts and findings: a large-scale online survey in 74, 075 Chinese participants[J]. Lancet Reg Health West Pac, 2024, 52: 101218. |
| [13] | Nabavi N. Long covid: how to define it and how to manage it[J]. BMJ, 2020: m3489. |
| [14] | Asadi-Pooya A A, Akbari A, Emami A, et al. Risk factors associated with Long COVID syndrome: a retrospective study [J]. Iran J Med Sci, 2021, 46(6): 428-436. |
| [15] | Astin R, Banerjee A, Baker M R, et al. Long COVID: mechanisms, risk factors and recovery[J]. Exp Physiol, 2023, 108(1): 12-27. |
| [16] | Bae G, Yang Z Q, Bucci D, et al. Longitudinal lipoprotein and inflammatory mediators analysis uncover persisting inflammation and hyperlipidemia following SARS-CoV-2 infection in long COVID-19[J]. Metabolomics, 2025, 21(3): 65. |
| [17] | Huang L A, Lo S C, Yang Y S, et al. Association of COVID-19 infection with subsequent thyroid dysfunction: an international population-based propensity score matched analysis[J]. Thyroid, 2024, 34(4): 442-449. |
| [18] | Lania A, Sandri M T, Cellini M, et al. Thyrotoxicosis in patients with COVID-19: the THYRCOV study[J]. Eur J Endocrinol, 2020, 183(4): 381-387. |
| [19] | Khoo B, Tan T, Clarke S A, et al. Thyroid function before, during, and after COVID-19[J]. J Clin Endocrinol Metab, 2021, 106(2): e803-e811. |
| [20] | Jung Y H, Ha E H, Park J, et al. Neurological and psychiatric manifestations of post-COVID-19 conditions[J]. J Korean Med Sci, 2023, 38(11): e83. |
| [21] | Song W J, Hui C K M, Hull J H, et al. Confronting COVID-19-associated cough and the post-COVID syndrome: role of viral neurotropism, neuroinflammation, and neuroimmune responses[J]. Lancet Respir Med, 2021, 9(5): 533-544. |
| [22] | Soh H S, Cho B. Long COVID-19 and health-related quality of life of mild cases in Korea: 3-months follow-up of a single community treatment center[J]. J Korean Med Sci, 2022, 37(46): e326. |
| [23] | Woodruff M C, Ramonell R P, Nguyen D C, et al. Extrafollicular B cell responses correlate with neutralizing antibodies and morbidity in COVID-19[J]. Nat Immunol, 2020, 21(12): 1506-1516. |
| [24] | Najjar S, Pahlajani S, de Sanctis V, et al. Neurovascular unit dysfunction and blood-brain barrier hyperpermeability contribute to schizophrenia neurobiology: a theoretical integration of clinical and experimental evidence[J]. Front Psychiatry, 2017, 8: 83. |
| [25] | Hoogland I C, Houbolt C, van Westerloo D J, et al. Systemic inflammation and microglial activation: systematic review of animal experiments[J]. J Neuroinflammation, 2015, 12: 114. |
| [26] | Feter N, Caputo E L, Delpino F M, et al. Physical activity and long COVID: findings from the Prospective Study About Mental and Physical Health in Adults cohort[J]. Public Health, 2023, 220: 148-154. |
| [27] | Palau P, Calvo B, Sastre C, et al. Unraveling the mechanisms behind exercise intolerance and recovery in long COVID[J]. Am J Med, 2025, 138(2): 362-367. |
| [28] | Aschman T, Wyler E, Baum O, et al. Post-COVID exercise intolerance is associated with capillary alterations and immune dysregulations in skeletal muscles[J]. Acta Neuropathol Commun, 2023, 11(1): 193. |
| Viewed | ||||||
|
Full text |
|
|||||
|
Abstract |
|
|||||
