Journal of Shanghai Jiao Tong University (Medical Science) ›› 2026, Vol. 46 ›› Issue (3): 312-321.doi: 10.3969/j.issn.1674-8115.2026.03.005
• Clinical research • Previous Articles Next Articles
Amuti Abulikemu1,2, Li Youran1, Yang Chendie1, GuanPoh Tay1, Feng Shuo1, Zhang Ruiyan1, Wang Xiaoqun1( )
)
Received:2025-06-23
Accepted:2026-01-08
Online:2026-03-28
Published:2026-03-30
Contact:
Wang Xiaoqun
E-mail:wangxq@shsmu.edu.cn
Supported by:CLC Number:
Amuti Abulikemu, Li Youran, Yang Chendie, GuanPoh Tay, Feng Shuo, Zhang Ruiyan, Wang Xiaoqun. Impact of apolipoprotein B control on coronary atherosclerotic plaque progression: a cohort study using intravascular ultrasound[J]. Journal of Shanghai Jiao Tong University (Medical Science), 2026, 46(3): 312-321.
Add to citation manager EndNote|Ris|BibTeX
URL: https://xuebao.shsmu.edu.cn/EN/10.3969/j.issn.1674-8115.2026.03.005
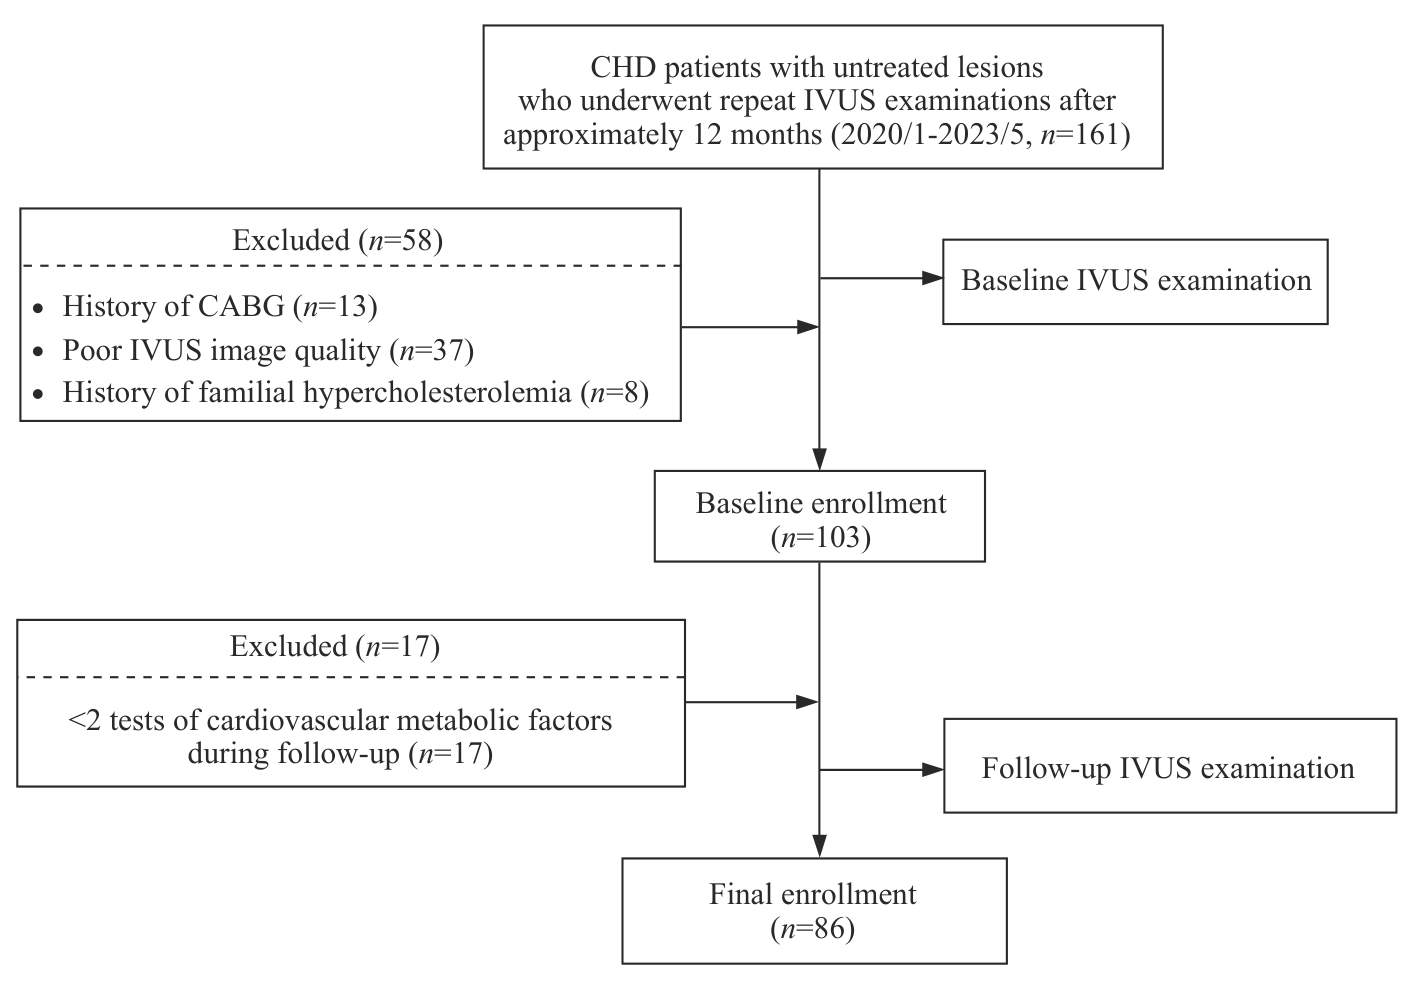
Fig 1 Flowchart of patient enrollment
| Variable | Plaque non-progression group (n=38) | Plaque progression group (n=48) | P value |
|---|---|---|---|
| Male/n(%) | 32 (84.2) | 31 (64.6) | 0.072 |
| Age/year | 63.5 (58.3, 70.0) | 61.0 (56.8, 67.3) | 0.208 |
| BMI/(kg·m-2) | 25.8 (23.4, 26.7) | 25.50 (23.3, 26.9) | 0.986 |
| Systolic blood pressure/mmHg | 139.0 (124.0, 152.5) | 139.5 (129.0, 154.0) | 0.852 |
| Diastolic blood pressure/mmHg | 78.0 (70.0, 86.5) | 78.0 (70.0, 85.5) | 0.818 |
| History of diabetes mellitus/n(%) | 14 (36.8) | 18 (37.5) | 1.000 |
| History of hypertension/n(%) | 22 (57.9) | 33 (68.8) | 0.415 |
| History of smoking/n(%) | 20 (52.6) | 17 (35.4) | 0.167 |
| Dyslipidemia/n(%) | 18 (47.4) | 37 (77.1) | 0.009 |
| ACEI/ARB/n(%) | 13 (34.2) | 21 (43.8) | 0.499 |
| ARNI/n(%) | 6 (15.8) | 5 (10.4) | 0.678 |
| SGLT2 inhibitors/n(%) | 7 (18.4) | 4 (8.3) | 0.286 |
| CCBs/n(%) | 9 (23.7) | 18 (37.5) | 0.256 |
| PCSK9 inhibitors/n(%) | 3 (7.9) | 6 (12.5) | 0.735 |
| Statins/n(%) | 30 (78.9) | 43 (89.6) | 0.287 |
| Aspirin/n(%) | 33 (86.8) | 44 (91.7) | 0.711 |
| P2Y12 receptor inhibitors/n(%) | 35 (92.1) | 46 (95.8) | 0.787 |
| β blockers/n(%) | 20 (52.6) | 22 (45.8) | 0.682 |
| hsCRP/(mg·L-1) | 0.81 (0.39, 2.30) | 1.96 (0.45, 3.09) | 0.280 |
| eGFR/[mL·(min·1.73 m2)-1] | 94.7 (87.0, 102.4) | 92.5 (87.7, 104.7) | 0.709 |
| Lesion distribution/n(%) | |||
| LM | 5 (6.2) | 14 (21.5) | 0.013 |
| LAD | 55 (67.9) | 38 (58.5) | 0.315 |
| LCX | 4 (4.9) | 0 (0) | 0.191 |
| RCA | 17 (21.0) | 13 (20.0) | 1.000 |
| SYNTAX score/score | 15.0 (9.0, 21.8) | 23.0 (17.3, 31.3) | 0.006 |
| Gensini score/score | 21.5 (13.1, 33.8) | 29.3 (22.0, 49.3) | 0.006 |
Tab 1 Comparison of baseline clinical characteristics between the two groups
| Variable | Plaque non-progression group (n=38) | Plaque progression group (n=48) | P value |
|---|---|---|---|
| Male/n(%) | 32 (84.2) | 31 (64.6) | 0.072 |
| Age/year | 63.5 (58.3, 70.0) | 61.0 (56.8, 67.3) | 0.208 |
| BMI/(kg·m-2) | 25.8 (23.4, 26.7) | 25.50 (23.3, 26.9) | 0.986 |
| Systolic blood pressure/mmHg | 139.0 (124.0, 152.5) | 139.5 (129.0, 154.0) | 0.852 |
| Diastolic blood pressure/mmHg | 78.0 (70.0, 86.5) | 78.0 (70.0, 85.5) | 0.818 |
| History of diabetes mellitus/n(%) | 14 (36.8) | 18 (37.5) | 1.000 |
| History of hypertension/n(%) | 22 (57.9) | 33 (68.8) | 0.415 |
| History of smoking/n(%) | 20 (52.6) | 17 (35.4) | 0.167 |
| Dyslipidemia/n(%) | 18 (47.4) | 37 (77.1) | 0.009 |
| ACEI/ARB/n(%) | 13 (34.2) | 21 (43.8) | 0.499 |
| ARNI/n(%) | 6 (15.8) | 5 (10.4) | 0.678 |
| SGLT2 inhibitors/n(%) | 7 (18.4) | 4 (8.3) | 0.286 |
| CCBs/n(%) | 9 (23.7) | 18 (37.5) | 0.256 |
| PCSK9 inhibitors/n(%) | 3 (7.9) | 6 (12.5) | 0.735 |
| Statins/n(%) | 30 (78.9) | 43 (89.6) | 0.287 |
| Aspirin/n(%) | 33 (86.8) | 44 (91.7) | 0.711 |
| P2Y12 receptor inhibitors/n(%) | 35 (92.1) | 46 (95.8) | 0.787 |
| β blockers/n(%) | 20 (52.6) | 22 (45.8) | 0.682 |
| hsCRP/(mg·L-1) | 0.81 (0.39, 2.30) | 1.96 (0.45, 3.09) | 0.280 |
| eGFR/[mL·(min·1.73 m2)-1] | 94.7 (87.0, 102.4) | 92.5 (87.7, 104.7) | 0.709 |
| Lesion distribution/n(%) | |||
| LM | 5 (6.2) | 14 (21.5) | 0.013 |
| LAD | 55 (67.9) | 38 (58.5) | 0.315 |
| LCX | 4 (4.9) | 0 (0) | 0.191 |
| RCA | 17 (21.0) | 13 (20.0) | 1.000 |
| SYNTAX score/score | 15.0 (9.0, 21.8) | 23.0 (17.3, 31.3) | 0.006 |
| Gensini score/score | 21.5 (13.1, 33.8) | 29.3 (22.0, 49.3) | 0.006 |
| Variable | Group | Baseline | Follow-up | ||||
|---|---|---|---|---|---|---|---|
| Time-averaged | Mean | SD | CV | ||||
| HbA1c/% | Plaque non-progression | 6.00 (5.60, 6.47) | 6.12 (5.71, 6.44) | 6.08 (5.71, 6.71) | 0.21 (0.13, 0.35) | 3.69 (2.33, 5.66) | |
| Plaque progression | 6.05 (5.70, 6.75) | 6.09 (5.74, 6.64) | 6.09 (5.74, 6.79) | 0.23 (0.14, 0.44) | 4.17 (2.24, 6.27) | ||
| P value | 0.685 | 0.715 | 0.784 | 0.769 | 0.691 | ||
| TC/(mmol·L-1) | Plaque non-progression | 3.70 (3.21, 4.40) | 3.36 (2.95, 3.81) | 3.38 (2.96, 3.88) | 0.35 (0.18, 0.74) | 11.38 (6.47, 21.09) | |
| Plaque progression | 3.83 (3.24, 5.02) | 3.57 (3.07, 4.01) | 3.65 (3.12, 4.15) | 0.57 (0.40, 0.89) | 15.23 (10.51, 24.96) | ||
| P value | 0.268 | 0.198 | 0.220 | 0.018 | 0.055 | ||
| TAG/(mmol·L-1) | Plaque non-progression | 1.27 (0.97, 1.59) | 1.26 (0.92, 1.50) | 1.26 (0.92, 1.50) | 0.20 (0.10, 0.35) | 19.51 (8.86, 28.66) | |
| Plaque progression | 1.73 (1.21, 2.15) | 1.50 (1.22, 1.93) | 1.50 (1.26, 1.95) | 0.31 (0.21, 0.54) | 20.71 (15.42, 34.00) | ||
| P value | 0.009 | 0.010 | 0.008 | 0.015 | 0.227 | ||
| HDL-C/(mmol·L-1) | Plaque non-progression | 1.09 (0.93, 1.30) | 1.11 (0.93, 1.36) | 1.11 (0.96, 1.33) | 0.09 (0.06, 0.14) | 8.54 (5.61, 10.83) | |
| Plaque progression | 1.02 (0.92, 1.17) | 1.13 (0.94, 1.24) | 1.11 (0.95, 1.22) | 0.11 (0.07, 0.15) | 9.52 (6.38, 13.93) | ||
| P value | 0.287 | 0.434 | 0.350 | 0.449 | 0.198 | ||
| Non-HDL-C/(mmol·L-1) | Plaque non-progression | 2.51 (2.08, 3.01) | 2.14 (1.86, 2.56) | 2.16 (1.97, 2.65) | 0.43 (0.15, 0.78) | 19.99 (7.34, 32.99) | |
| Plaque progression | 2.87 (2.28, 3.89) | 2.37 (1.99, 2.88) | 2.50 (1.99, 3.00) | 0.61 (0.30, 0.89) | 21.29 (14.14, 37.83) | ||
| P value | 0.085 | 0.044 | 0.036 | 0.082 | 0.214 | ||
| LDL-C/(mmol·L-1) | Plaque non-progression | 2.06 (1.65, 2.52) | 1.72 (1.38, 2.11) | 1.73 (1.42, 2.19) | 0.29 (0.15, 0.65) | 20.23 (8.72, 32.19) | |
| Plaque progression | 2.18 (1.59, 3.29) | 1.81 (1.54, 2.20) | 1.84 (1.53, 2.38) | 0.53 (0.25, 0.81) | 25.57 (15.41, 42.34) | ||
| P value | 0.366 | 0.175 | 0.150 | 0.022 | 0.057 | ||
| RLP-C/(mmol·L-1) | Plaque non-progression | 0.46 (0.35, 0.57) | 0.42 (0.29, 0.49) | 0.45 (0.30, 0.50) | 0.13 (0.07, 0.19) | 35.48 (20.05, 49.81) | |
| Plaque progression | 0.61 (0.47, 0.76) | 0.50 (0.37, 0.65) | 0.52 (0.39, 0.63) | 0.18 (0.12, 0.23) | 33.07 (26.02, 41.53) | ||
| P value | 0.005 | 0.016 | 0.016 | 0.044 | 0.882 | ||
| Lp(a)/(g·L-1) | Plaque non-progression | 0.16 (0.06, 0.32) | 0.13 (0.06, 0.32) | 0.13 (0.06, 0.32) | 0.04 (0.02, 0.06) | 23.59 (15.71, 41.61) | |
| Plaque progression | 0.12 (0.08, 0.36) | 0.12 (0.05, 0.41) | 0.12 (0.05, 0.39) | 0.03 (0.02, 0.08) | 21.59 (10.89, 40.54) | ||
| P value | 0.807 | 0.913 | 0.886 | 0.936 | 0.446 | ||
| ApoA-1/(g·L-1) | Plaque non-progression | 1.25 (1.08, 1.40) | 1.29 (1.10, 1.46) | 1.30 (1.11, 1.44) | 0.11 (0.06, 0.16) | 8.57 (4.98, 11.48) | |
| Plaque progression | 1.22 (1.09, 1.32) | 1.28 (1.10, 1.40) | 1.27 (1.10, 1.39) | 0.09 (0.05, 0.15) | 7.29 (4.62, 10.80) | ||
| P value | 0.702 | 0.865 | 0.664 | 0.462 | 0.529 | ||
| ApoB/(g·L-1) | Plaque non-progression | 0.68 (0.59, 0.82) | 0.62 (0.54, 0.73) | 0.63 (0.55, 0.73) | 0.09 (0.05, 0.14) | 15.04 (9.43, 20.47) | |
| Plaque progression | 0.81 (0.64, 0.99) | 0.71 (0.62, 0.85) | 0.72 (0.62, 0.84) | 0.12 (0.06, 0.23) | 18.12 (7.90, 29.51) | ||
| P value | 0.047 | 0.021 | 0.021 | 0.116 | 0.387 | ||
| ApoE/(mg·L-1) | Plaque non-progression | 3.55 (3.10, 4.10) | 3.45 (3.29, 3.76) | 3.52 (3.27, 3.92) | 0.33 (0.21, 0.51) | 9.62 (6.15, 14.81) | |
| Plaque progression | 3.95 (3.55, 4.60) | 3.69 (3.27, 4.24) | 3.74 (3.36, 4.31) | 0.54 (0.23, 0.77) | 13.87 (6.43, 20.68) | ||
| P value | 0.015 | 0.153 | 0.118 | 0.110 | 0.146 | ||
Tab 2 Analysis of cardiometabolic parameters in the two groups at baseline and follow-up
| Variable | Group | Baseline | Follow-up | ||||
|---|---|---|---|---|---|---|---|
| Time-averaged | Mean | SD | CV | ||||
| HbA1c/% | Plaque non-progression | 6.00 (5.60, 6.47) | 6.12 (5.71, 6.44) | 6.08 (5.71, 6.71) | 0.21 (0.13, 0.35) | 3.69 (2.33, 5.66) | |
| Plaque progression | 6.05 (5.70, 6.75) | 6.09 (5.74, 6.64) | 6.09 (5.74, 6.79) | 0.23 (0.14, 0.44) | 4.17 (2.24, 6.27) | ||
| P value | 0.685 | 0.715 | 0.784 | 0.769 | 0.691 | ||
| TC/(mmol·L-1) | Plaque non-progression | 3.70 (3.21, 4.40) | 3.36 (2.95, 3.81) | 3.38 (2.96, 3.88) | 0.35 (0.18, 0.74) | 11.38 (6.47, 21.09) | |
| Plaque progression | 3.83 (3.24, 5.02) | 3.57 (3.07, 4.01) | 3.65 (3.12, 4.15) | 0.57 (0.40, 0.89) | 15.23 (10.51, 24.96) | ||
| P value | 0.268 | 0.198 | 0.220 | 0.018 | 0.055 | ||
| TAG/(mmol·L-1) | Plaque non-progression | 1.27 (0.97, 1.59) | 1.26 (0.92, 1.50) | 1.26 (0.92, 1.50) | 0.20 (0.10, 0.35) | 19.51 (8.86, 28.66) | |
| Plaque progression | 1.73 (1.21, 2.15) | 1.50 (1.22, 1.93) | 1.50 (1.26, 1.95) | 0.31 (0.21, 0.54) | 20.71 (15.42, 34.00) | ||
| P value | 0.009 | 0.010 | 0.008 | 0.015 | 0.227 | ||
| HDL-C/(mmol·L-1) | Plaque non-progression | 1.09 (0.93, 1.30) | 1.11 (0.93, 1.36) | 1.11 (0.96, 1.33) | 0.09 (0.06, 0.14) | 8.54 (5.61, 10.83) | |
| Plaque progression | 1.02 (0.92, 1.17) | 1.13 (0.94, 1.24) | 1.11 (0.95, 1.22) | 0.11 (0.07, 0.15) | 9.52 (6.38, 13.93) | ||
| P value | 0.287 | 0.434 | 0.350 | 0.449 | 0.198 | ||
| Non-HDL-C/(mmol·L-1) | Plaque non-progression | 2.51 (2.08, 3.01) | 2.14 (1.86, 2.56) | 2.16 (1.97, 2.65) | 0.43 (0.15, 0.78) | 19.99 (7.34, 32.99) | |
| Plaque progression | 2.87 (2.28, 3.89) | 2.37 (1.99, 2.88) | 2.50 (1.99, 3.00) | 0.61 (0.30, 0.89) | 21.29 (14.14, 37.83) | ||
| P value | 0.085 | 0.044 | 0.036 | 0.082 | 0.214 | ||
| LDL-C/(mmol·L-1) | Plaque non-progression | 2.06 (1.65, 2.52) | 1.72 (1.38, 2.11) | 1.73 (1.42, 2.19) | 0.29 (0.15, 0.65) | 20.23 (8.72, 32.19) | |
| Plaque progression | 2.18 (1.59, 3.29) | 1.81 (1.54, 2.20) | 1.84 (1.53, 2.38) | 0.53 (0.25, 0.81) | 25.57 (15.41, 42.34) | ||
| P value | 0.366 | 0.175 | 0.150 | 0.022 | 0.057 | ||
| RLP-C/(mmol·L-1) | Plaque non-progression | 0.46 (0.35, 0.57) | 0.42 (0.29, 0.49) | 0.45 (0.30, 0.50) | 0.13 (0.07, 0.19) | 35.48 (20.05, 49.81) | |
| Plaque progression | 0.61 (0.47, 0.76) | 0.50 (0.37, 0.65) | 0.52 (0.39, 0.63) | 0.18 (0.12, 0.23) | 33.07 (26.02, 41.53) | ||
| P value | 0.005 | 0.016 | 0.016 | 0.044 | 0.882 | ||
| Lp(a)/(g·L-1) | Plaque non-progression | 0.16 (0.06, 0.32) | 0.13 (0.06, 0.32) | 0.13 (0.06, 0.32) | 0.04 (0.02, 0.06) | 23.59 (15.71, 41.61) | |
| Plaque progression | 0.12 (0.08, 0.36) | 0.12 (0.05, 0.41) | 0.12 (0.05, 0.39) | 0.03 (0.02, 0.08) | 21.59 (10.89, 40.54) | ||
| P value | 0.807 | 0.913 | 0.886 | 0.936 | 0.446 | ||
| ApoA-1/(g·L-1) | Plaque non-progression | 1.25 (1.08, 1.40) | 1.29 (1.10, 1.46) | 1.30 (1.11, 1.44) | 0.11 (0.06, 0.16) | 8.57 (4.98, 11.48) | |
| Plaque progression | 1.22 (1.09, 1.32) | 1.28 (1.10, 1.40) | 1.27 (1.10, 1.39) | 0.09 (0.05, 0.15) | 7.29 (4.62, 10.80) | ||
| P value | 0.702 | 0.865 | 0.664 | 0.462 | 0.529 | ||
| ApoB/(g·L-1) | Plaque non-progression | 0.68 (0.59, 0.82) | 0.62 (0.54, 0.73) | 0.63 (0.55, 0.73) | 0.09 (0.05, 0.14) | 15.04 (9.43, 20.47) | |
| Plaque progression | 0.81 (0.64, 0.99) | 0.71 (0.62, 0.85) | 0.72 (0.62, 0.84) | 0.12 (0.06, 0.23) | 18.12 (7.90, 29.51) | ||
| P value | 0.047 | 0.021 | 0.021 | 0.116 | 0.387 | ||
| ApoE/(mg·L-1) | Plaque non-progression | 3.55 (3.10, 4.10) | 3.45 (3.29, 3.76) | 3.52 (3.27, 3.92) | 0.33 (0.21, 0.51) | 9.62 (6.15, 14.81) | |
| Plaque progression | 3.95 (3.55, 4.60) | 3.69 (3.27, 4.24) | 3.74 (3.36, 4.31) | 0.54 (0.23, 0.77) | 13.87 (6.43, 20.68) | ||
| P value | 0.015 | 0.153 | 0.118 | 0.110 | 0.146 | ||
| IVUS parameter | Time point | Lesion non-progression group (n=81) | Lesion progression group (n=65) | P value |
|---|---|---|---|---|
| Reference lumen area/mm2 | BL | 10.30 (7.46, 13.43) | 11.25 (7.45, 15.29) | 0.156 |
| FU | 9.25 (6.96, 11.86) | 7.94 (6.12, 12.70) | 0.292 | |
| Δ | -0.48 (-1.71, 0.38) | -2.00 (-3.83, -0.46) | <0.001 | |
| Reference EEM-CSA/mm2 | BL | 14.96 (11.21, 19.01) | 15.40 (10.87, 20.45) | 0.627 |
| FU | 14.35 (10.53, 17.29) | 13.99 (9.73, 18.00) | 0.953 | |
| Δ | -0.56 (-1.73, 0.04) | -0.90 (-2.83, -0.03) | 0.127 | |
| Reference lumen diameter/mm | BL | 4.37 (3.78, 4.93) | 4.43 (3.72, 5.10) | 0.697 |
| FU | 4.27 (3.66, 4.69) | 4.22 (3.47, 4.79) | 0.887 | |
| Δ | -0.08 (-0.28, 0.00) | -0.19 (-0.38, -0.03) | 0.072 | |
| MLA/mm2 | BL | 5.80 (4.49, 8.29) | 7.30 (4.04, 9.92) | 0.210 |
| FU | 5.60 (4.28, 8.09) | 5.11 (3.53, 7.27) | 0.144 | |
| Δ | -0.13 (-0.75, 0.37) | -1.77 (-2.92, -0.54) | <0.001 | |
| EEM-CSA at MLA/mm2 | BL | 14.31 (10.46, 17.33) | 14.12 (9.80, 19.14) | 0.931 |
| FU | 13.10 (9.59, 15.47) | 12.99 (9.86, 18.03) | 0.884 | |
| Δ | -0.59 (-1.97, 0.12) | -0.39 (-2.05, 0.31) | 0.663 | |
| MLD/mm | BL | 2.71 (2.39, 3.25) | 3.15 (2.27, 3.55) | 0.145 |
| FU | 2.67 (2.42, 3.22) | 2.55 (2.12, 3.04) | 0.091 | |
| Δ | -0.02 (-0.20, 0.10) | -0.42 (-0.70, -0.15) | <0.001 | |
| TAV/mm3 | BL | 43.59 (24.95, 62.60) | 29.94 (18.18, 44.91) | 0.008 |
| FU | 42.79 (20.63, 66.88) | 45.61 (27.13, 64.83) | 0.381 | |
| Δ | -2.23 (-9.18, 2.55) | 11.93 (6.02, 17.54) | <0.001 | |
| TAVnorm/mm3 | BL | 41.81 (32.41, 51.73) | 31.50 (20.14, 43.74) | <0.001 |
| FU | 38.05 (25.60, 51.21) | 46.04 (32.70, 56.98) | 0.079 | |
| Δ | -2.07 (-7.74, 2.47) | 10.82 (5.55, 18.17) | <0.001 | |
| PAV/% | BL | 45.21 (37.49, 51.80) | 34.70 (23.61, 44.55) | <0.001 |
| FU | 41.36 (33.84, 48.96) | 48.84 (38.81, 55.84) | 0.003 | |
| Δ | -2.01 (-7.04, 1.85) | 10.31 (7.23, 15.96) | <0.001 | |
| RI | BL | 0.96 (0.89, 1.00) | 0.93 (0.87, 0.98) | 0.082 |
| FU | 0.95 (0.88, 1.00) | 0.95 (0.89, 1.01) | 0.487 | |
| Δ | 0.01 (-0.05, 0.05) | 0.04 (-0.03, 0.10) | 0.035 |
Tab 3 Analysis of IVUS characteristics in the two lesion groups at baseline and follow-up
| IVUS parameter | Time point | Lesion non-progression group (n=81) | Lesion progression group (n=65) | P value |
|---|---|---|---|---|
| Reference lumen area/mm2 | BL | 10.30 (7.46, 13.43) | 11.25 (7.45, 15.29) | 0.156 |
| FU | 9.25 (6.96, 11.86) | 7.94 (6.12, 12.70) | 0.292 | |
| Δ | -0.48 (-1.71, 0.38) | -2.00 (-3.83, -0.46) | <0.001 | |
| Reference EEM-CSA/mm2 | BL | 14.96 (11.21, 19.01) | 15.40 (10.87, 20.45) | 0.627 |
| FU | 14.35 (10.53, 17.29) | 13.99 (9.73, 18.00) | 0.953 | |
| Δ | -0.56 (-1.73, 0.04) | -0.90 (-2.83, -0.03) | 0.127 | |
| Reference lumen diameter/mm | BL | 4.37 (3.78, 4.93) | 4.43 (3.72, 5.10) | 0.697 |
| FU | 4.27 (3.66, 4.69) | 4.22 (3.47, 4.79) | 0.887 | |
| Δ | -0.08 (-0.28, 0.00) | -0.19 (-0.38, -0.03) | 0.072 | |
| MLA/mm2 | BL | 5.80 (4.49, 8.29) | 7.30 (4.04, 9.92) | 0.210 |
| FU | 5.60 (4.28, 8.09) | 5.11 (3.53, 7.27) | 0.144 | |
| Δ | -0.13 (-0.75, 0.37) | -1.77 (-2.92, -0.54) | <0.001 | |
| EEM-CSA at MLA/mm2 | BL | 14.31 (10.46, 17.33) | 14.12 (9.80, 19.14) | 0.931 |
| FU | 13.10 (9.59, 15.47) | 12.99 (9.86, 18.03) | 0.884 | |
| Δ | -0.59 (-1.97, 0.12) | -0.39 (-2.05, 0.31) | 0.663 | |
| MLD/mm | BL | 2.71 (2.39, 3.25) | 3.15 (2.27, 3.55) | 0.145 |
| FU | 2.67 (2.42, 3.22) | 2.55 (2.12, 3.04) | 0.091 | |
| Δ | -0.02 (-0.20, 0.10) | -0.42 (-0.70, -0.15) | <0.001 | |
| TAV/mm3 | BL | 43.59 (24.95, 62.60) | 29.94 (18.18, 44.91) | 0.008 |
| FU | 42.79 (20.63, 66.88) | 45.61 (27.13, 64.83) | 0.381 | |
| Δ | -2.23 (-9.18, 2.55) | 11.93 (6.02, 17.54) | <0.001 | |
| TAVnorm/mm3 | BL | 41.81 (32.41, 51.73) | 31.50 (20.14, 43.74) | <0.001 |
| FU | 38.05 (25.60, 51.21) | 46.04 (32.70, 56.98) | 0.079 | |
| Δ | -2.07 (-7.74, 2.47) | 10.82 (5.55, 18.17) | <0.001 | |
| PAV/% | BL | 45.21 (37.49, 51.80) | 34.70 (23.61, 44.55) | <0.001 |
| FU | 41.36 (33.84, 48.96) | 48.84 (38.81, 55.84) | 0.003 | |
| Δ | -2.01 (-7.04, 1.85) | 10.31 (7.23, 15.96) | <0.001 | |
| RI | BL | 0.96 (0.89, 1.00) | 0.93 (0.87, 0.98) | 0.082 |
| FU | 0.95 (0.88, 1.00) | 0.95 (0.89, 1.01) | 0.487 | |
| Δ | 0.01 (-0.05, 0.05) | 0.04 (-0.03, 0.10) | 0.035 |
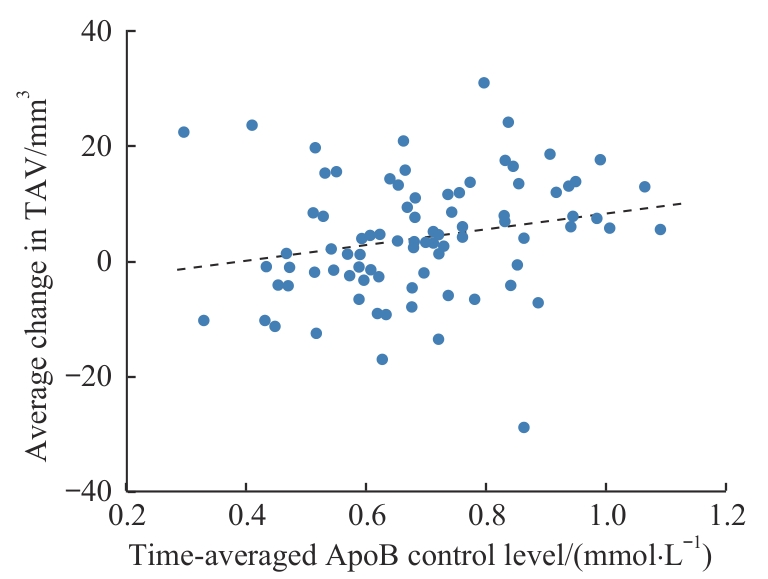
Fig 2 Correlation between time-averaged ApoB control level and average change in TAV
| Parameter | OR (95% CI) | P value | |
|---|---|---|---|
| Age | 0.964 (0.925‒1.003) | 0.078 | |
| Male | 0.634 (0.315‒1.270) | 0.199 | |
| Hypertension | 1.629 (0.685‒4.041) | 0.277 | |
| Diabetes | 1.311 (0.657‒2.622) | 0.441 | |
| Systolic blood pressure | 1.001 (0.986‒1.016) | 0.878 | |
| Diastolic blood pressure | 0.990 (0.959‒1.021) | 0.509 | |
| Current smoker | 0.584 (0.285‒1.183) | 0.138 | |
| BMI | 0.976 (0.866‒1.098) | 0.687 | |
| hsCRP | 1.041 (0.999‒1.103) | 0.094 | |
| eGFR | 0.998 (0.980‒1.017) | 0.863 | |
| Aspirin | 2.915 (0.973‒10.782) | 0.074 | |
| P2Y12 inhibitors | 2.980 (0.691‒20.485) | 0.183 | |
| β blockers | 0.826 (0.427‒1.588) | 0.567 | |
| SGLT2 inhibitors | 0.592 (0.176‒1.762) | 0.361 | |
| ARNI | 0.768 (0.267‒2.077) | 0.608 | |
| ACEI/ARBs | 1.133 (0.578‒2.219) | 0.714 | |
| Statins | 2.087 (0.729‒6.870) | 0.190 | |
| PCSK9 inhibitors | 0.893 (0.326‒2.355) | 0.820 | |
| Reference luminal area | 1.061 (0.996‒1.135) | 0.073 | |
| Reference EEM CSA | 1.018 (0.962‒1.078) | 0.533 | |
| Reference luminal diameter | 1.059 (0.719‒1.564) | 0.771 | |
| MLA | 1.095 (0.998‒1.206) | 0.059 | |
| EEM CSA at MLA | 1.006 (0.946‒1.070) | 0.846 | |
| MLD | 1.538 (0.990‒2.435) | 0.059 | |
| Remodeling index | 0.124 (0.006‒2.176) | 0.163 | |
| Lesion length | 0.972 (0.875‒1.077) | 0.591 | |
| TAV | 0.982 (0.969‒0.994) | 0.006 | |
| TAVnorm | 0.971 (0.951‒0.990) | 0.004 | |
| PAV | 0.946 (0.919‒0.972) | <0.001 | |
| HbA1c | Baseline | 1.062 (0.817‒1.383) | 0.649 |
| Mean | 1.192 (0.845‒1.705) | 0.320 | |
| Time-averaged | 1.252 (0.877‒1.827) | 0.224 | |
| TAG | Baseline | 1.536 (1.024‒2.393) | 0.046 |
| Mean | 1.826 (1.065‒3.284) | 0.034 | |
| Time-averaged | 1.674 (0.998‒2.942) | 0.059 | |
| TC | Baseline | 1.184 (0.892‒1.582) | 0.245 |
| Mean | 1.140 (0.724‒1.806) | 0.571 | |
| Time-averaged | 1.178 (0.760‒1.841) | 0.464 | |
| HDL-C | Baseline | 0.214 (0.046‒0.906) | 0.042 |
| Mean | 1.378 (0.783‒2.481) | 0.270 | |
| Time-averaged | 1.418 (0.824‒2.506) | 0.214 | |
| non-HDL-C | Baseline | 1.288 (0.957‒1.757) | 0.100 |
| Mean | 1.445 (0.877‒2.443) | 0.155 | |
| Time-averaged | 1.469 (0.905‒2.454) | 0.127 | |
| LDL-C | Baseline | 1.249 (0.901‒1.750) | 0.186 |
| Mean | 1.378 (0.783‒2.481) | 0.270 | |
| Time-averaged | 1.418 (0.824‒2.506) | 0.214 | |
| RLP-C | Baseline | 2.579 (0.861‒8.450) | 0.100 |
| Mean | 2.804 (0.641‒12.993) | 0.175 | |
| Time-averaged | 2.521 (0.612‒11.074) | 0.206 | |
| Lp(a) | Baseline | 2.431 (0.834‒7.575) | 0.110 |
| Mean | 2.383 (0.785‒7.621) | 0.130 | |
| Time-averaged | 2.417 (0.799‒7.717) | 0.123 | |
| ApoA-1 | Baseline | 0.527 (0.091‒2.921) | 0.466 |
| Mean | 0.488 (0.089‒2.542) | 0.398 | |
| Time-averaged | 0.618 (0.125‒2.937) | 0.547 | |
| ApoB | Baseline | 6.373 (1.396‒31.465) | 0.019 |
| Mean | 12.665 (1.232‒148.092) | 0.036 | |
| Time-averaged | 11.357 (1.406‒102.908) | 0.026 | |
| ApoE | Baseline | 1.598 (1.096‒2.437) | 0.020 |
| Mean | 1.457 (0.860‒2.559) | 0.172 | |
| Time-averaged | 1.474 (0.846‒2.650) | 0.179 | |
Tab 4 Univariate Logistic regression analysis of factors influencing coronary plaque progression
| Parameter | OR (95% CI) | P value | |
|---|---|---|---|
| Age | 0.964 (0.925‒1.003) | 0.078 | |
| Male | 0.634 (0.315‒1.270) | 0.199 | |
| Hypertension | 1.629 (0.685‒4.041) | 0.277 | |
| Diabetes | 1.311 (0.657‒2.622) | 0.441 | |
| Systolic blood pressure | 1.001 (0.986‒1.016) | 0.878 | |
| Diastolic blood pressure | 0.990 (0.959‒1.021) | 0.509 | |
| Current smoker | 0.584 (0.285‒1.183) | 0.138 | |
| BMI | 0.976 (0.866‒1.098) | 0.687 | |
| hsCRP | 1.041 (0.999‒1.103) | 0.094 | |
| eGFR | 0.998 (0.980‒1.017) | 0.863 | |
| Aspirin | 2.915 (0.973‒10.782) | 0.074 | |
| P2Y12 inhibitors | 2.980 (0.691‒20.485) | 0.183 | |
| β blockers | 0.826 (0.427‒1.588) | 0.567 | |
| SGLT2 inhibitors | 0.592 (0.176‒1.762) | 0.361 | |
| ARNI | 0.768 (0.267‒2.077) | 0.608 | |
| ACEI/ARBs | 1.133 (0.578‒2.219) | 0.714 | |
| Statins | 2.087 (0.729‒6.870) | 0.190 | |
| PCSK9 inhibitors | 0.893 (0.326‒2.355) | 0.820 | |
| Reference luminal area | 1.061 (0.996‒1.135) | 0.073 | |
| Reference EEM CSA | 1.018 (0.962‒1.078) | 0.533 | |
| Reference luminal diameter | 1.059 (0.719‒1.564) | 0.771 | |
| MLA | 1.095 (0.998‒1.206) | 0.059 | |
| EEM CSA at MLA | 1.006 (0.946‒1.070) | 0.846 | |
| MLD | 1.538 (0.990‒2.435) | 0.059 | |
| Remodeling index | 0.124 (0.006‒2.176) | 0.163 | |
| Lesion length | 0.972 (0.875‒1.077) | 0.591 | |
| TAV | 0.982 (0.969‒0.994) | 0.006 | |
| TAVnorm | 0.971 (0.951‒0.990) | 0.004 | |
| PAV | 0.946 (0.919‒0.972) | <0.001 | |
| HbA1c | Baseline | 1.062 (0.817‒1.383) | 0.649 |
| Mean | 1.192 (0.845‒1.705) | 0.320 | |
| Time-averaged | 1.252 (0.877‒1.827) | 0.224 | |
| TAG | Baseline | 1.536 (1.024‒2.393) | 0.046 |
| Mean | 1.826 (1.065‒3.284) | 0.034 | |
| Time-averaged | 1.674 (0.998‒2.942) | 0.059 | |
| TC | Baseline | 1.184 (0.892‒1.582) | 0.245 |
| Mean | 1.140 (0.724‒1.806) | 0.571 | |
| Time-averaged | 1.178 (0.760‒1.841) | 0.464 | |
| HDL-C | Baseline | 0.214 (0.046‒0.906) | 0.042 |
| Mean | 1.378 (0.783‒2.481) | 0.270 | |
| Time-averaged | 1.418 (0.824‒2.506) | 0.214 | |
| non-HDL-C | Baseline | 1.288 (0.957‒1.757) | 0.100 |
| Mean | 1.445 (0.877‒2.443) | 0.155 | |
| Time-averaged | 1.469 (0.905‒2.454) | 0.127 | |
| LDL-C | Baseline | 1.249 (0.901‒1.750) | 0.186 |
| Mean | 1.378 (0.783‒2.481) | 0.270 | |
| Time-averaged | 1.418 (0.824‒2.506) | 0.214 | |
| RLP-C | Baseline | 2.579 (0.861‒8.450) | 0.100 |
| Mean | 2.804 (0.641‒12.993) | 0.175 | |
| Time-averaged | 2.521 (0.612‒11.074) | 0.206 | |
| Lp(a) | Baseline | 2.431 (0.834‒7.575) | 0.110 |
| Mean | 2.383 (0.785‒7.621) | 0.130 | |
| Time-averaged | 2.417 (0.799‒7.717) | 0.123 | |
| ApoA-1 | Baseline | 0.527 (0.091‒2.921) | 0.466 |
| Mean | 0.488 (0.089‒2.542) | 0.398 | |
| Time-averaged | 0.618 (0.125‒2.937) | 0.547 | |
| ApoB | Baseline | 6.373 (1.396‒31.465) | 0.019 |
| Mean | 12.665 (1.232‒148.092) | 0.036 | |
| Time-averaged | 11.357 (1.406‒102.908) | 0.026 | |
| ApoE | Baseline | 1.598 (1.096‒2.437) | 0.020 |
| Mean | 1.457 (0.860‒2.559) | 0.172 | |
| Time-averaged | 1.474 (0.846‒2.650) | 0.179 | |
| Model | OR (95% CI) | P value |
|---|---|---|
| Model 1 | 1.284 (1.037‒1.610) | 0.025 |
| Model 2 | 1.262 (1.013‒1.589) | 0.042 |
| Model 3 | 1.885 (1.025‒3.636) | 0.048 |
Tab 5 Multivariable Logistic regression analysis of factors influencing coronary plaque progression
| Model | OR (95% CI) | P value |
|---|---|---|
| Model 1 | 1.284 (1.037‒1.610) | 0.025 |
| Model 2 | 1.262 (1.013‒1.589) | 0.042 |
| Model 3 | 1.885 (1.025‒3.636) | 0.048 |
| [1] | Ahmadi A, Argulian E, Leipsic J, et al. From subclinical atherosclerosis to plaque progression and acute coronary events JACC state-of-the-art review[J]. J Am Coll Cardiol, 2019, 74(12): 1608-1617. |
| [2] | Libby P. The changing landscape of atherosclerosis[J]. Nature, 2021, 592(7855): 524-533. |
| [3] | Bayturan O, Kapadia S, Nicholls S J, et al. Clinical predictors of plaque progression despite very low levels of low-density lipoprotein cholesterol[J]. J Am Coll Cardiol, 2010, 55(24): 2736-2742. |
| [4] | Pontone G, Rossi A, Baggiano A, et al. Progression of non-obstructive coronary plaque: a practical CCTA-based risk score from the PARADIGM registry[J]. Eur Radiol, 2024, 34(4): 2665-2676. |
| [5] | Neglia D, Caselli C, Maffei E, et al. Rapid plaque progression is independently associated with hyperglycemia and low HDL cholesterol in patients with stable coronary artery disease: a PARADIGM study[J]. Circ Cardiovasc Imaging, 2024, 17(7): e016481. |
| [6] | Nissen S E, Tuzcu E M, Schoenhagen P, et al. Statin therapy, LDL cholesterol, C-reactive protein, and coronary artery disease[J]. N Engl J Med, 2005, 352(1): 29-38. |
| [7] | Welty F K, Hariri E, Asbeutah A A, et al. Regression of coronary fatty plaque and risk of cardiac events according to blood pressure status: data from a randomized trial of eicosapentaenoic acid and docosahexaenoic acid in patients with coronary artery disease[J]. J Am Heart Assoc, 2023, 12(18): e030071. |
| [8] | Castañer O, Pintó X, Subirana I, et al. Remnant cholesterol, not LDL cholesterol, is associated with incident cardiovascular disease[J]. J Am Coll Cardiol, 2020, 76(23): 2712-2724. |
| [9] | Hagström E, Steg P G, Szarek M, et al. Apolipoprotein B, residual cardiovascular risk after acute coronary syndrome, and effects of alirocumab[J]. Circulation, 2022, 146(9): 657-672. |
| [10] | Marston N A, Giugliano R P, Melloni G E M, et al. Association of apolipoprotein B-containing lipoproteins and risk of myocardial infarction in individuals with and without atherosclerosis: distinguishing between particle concentration, type, and content[J]. JAMA Cardiol, 2022, 7(3): 250-256. |
| [11] | Johannesen C D L, Langsted A, Nordestgaard B G, et al. Excess apolipoprotein B and cardiovascular risk in women and men[J]. J Am Coll Cardiol, 2024, 83(23): 2262-2273. |
| [12] | Faridi K F, Lahan S, Budoff M J, et al. Serum lipoproteins are associated with coronary atherosclerosis in asymptomatic U.S. adults without traditional risk factors[J]. JACC Adv, 2024, 3(7): 101049. |
| [13] | Mach F, Baigent C, Catapano A L, et al. 2019 ESC/EAS Guidelines for the management of dyslipidaemias: lipid modification to reduce cardiovascular risk[J]. Eur Heart J, 2020, 41(1): 111-188. |
| [14] | Sniderman A D, Dufresne L, Pencina K M, et al. Discordance among apoB, non-high-density lipoprotein cholesterol, and triglycerides: implications for cardiovascular prevention[J]. Eur Heart J, 2024, 45(27): 2410-2418. |
| [15] | Mintz G S, Nissen S E, Anderson W D, et al. American college of cardiology clinical expert consensus document on standards for acquisition, measurement and reporting of intravascular ultrasound studies (IVUS). a report of the American college of cardiology task force on clinical expert consensus documents[J]. J Am Coll Cardiol, 2001, 37(5): 1478-1492. |
| [16] | Maehara A, Cristea E, Mintz G S, et al. Definitions and methodology for the grayscale and radiofrequency intravascular ultrasound and coronary angiographic analyses[J]. JACC Cardiovasc Imaging, 2012, 5(3 Suppl): S1-S9. |
| [17] | Garcia-Garcia H M, Costa M A, Serruys P W. Imaging of coronary atherosclerosis: intravascular ultrasound[J]. Eur Heart J, 2010, 31(20): 2456-2469. |
| [18] | Vesterbekkmo E K, Aksetøy I A, Follestad T, et al. High-intensity interval training induces beneficial effects on coronary atheromatous plaques: a randomized trial[J]. Eur J Prev Cardiol, 2023, 30(5): 384-392. |
| [19] | Xiao J Y, Padrick M M, Jiang T, et al. Acute ischemic stroke versus transient ischemic attack: differential plaque morphological features in symptomatic intracranial atherosclerotic lesions[J]. Atherosclerosis, 2021, 319: 72-78. |
| [20] | Melina G, Angeloni E, Refice S, et al. Clinical SYNTAX score predicts outcomes of patients undergoing coronary artery bypass grafting[J]. Am Heart J, 2017, 188: 118-126. |
| [21] | Rampidis G P, Benetos G, Benz D C, et al. A guide for gensini score calculation[J]. Atherosclerosis, 2019, 287: 181-183. |
| [22] | van Rosendael A R, Lin F Y, van den Hoogen I J, et al. Progression of whole-heart atherosclerosis by coronary CT and major adverse cardiovascular events[J]. J Cardiovasc Comput Tomogr, 2021, 15(4): 322-330. |
| [23] | Nicholls S J, Hsu A, Wolski K, et al. Intravascular ultrasound-derived measures of coronary atherosclerotic plaque burden and clinical outcome[J]. J Am Coll Cardiol, 2010, 55(21): 2399-2407. |
| [24] | Puri R, Nissen S E, Ballantyne C M, et al. Factors underlying regression of coronary atheroma with potent statin therapy[J]. Eur Heart J, 2013, 34(24): 1818-1825. |
| [25] | Pencina M J, D′Agostino R B, Zdrojewski T, et al. Apolipoprotein B improves risk assessment of future coronary heart disease in the Framingham Heart Study beyond LDL-C and non-HDL-C[J]. Eur J Prev Cardiol, 2015, 22(10): 1321-1327. |
| [26] | Clark D 3rd, Nicholls S J, St John J, et al. Visit-to-visit cholesterol variability correlates with coronary atheroma progression and clinical outcomes[J]. Eur Heart J, 2018, 39(27): 2551-2558. |
| [27] | Polewczyk A, Janion M, Gasior M, et al. Benefits from revascularisation therapy in the elderly with acute myocardial infarction. Comparative analysis of patients hospitalised in 1992-1996 and in 2005-2006[J]. Kardiol Pol, 2010, 68(8): 873-881. |
| [28] | Shanmugasundaram M. Percutaneous coronary intervention in elderly patients: is it beneficial [J]. Tex Heart Inst J, 2011, 38(4): 398-403. |
| [1] | Yingchao TAN, Junyue YANG, Lina WANG. Association between interleukin-1B-511C/T gene polymorphism and coronary atherosclerotic heart disease: a meta-analysis [J]. JOURNAL OF SHANGHAI JIAOTONG UNIVERSITY (MEDICAL SCIENCE), 2022, 42(2): 197-204. |
| [2] | Qian ZHAO, Lin GAO, Chang-qian WANG, Jun-feng ZHANG, Hui-li ZHANG, Yang ZHUO. Changes and significance of CX3CR1 expression in peripheral blood monocyte subsets in patients with coronary atherosclerotic heart disease [J]. JOURNAL OF SHANGHAI JIAOTONG UNIVERSITY (MEDICAL SCIENCE), 2021, 41(3): 328-333. |
| [3] | SU Hai-xia, ZHU Ya-qin, ZHANG Tian-kuang, ZHANG Hui-li, GU Jun. Distribution characteristics of fragmented QRS in patients with coronary atherosclerotic heart disease and its relationship with left ventricular remodeling [J]. , 2019, 39(10): 1162-. |
| [4] | LUO Cong-cong1,BAO Chun-rong2,HE Bin1. Clinical advances in monoclonal antibody against PCSK9 for coronary atherosclerotic heart disease [J]. , 2018, 38(3): 339-. |
| Viewed | ||||||
|
Full text |
|
|||||
|
Abstract |
|
|||||