Journal of Shanghai Jiao Tong University (Medical Science) ›› 2026, Vol. 46 ›› Issue (5): 633-641.doi: 10.3969/j.issn.1674-8115.2026.05.009
• Clinical research • Previous Articles
Deng Yincan( ), Chen Jing, Wang Linying, Guo Xuejing, Qian Xubo, Zhu Dan
Received:2025-07-16
Accepted:2025-12-30
Online:2026-05-28
Published:2026-05-28
Contact:
Deng Yincan
E-mail:470741954@qq.com
Supported by:CLC Number:
Deng Yincan, Chen Jing, Wang Linying, Guo Xuejing, Qian Xubo, Zhu Dan. Value of T-cell mitochondrial damage index in predicting the risk of acute exacerbation of chronic obstructive pulmonary disease[J]. Journal of Shanghai Jiao Tong University (Medical Science), 2026, 46(5): 633-641.
Add to citation manager EndNote|Ris|BibTeX
URL: https://xuebao.shsmu.edu.cn/EN/10.3969/j.issn.1674-8115.2026.05.009
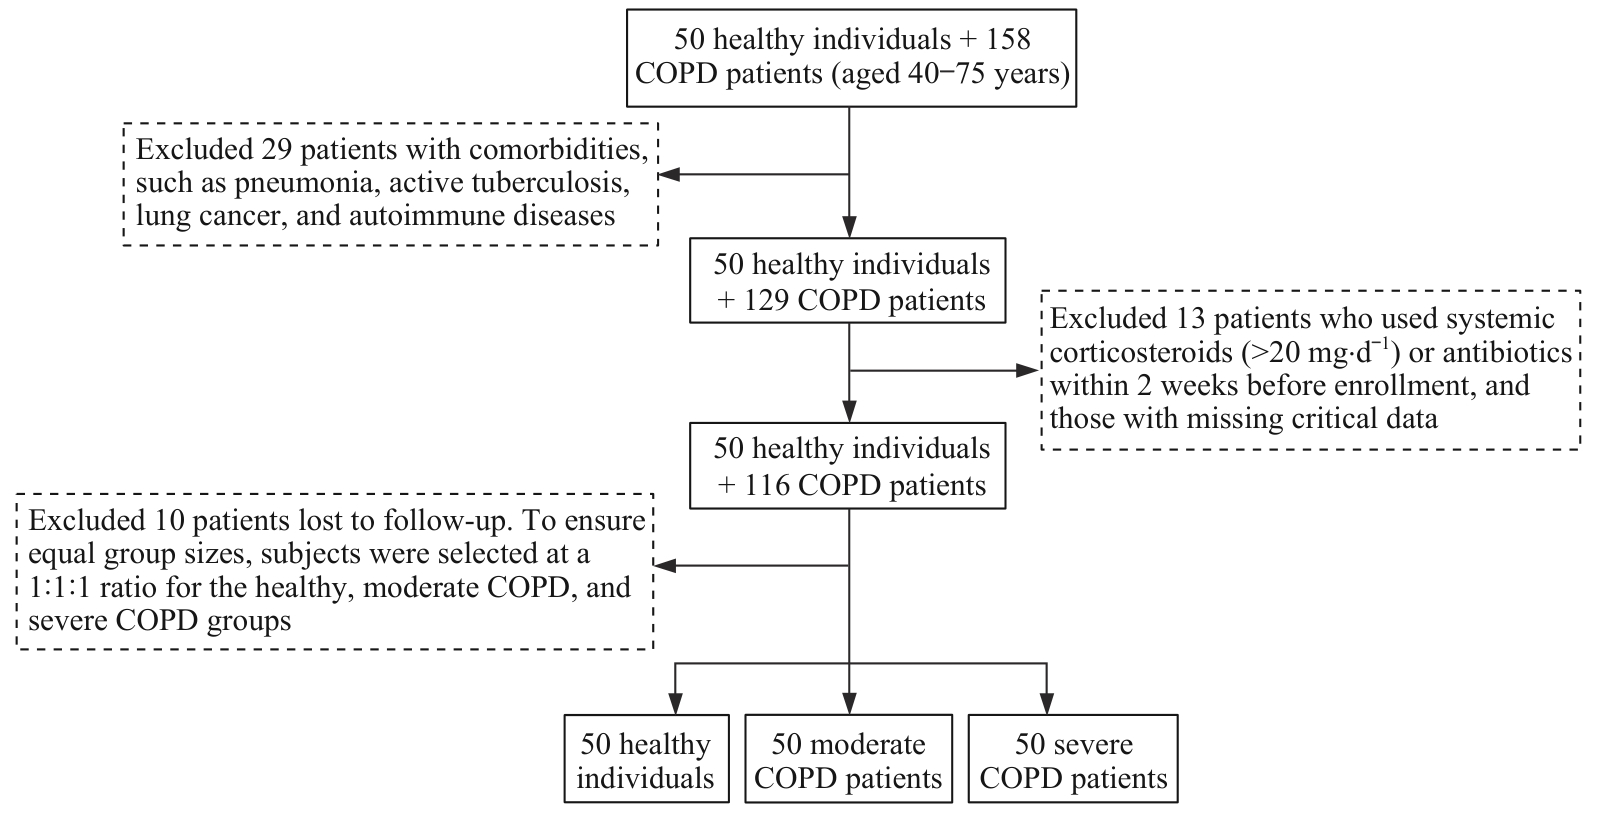
Fig 1 Flowchart for screening of study subjects
| Item | Control group (n=50) | Moderate COPD group (n=50) | Severe COPD group (n=50) | t/F/Z/χ2 value | P value |
|---|---|---|---|---|---|
| Age/year | 59.38±7.50 | 65.66±7.59# | 66.64±5.80# | 15.774 | <0.001 |
| Male/n(%) | 40 (80.00) | 44 (88.00) | 41 (82.00) | 1.248 | 0.536 |
| Smoking/n(%) | 8 (16.00) | 33 (66.00) | 40 (80.00) | 41.451 | <0.001 |
| FEV1/L | 2.77±0.63 | 1.58±0.29# | 0.94±0.22#* | 243.105 | <0.001 |
| CAT score/score | ‒ | 18±2 | 27±3 | 16.156 | <0.001 |
| IL-2/(pg·mL-1) | 3.15 (1.66, 4.28) | 1.96 (1.11, 3.71)# | 2.01 (1.13, 2.81)# | 8.600 | 0.014 |
| IL-4/(pg·mL-1) | 4.02 (2.80, 5.37) | 1.27 (0.71, 1.82)# | 1.42 (0.90, 1.70)# | 67.170 | <0.001 |
| IL-6/(pg·mL-1) | 2.41 (1.39, 3.62) | 1.89 (0.87, 5.27) | 1.61 (1.14, 2.34) | 2.671 | 0.263 |
| IL-8/(pg·mL-1) | 2.30 (1.77, 3.87) | 2.15 (0.03, 6.31) | 1.48 (0.01, 3.34) | 5.383 | 0.068 |
| IL-10/(pg·mL-1) | 2.74 (1.46, 5.65) | 1.45 (0.79, 2.30)# | 1.60 (1.42, 1.99)# | 19.710 | <0.001 |
| IL-17/(pg·mL-1) | 2.64 (1.66, 5.22) | 1.96 (1.13, 3.21) | 2.19 (1.62, 3.05) | 5.044 | 0.080 |
| TNF-α/(pg·mL-1) | 3.11 (1.85, 5.59) | 1.15 (0.04, 1.77)# | 1.38 (0.42, 1.82)# | 52.177 | <0.001 |
| IFN-γ/(pg·mL-1) | 2.91 (1.70, 5.24) | 2.45 (1.19, 3.88) | 2.77 (1.61, 3.81) | 3.722 | 0.156 |
| CD3+ T absolute count/μL | 1 031.50 (819.25, 1 309.00) | 880.65 (643.48, 1 365.14) | 913.09 (643.21, 1 128.30) | 2.837 | 0.242 |
| CD3+CD4+ T absolute count/μL | 573.50 (448.25, 744.75) | 566.68 (320.86, 824.50) | 535.72 (373.98, 672.43) | 0.736 | 0.692 |
| CD3+CD8+ T absolute count/μL | 363.50 (261.25, 460.00) | 293.87 (194.05, 428.98) | 285.51 (196.94, 454.26) | 2.066 | 0.356 |
| CD4+/CD8+ T ratio | 1.64 (1.28, 2.19) | 1.75 (1.29, 2.52) | 1.67 (1.17, 2.34) | 0.734 | 0.693 |
| CD3+ T MDI/n(%) | 50.267 | <0.001 | |||
| Normal | 49 (98.00) | 24 (48.00)# | 17 (34.00)# | ||
| Mild damage | 1 (2.00) | 10 (20.00) | 19 (38.00) | ||
| Severe damage | 0 (0) | 16 (32.00) | 14 (28.00) | ||
| CD3+CD4+ T MDI/n(%) | 55.779 | <0.001 | |||
| Normal | 49 (98.00) | 22 (44.00)# | 14 (28.00)# | ||
| Mild damage | 1 (2.00) | 24 (48.00) | 28 (56.00) | ||
| Severe damage | 0 (0) | 4 (8.00) | 8 (16.00) | ||
| CD3+CD8+ T MDI/n(%) | 63.779 | <0.001 | |||
| Normal | 49 (98.00) | 25 (50.00)# | 10 (20.00)# | ||
| Mild damage | 1 (2.00) | 18 (36.00) | 25 (50.00) | ||
| Severe damage | 0 (0) | 7 (14.00) | 15 (30.00)* |
Tab 1 Comparison of baseline characteristics among the three groups
| Item | Control group (n=50) | Moderate COPD group (n=50) | Severe COPD group (n=50) | t/F/Z/χ2 value | P value |
|---|---|---|---|---|---|
| Age/year | 59.38±7.50 | 65.66±7.59# | 66.64±5.80# | 15.774 | <0.001 |
| Male/n(%) | 40 (80.00) | 44 (88.00) | 41 (82.00) | 1.248 | 0.536 |
| Smoking/n(%) | 8 (16.00) | 33 (66.00) | 40 (80.00) | 41.451 | <0.001 |
| FEV1/L | 2.77±0.63 | 1.58±0.29# | 0.94±0.22#* | 243.105 | <0.001 |
| CAT score/score | ‒ | 18±2 | 27±3 | 16.156 | <0.001 |
| IL-2/(pg·mL-1) | 3.15 (1.66, 4.28) | 1.96 (1.11, 3.71)# | 2.01 (1.13, 2.81)# | 8.600 | 0.014 |
| IL-4/(pg·mL-1) | 4.02 (2.80, 5.37) | 1.27 (0.71, 1.82)# | 1.42 (0.90, 1.70)# | 67.170 | <0.001 |
| IL-6/(pg·mL-1) | 2.41 (1.39, 3.62) | 1.89 (0.87, 5.27) | 1.61 (1.14, 2.34) | 2.671 | 0.263 |
| IL-8/(pg·mL-1) | 2.30 (1.77, 3.87) | 2.15 (0.03, 6.31) | 1.48 (0.01, 3.34) | 5.383 | 0.068 |
| IL-10/(pg·mL-1) | 2.74 (1.46, 5.65) | 1.45 (0.79, 2.30)# | 1.60 (1.42, 1.99)# | 19.710 | <0.001 |
| IL-17/(pg·mL-1) | 2.64 (1.66, 5.22) | 1.96 (1.13, 3.21) | 2.19 (1.62, 3.05) | 5.044 | 0.080 |
| TNF-α/(pg·mL-1) | 3.11 (1.85, 5.59) | 1.15 (0.04, 1.77)# | 1.38 (0.42, 1.82)# | 52.177 | <0.001 |
| IFN-γ/(pg·mL-1) | 2.91 (1.70, 5.24) | 2.45 (1.19, 3.88) | 2.77 (1.61, 3.81) | 3.722 | 0.156 |
| CD3+ T absolute count/μL | 1 031.50 (819.25, 1 309.00) | 880.65 (643.48, 1 365.14) | 913.09 (643.21, 1 128.30) | 2.837 | 0.242 |
| CD3+CD4+ T absolute count/μL | 573.50 (448.25, 744.75) | 566.68 (320.86, 824.50) | 535.72 (373.98, 672.43) | 0.736 | 0.692 |
| CD3+CD8+ T absolute count/μL | 363.50 (261.25, 460.00) | 293.87 (194.05, 428.98) | 285.51 (196.94, 454.26) | 2.066 | 0.356 |
| CD4+/CD8+ T ratio | 1.64 (1.28, 2.19) | 1.75 (1.29, 2.52) | 1.67 (1.17, 2.34) | 0.734 | 0.693 |
| CD3+ T MDI/n(%) | 50.267 | <0.001 | |||
| Normal | 49 (98.00) | 24 (48.00)# | 17 (34.00)# | ||
| Mild damage | 1 (2.00) | 10 (20.00) | 19 (38.00) | ||
| Severe damage | 0 (0) | 16 (32.00) | 14 (28.00) | ||
| CD3+CD4+ T MDI/n(%) | 55.779 | <0.001 | |||
| Normal | 49 (98.00) | 22 (44.00)# | 14 (28.00)# | ||
| Mild damage | 1 (2.00) | 24 (48.00) | 28 (56.00) | ||
| Severe damage | 0 (0) | 4 (8.00) | 8 (16.00) | ||
| CD3+CD8+ T MDI/n(%) | 63.779 | <0.001 | |||
| Normal | 49 (98.00) | 25 (50.00)# | 10 (20.00)# | ||
| Mild damage | 1 (2.00) | 18 (36.00) | 25 (50.00) | ||
| Severe damage | 0 (0) | 7 (14.00) | 15 (30.00)* |
| Item | AE group (n=46) | Non-AE group (n=54) | t/Z/χ² value | P value |
|---|---|---|---|---|
| Age/year | 67.13±5.70 | 65.31±7.47 | 1.348 | 0.181 |
| Male/n(%) | 42 (91.30) | 43 (79.63) | 1.819 | 0.177 |
| Smoking/n(%) | 35 (76.08) | 36 (66.67) | 1.071 | 0.301 |
| COPD/n(%) | 4.026 | 0.045 | ||
| Moderate | 18 (39.13) | 32 (59.26) | ||
| Severe | 28 (60.87) | 22 (40.74) | ||
| Baseline FEV1/L | 1.10±0.37 | 1.40±0.38 | 3.908 | <0.001 |
| ΔFEV1/L | -0.03 (-0.12, 0.09) | 0.12 (0.06, 0.26) | 22.311 | <0.001 |
| Baseline CAT score/score | 25±5 | 21±4 | 4.135 | <0.001 |
| ΔCAT score/score | 7 (4, 9) | 9 (7, 11) | 10.099 | 0.001 |
| IL-2/(pg·mL-1) | 2.08 (1.41, 3.09) | 1.93 (1.01, 2.95) | 0.741 | 0.389 |
| IL-4/(pg·mL-1) | 1.45 (0.95, 1.81) | 1.16 (0.84, 1.74) | 1.971 | 0.160 |
| IL-10/(pg·mL-1) | 1.55 (1.21, 2.03) | 1.56 (1.07, 2.30) | 0.153 | 0.696 |
| TNF-α/(pg·mL-1) | 1.45 (0.77, 1.96) | 1.11 (0.04, 1.50) | 2.914 | 0.088 |
| CD3+ T absolute count/μL | 932.26 (609.06, 1 229.28) | 880.65 (594.97, 1 114.72) | 0.553 | 0.580 |
| CD3+CD4+ T absolute count/μL | 528.69 (372.02, 796.94) | 568.74 (393.69, 727.02) | 0.367 | 0.714 |
| CD3+CD8+ T absolute count/μL | 323.83 (207.97, 447.78) | 265.47 (233.07, 421.11) | 0.844 | 0.399 |
| CD4+/CD8+ T ratio | 1.68 (1.43, 2.33) | 1.95 (1.49, 2.82) | 0.470 | 0.638 |
| CD3+ T MDI/n(%) | 15.047 | <0.001 | ||
| Normal | 10 (21.74) | 31 (57.41) | ||
| Mild damage | 15 (32.61) | 14 (25.92) | ||
| Severe damage | 21 (45.65) | 9 (16.67) | ||
| CD3+CD4+ T MDI/n(%) | 15.291 | <0.001 | ||
| Normal | 10 (21.74) | 26 (48.15) | ||
| Mild damage | 26 (56.52) | 27 (50.00) | ||
| Severe damage | 10 (21.74) | 1 (1.85) | ||
| CD3+CD8+ T MDI/n(%) | 25.390 | <0.001 | ||
| Normal | 7 (15.22) | 30 (55.56) | ||
| Mild damage | 20 (43.48) | 20 (37.03) | ||
| Severe damage | 19 (41.30) | 4 (7.41) |
Tab 2 Comparison of baseline characteristics between COPD patients with and without acute exacerbations
| Item | AE group (n=46) | Non-AE group (n=54) | t/Z/χ² value | P value |
|---|---|---|---|---|
| Age/year | 67.13±5.70 | 65.31±7.47 | 1.348 | 0.181 |
| Male/n(%) | 42 (91.30) | 43 (79.63) | 1.819 | 0.177 |
| Smoking/n(%) | 35 (76.08) | 36 (66.67) | 1.071 | 0.301 |
| COPD/n(%) | 4.026 | 0.045 | ||
| Moderate | 18 (39.13) | 32 (59.26) | ||
| Severe | 28 (60.87) | 22 (40.74) | ||
| Baseline FEV1/L | 1.10±0.37 | 1.40±0.38 | 3.908 | <0.001 |
| ΔFEV1/L | -0.03 (-0.12, 0.09) | 0.12 (0.06, 0.26) | 22.311 | <0.001 |
| Baseline CAT score/score | 25±5 | 21±4 | 4.135 | <0.001 |
| ΔCAT score/score | 7 (4, 9) | 9 (7, 11) | 10.099 | 0.001 |
| IL-2/(pg·mL-1) | 2.08 (1.41, 3.09) | 1.93 (1.01, 2.95) | 0.741 | 0.389 |
| IL-4/(pg·mL-1) | 1.45 (0.95, 1.81) | 1.16 (0.84, 1.74) | 1.971 | 0.160 |
| IL-10/(pg·mL-1) | 1.55 (1.21, 2.03) | 1.56 (1.07, 2.30) | 0.153 | 0.696 |
| TNF-α/(pg·mL-1) | 1.45 (0.77, 1.96) | 1.11 (0.04, 1.50) | 2.914 | 0.088 |
| CD3+ T absolute count/μL | 932.26 (609.06, 1 229.28) | 880.65 (594.97, 1 114.72) | 0.553 | 0.580 |
| CD3+CD4+ T absolute count/μL | 528.69 (372.02, 796.94) | 568.74 (393.69, 727.02) | 0.367 | 0.714 |
| CD3+CD8+ T absolute count/μL | 323.83 (207.97, 447.78) | 265.47 (233.07, 421.11) | 0.844 | 0.399 |
| CD4+/CD8+ T ratio | 1.68 (1.43, 2.33) | 1.95 (1.49, 2.82) | 0.470 | 0.638 |
| CD3+ T MDI/n(%) | 15.047 | <0.001 | ||
| Normal | 10 (21.74) | 31 (57.41) | ||
| Mild damage | 15 (32.61) | 14 (25.92) | ||
| Severe damage | 21 (45.65) | 9 (16.67) | ||
| CD3+CD4+ T MDI/n(%) | 15.291 | <0.001 | ||
| Normal | 10 (21.74) | 26 (48.15) | ||
| Mild damage | 26 (56.52) | 27 (50.00) | ||
| Severe damage | 10 (21.74) | 1 (1.85) | ||
| CD3+CD8+ T MDI/n(%) | 25.390 | <0.001 | ||
| Normal | 7 (15.22) | 30 (55.56) | ||
| Mild damage | 20 (43.48) | 20 (37.03) | ||
| Severe damage | 19 (41.30) | 4 (7.41) |
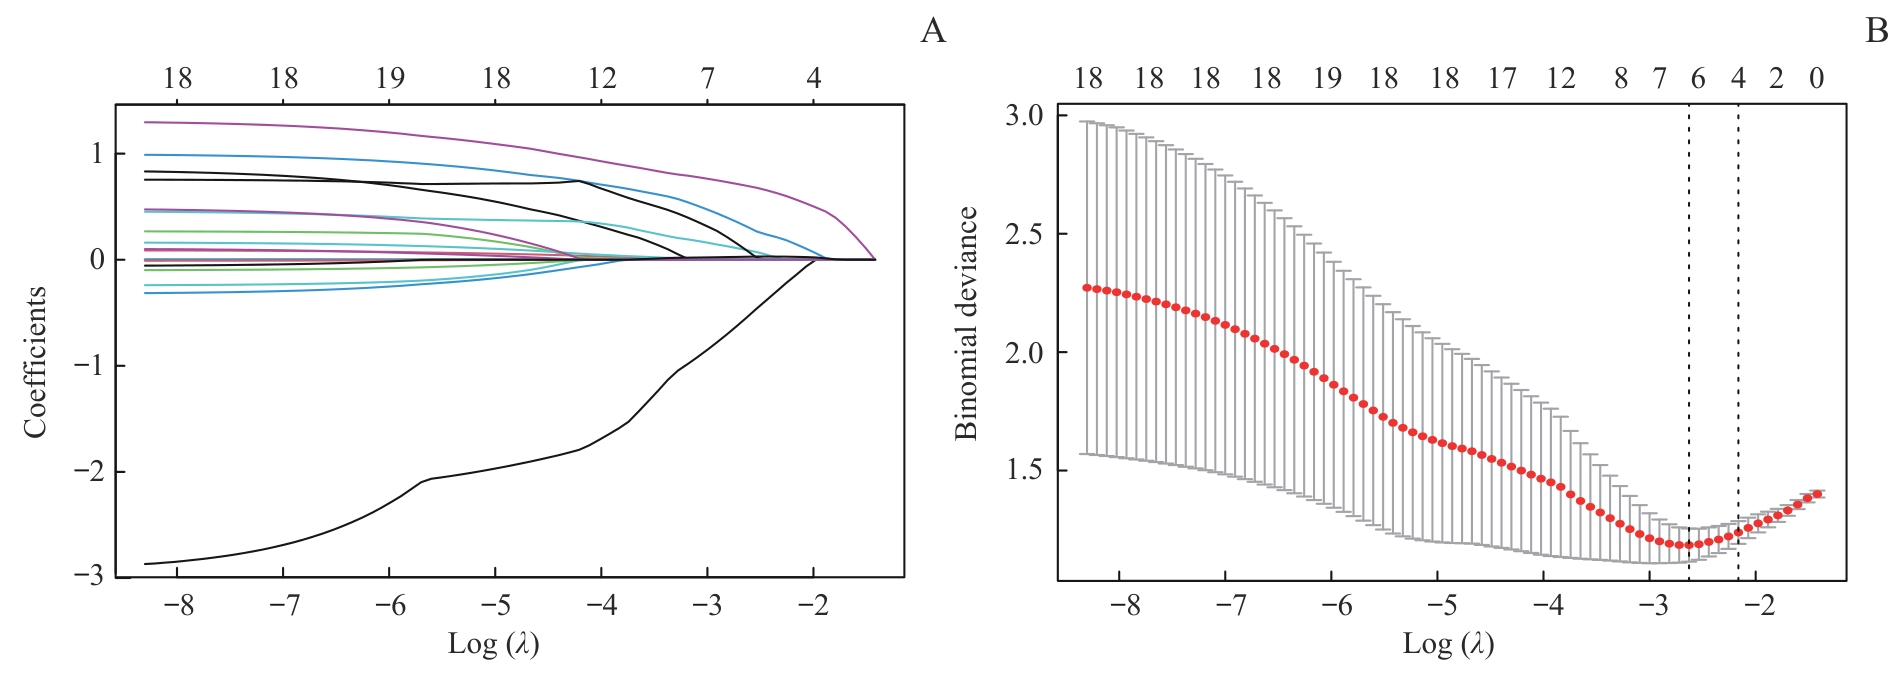
Fig 2 Screening of risk predictors for AECOPD using LASSO regression
| Variable | Univariate Logistic regression analysis | Multivariate Logistic regression analysis | ||
|---|---|---|---|---|
| OR (95%CI) | P value | OR (95%CI) | P value | |
| FEV1 | 0.13 (0.04‒0.40) | <0.001 | 0.24 (0.02‒0.64) | 0.035 |
| CAT score | 1.18 (1.08‒1.29) | <0.001 | 1.12 (1.06‒1.28) | 0.025 |
| CD3+ T MDI | ||||
| Normal | 1.00 | ‒ | 1.00 | ‒ |
| Mild damage | 3.32 (1.20‒9.20) | 0.021 | 1.93 (1.34‒6.35) | 0.041 |
| Severe damage | 7.23 (2.51‒20.82) | <0.001 | 4.41 (1.21‒16.08) | 0.024 |
| CD3+CD8+ T MDI | ||||
| Normal | 1.00 | ‒ | 1.00 | ‒ |
| Mild damage | 4.29 (1.53‒12.01) | 0.006 | 3.18 (1.04‒9.76) | 0.043 |
| Severe damage | 20.36 (5.25‒79.02) | <0.001 | 8.83 (2.00‒38.96) | 0.004 |
Tab 3 Univariate and multivariate Logistic regression analyses of predictors for AECOPD
| Variable | Univariate Logistic regression analysis | Multivariate Logistic regression analysis | ||
|---|---|---|---|---|
| OR (95%CI) | P value | OR (95%CI) | P value | |
| FEV1 | 0.13 (0.04‒0.40) | <0.001 | 0.24 (0.02‒0.64) | 0.035 |
| CAT score | 1.18 (1.08‒1.29) | <0.001 | 1.12 (1.06‒1.28) | 0.025 |
| CD3+ T MDI | ||||
| Normal | 1.00 | ‒ | 1.00 | ‒ |
| Mild damage | 3.32 (1.20‒9.20) | 0.021 | 1.93 (1.34‒6.35) | 0.041 |
| Severe damage | 7.23 (2.51‒20.82) | <0.001 | 4.41 (1.21‒16.08) | 0.024 |
| CD3+CD8+ T MDI | ||||
| Normal | 1.00 | ‒ | 1.00 | ‒ |
| Mild damage | 4.29 (1.53‒12.01) | 0.006 | 3.18 (1.04‒9.76) | 0.043 |
| Severe damage | 20.36 (5.25‒79.02) | <0.001 | 8.83 (2.00‒38.96) | 0.004 |
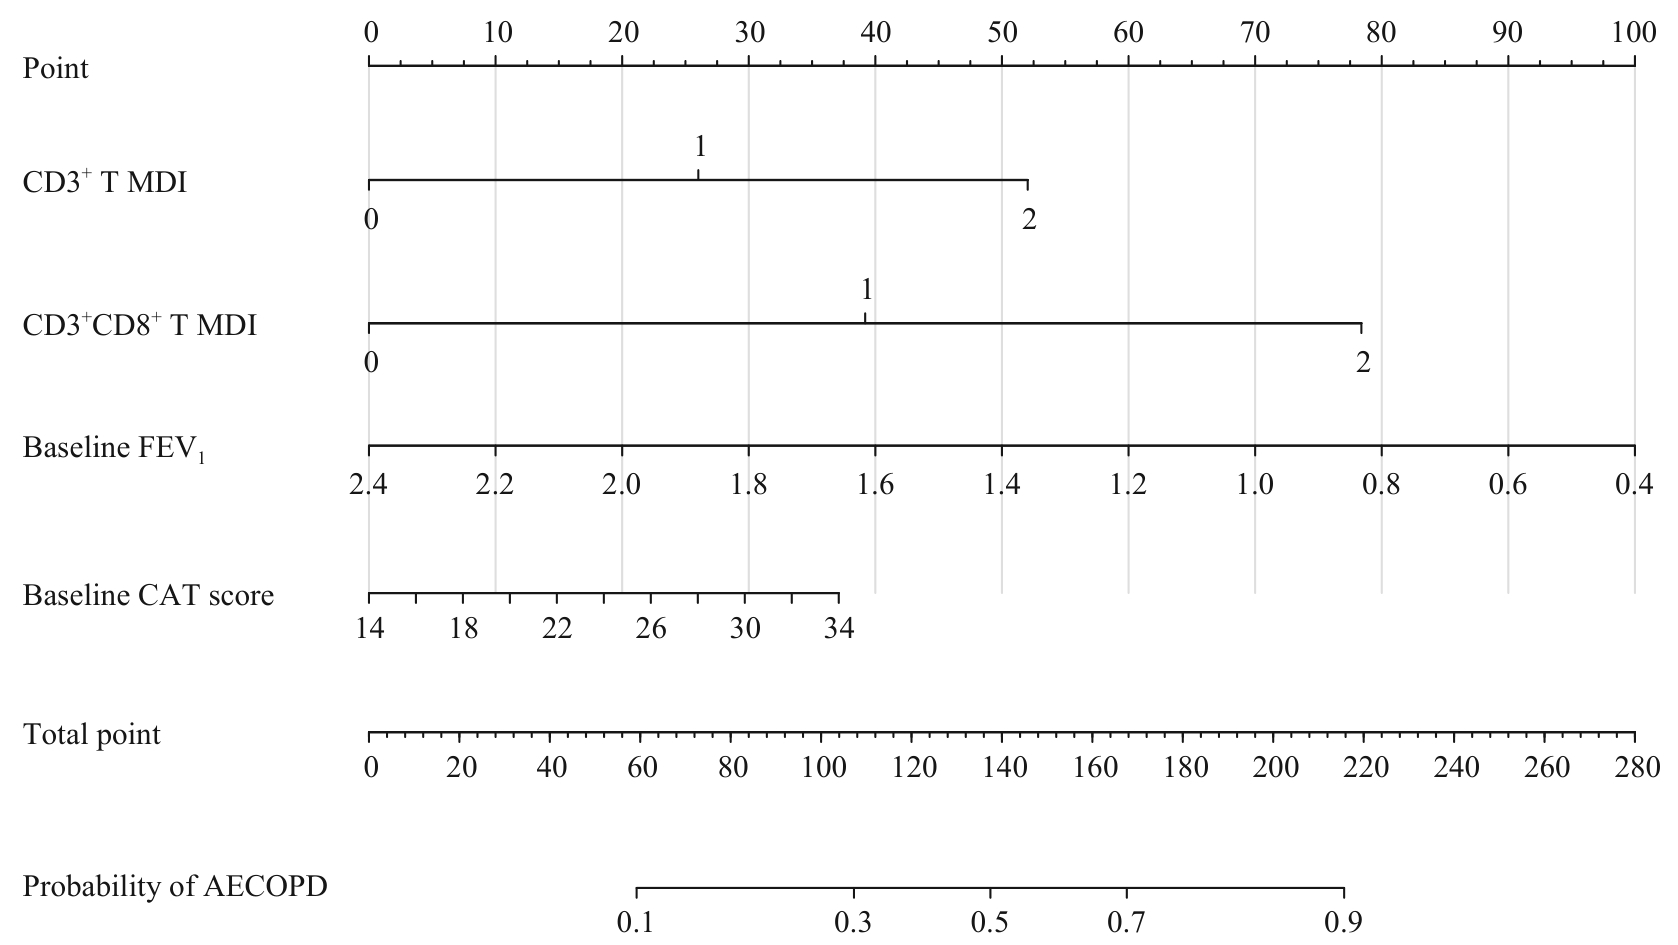
Fig 3 Nomogram for risk assessment of AECOPD
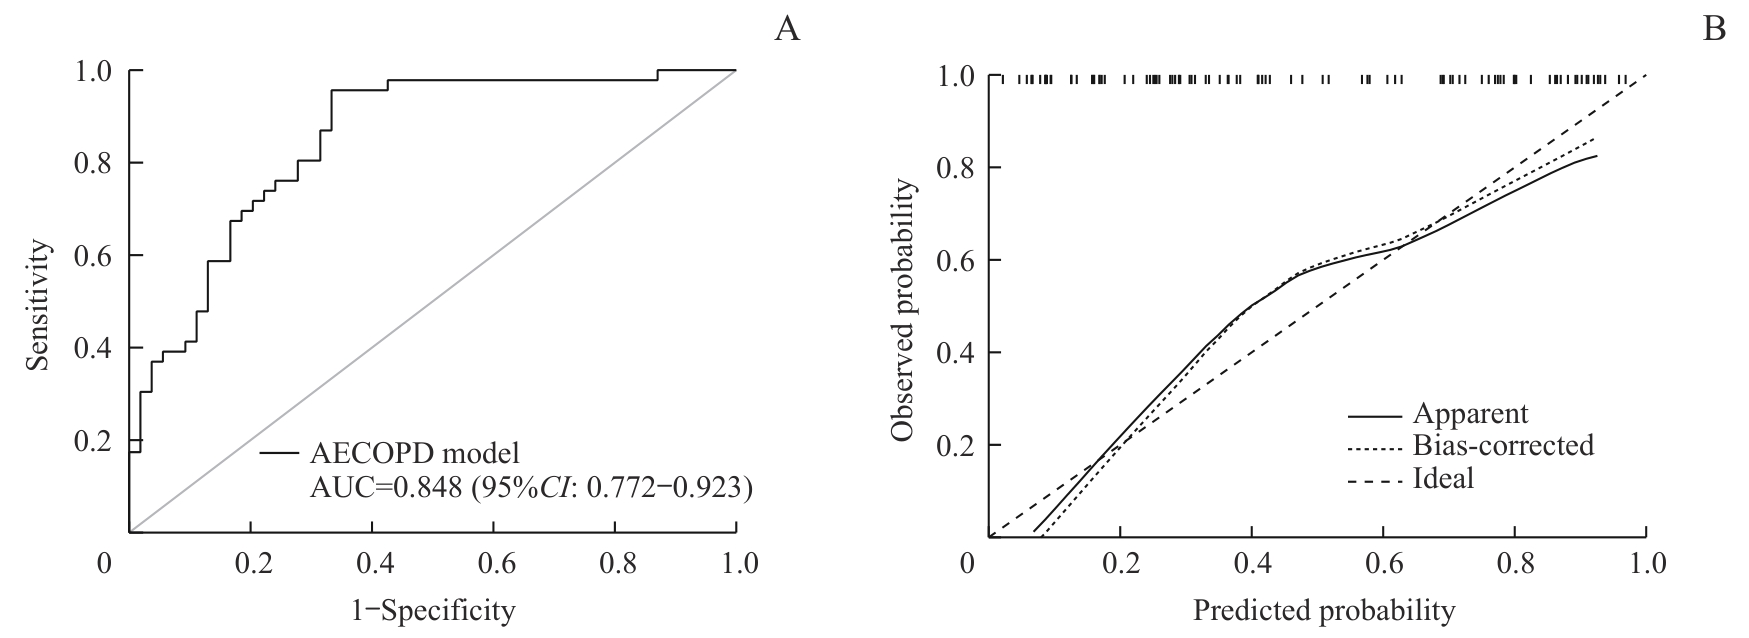
Fig 4 ROC curve (A) and calibration curve (B) analyses of the AECOPD prediction model
| [1] | Wang C, Xu J Y, Yang L, et al. Prevalence and risk factors of chronic obstructive pulmonary disease in China (the China Pulmonary Health [CPH] study): a national cross-sectional study[J]. Lancet, 2018, 391(10131): 1706-1717. |
| [2] | 张前豹, 施斌, 王小雨, 等. 无创呼吸机治疗COPD急性加重期老年患者发生抗生素相关腹泻的危险因素分析[J]. 重庆医学, 2024, 53(16): 2458-2461. |
| Zhang Q B, Shi B, Wang X Y, et al. Analysis on risk factors of antibiotic related diarrhea occurrence in elderly patients with acute exacerbation of COPD treated by non-invasive ventilator[J]. Chongqing Medical Journal, 2024, 53(16): 2458-2461. | |
| [3] | 孔德昭, 王科雯, 罗文晔, 等. 慢性阻塞性肺疾病急性加重期诊疗指南评价与综合分析[J]. 中国中医基础医学杂志, 2023, 29(8): 1307-1317. |
| Kong D Z, Wang K W, Luo W Y, et al. Evaluation and comprehensive analysis of diagnostic and treatment guidelines for acute exacerbation of chronic obstructive pulmonary disease[J]. Journal of Basic Chinese Medicine, 2023, 29(8): 1307-1317. | |
| [4] | 中华医学会呼吸病学分会慢性阻塞性肺疾病学组, 中国医师协会呼吸医师分会慢性阻塞性肺疾病工作委员会. 慢性阻塞性肺疾病诊治指南(2021年修订版)[J]. 中华结核和呼吸杂志, 2021, 44(3): 170-205. |
| Chronic Obstructive Pulmonary Disease Group of Chinese Thoracic Society, Chronic Obstructive Pulmonary Disease Committee of Chinese Association of Chest Physician. Guidelines for the diagnosis and management of chronic obstructive pulmonary disease (revised version 2021)[J]. Chinese Journal of Tuberculosis and Respiratory Diseases, 2021, 44(3): 170-205. | |
| [5] | GBD 2016 Causes of Death Collaborators. Global, regional, and national age-sex specific mortality for 264 causes of death, 1980-2016: a systematic analysis for the Global Burden of Disease Study 2016[J]. Lancet, 2017, 390(10100): 1151-1210. |
| [6] | Zhou M G, Wang H D, Zeng X Y, et al. Mortality, morbidity, and risk factors in China and its provinces, 1990-2017: a systematic analysis for the Global Burden of Disease Study 2017[J]. Lancet, 2019, 394(10204): 1145-1158. |
| [7] | 吴玉兰, 陈周慰, 杨雪敏, 等. 慢性阻塞性肺疾病稳定期患者营养状况与CAT评分、肺功能的相关性及其风险预测Nomogram模型构建[J]. 临床肺科杂志, 2025, 30(6): 901-906. |
| Wu Y L, Chen Z W, Yang X M, et al. Correlation between nutritional status and CAT score, pulmonary function, and risk prediction Nomogram model construction in stable COPD patients[J]. Journal of Clinical Pulmonary Medicine, 2025, 30(6): 901-906. | |
| [8] | Soeroto A Y, Setiawan D, Asriputri N N, et al. Association between vitamin D levels and FEV1, number of exacerbations, and CAT score in stable COPD patients in Indonesia[J]. Int J Gen Med, 2021, 14: 7293-7297. |
| [9] | Phillips K M, Lavere P F, Hanania N A, et al. The emerging biomarkers in chronic obstructive pulmonary disease: a narrative review[J]. Diagnostics, 2025, 15(10): 1245. |
| [10] | Gonçalves I, Guimarães M J, van Zeller M, et al. Clinical and molecular markers in COPD[J]. Pulmonology, 2018, 24(4): 250-259. |
| [11] | Barnes P J. COPD 2020: new directions needed[J]. Am J Physiol Lung Cell Mol Physiol, 2020, 319(5): L884-L886. |
| [12] | 林江涛. 呼吸内科学科进展报告[M]. 北京: 人民卫生出版社, 2014: 129-130. |
| Lin J T. Progress report on respiratory medicine[M]. Beijing: People′s Medical Publishing House, 2014: 129-130. | |
| [13] | Tan D B A, Fernandez S, Price P, et al. Impaired function of regulatory T-cells in patients with chronic obstructive pulmonary disease (COPD)[J]. Immunobiology, 2014, 219(12): 975-979. |
| [14] | Belk J A, Daniel B, Satpathy A T. Epigenetic regulation of T cell exhaustion[J]. Nat Immunol, 2022, 23(6): 848-860. |
| [15] | Franco F, Jaccard A, Romero P, et al. Metabolic and epigenetic regulation of T-cell exhaustion[J]. Nat Metab, 2020, 2(10): 1001-1012. |
| [16] | 张怡, 李超, 张烈, 等. 慢阻肺患者运动负荷气道反应性与T细胞亚群的关系[J]. 现代生物医学进展, 2022, 22(24): 4710-4713, 4699. |
| Zhang Y, Li C, Zhang L, et al. The relationship between exercise load airway responsiveness and T cell subsets in patients with chronic obstructive pulmonary disease[J]. Progress in Modern Biomedicine, 2022, 22(24): 4710-4713, 4699. | |
| [17] | Geltink R I K, Kyle R L, Pearce E L. Unraveling the complex interplay between T cell metabolism and function[J]. Annu Rev Immunol, 2018, 36: 461-488. |
| [18] | Wang J, Yue H Y, Dong Y Z, et al. Effective compound combination of Bufei Yishen formula ameliorates PM2.5-induced COPD by inhibiting mitochondrial oxidative stress through SIRT3-mediated FOXO3 deacetylation[J]. Phytomedicine, 2025, 140: 156568. |
| [19] | Wrench C L, Baker J R, Monkley S, et al. Small airway fibroblasts from patients with chronic obstructive pulmonary disease exhibit cellular senescence[J]. Am J Physiol Lung Cell Mol Physiol, 2024, 326(3): L266-L279. |
| [20] | Richter F C, Saliutina M, Hegazy A N, et al. Take my breath away-mitochondrial dysfunction drives CD8+ T cell exhaustion[J]. Genes Immun, 2024, 25(1): 4-6. |
| [21] | Park D W, Zmijewski J W. Mitochondrial dysfunction and immune cell metabolism in sepsis[J]. Infect Chemother, 2017, 49(1): 10-21. |
| [22] | Barberis M, Rojas López A. Metabolic imbalance driving immune cell phenotype switching in autoimmune disorders: tipping the balance of T- and B-cell interactions[J]. Clin Transl Med, 2024, 14(3): e1626. [本文编辑] 邢宇洋 |
| [1] | CHEN Rong, ZHANG Meng, ZHU Diqi, GUO Ying, SHEN Jie. Nomogram for predicting the risk of coronary artery lesions in patients with Kawasaki disease based on anti-neutrophil cytoplasmic antibodies [J]. Journal of Shanghai Jiao Tong University (Medical Science), 2025, 45(4): 459-467. |
| [2] | TIAN Xiaofan, DONG Yi, LOU Wenhui, ZHANG Qi, QIU Yijie, ZUO Dan, WANG Wenping. A modified clinically relevant post-operative pancreatic fistula risk evaluation model based on ultrasound shear wave elastography: a prospective study [J]. Journal of Shanghai Jiao Tong University (Medical Science), 2023, 43(4): 437-444. |
| [3] | Li-ting XI, Jin-zhou ZHU, Chen-yan YU, Liu-jing NI, Chun-fang XU, Ai-rong WU. A new rebleeding prediction model and scoring system for patients with acute nonvariceal upper gastrointestinal bleeding [J]. JOURNAL OF SHANGHAI JIAOTONG UNIVERSITY (MEDICAL SCIENCE), 2021, 41(11): 1491-1497. |
| [4] | Ben YUE, Gao-ming WANG, Lu-di YANG, Ran CUI, Feng-rong YU. Construction and application value of prognosis-associated miRNA prediction model in gastric cancer patients [J]. JOURNAL OF SHANGHAI JIAOTONG UNIVERSITY (MEDICAL SCIENCE), 2021, 41(11): 1436-1445. |
| [5] | JIN Yu-jie1, LIU Hui-zhong1, HU You-min2, ZHANG Jian-hua3, CAI Yu-xing1, LI Ning1, NIU Yin-yao3. Synthesis, activity determination of tropane compounds as muscarinic M3 receptor antagonists and quantitative relationship between their molecular structure and activity [J]. , 2019, 39(4): 366-. |
| [6] | PANG Shuai1, 2, CAI Xiao-ting1, 2, CHENG Ting1, 2, ZHANG Neng-chong3, NI Jin-hua2, 4, CHENG Qi-jian1, 2. Clinical value of low attenuation area ratio and lung volume on CT in evaluating severity of spirometric abnormality [J]. , 2019, 39(11): 1284-. |
| [7] | WANG Zhen-huan1, HUANG Yong-hui1, LIN Yan-ping1, CHEN Hua-jiang2, ZHANG Ying2, YUAN Wen2. Research status on finite element analysis of bone drilling [J]. , 2018, 38(5): 561-. |
| [8] | HUANG Yong-hui, PAN Xian-wei*, LIN Yan-ping, CHEN Hua-jiang, ZHANG Yin, YUAN Wen . Research status on haptic simulation in the virtual bone drilling surgery [J]. , 2017, 37(5): 699-. |
| Viewed | ||||||
|
Full text |
|
|||||
|
Abstract |
|
|||||