上海交通大学学报(医学版), 2024, 44(9): 1146-1154 doi: 10.3969/j.issn.1674-8115.2024.09.009

论著 · 临床研究

计算机辅助下自体荧光图像定量结果与口腔白斑病上皮异常增生等级的相关性

李晨曦,1, 王子瑞1, 金恬昊1, 周曾同1, 唐国瑶,1,2, 施琳俊,1

1.上海交通大学医学院附属第九人民医院口腔黏膜病科,上海交通大学口腔医学院,国家口腔医学中心,国家口腔疾病临床医学研究中心,上海市口腔医学重点实验室,上海市口腔医学研究所,上海 200011

2.上海交通大学医学院附属新华医院口腔科,上海 200092

Correlation between computer-assisted quantitative autofluorescence imaging results and the pathological grading of oral epithelial dysplasia in oral leukoplakia

LI Chenxi,1, WANG Zirui1, JIN Tianhao1, ZHOU Zengtong1, TANG Guoyao,1,2, SHI Linjun,1

1.Department of Oral Mucosal Diseases, Shanghai Ninth People′s Hospital, Shanghai Jiao Tong University School of Medicine; College of Stomatology, Shanghai Jiao Tong University; National Center for Stomatology; National Clinical Research Center for Oral Diseases; Shanghai Key Laboratory of Stomatology; Shanghai Research Institute of Stomatology, Shanghai 200011, China

2.Department of stomatology, Shanghai Xin Hua Hospital, Shanghai Jiao Tong University School of Medicine, Shanghai 200092, China

通讯作者: 施琳俊,电子信箱:drshilinjun@126.com唐国瑶,电子信箱:tanggy@shsmu.edu.cn

编委: 包玲

收稿日期: 2024-05-03   接受日期: 2024-07-30  

基金资助: 国家自然科学基金.  82170952
国家重点研发计划.  2022YFC2402900
上海交通大学医学院“双百人”项目.  20221813
上海市卫生健康委员会临床研究项目.  20214Y0192

Corresponding authors: SHI Linjun, E-mail:drshilinjun@126.comTANG Guoyao, E-mail:tanggy@shsmu.edu.cn.

Received: 2024-05-03   Accepted: 2024-07-30  

作者简介 About authors

李晨曦(1993—),女,博士生;电子信箱:lichenxi0327@qq.com。 E-mail:lichenxi0327@qq.com

摘要

目的·探究计算机辅助下自体荧光图像定量结果与口腔白斑病上皮异常增生等级的相关性。方法·纳入2016年4月—2024年1月于上海交通大学医学院附属第九人民医院口腔黏膜病科就诊的口腔白斑病患者357例。利用手持自体荧光仪器获取患者病损的自体荧光图像,将自体荧光图像转为灰度图像,获得量化指标。在Python中拟合有序多元Logistic回归模型,绘制累积概率图。将数据集划分训练集和测试集,生成决策树,调整不同的超参数,获得最佳的模型效果。计算准确度、精确度和F1分值。利用混淆矩阵对模型性能进行可视化呈现。结果·随着上皮异常增生程度的增加,相对色阶平均值呈现下降趋势。在上皮异常增生二分类中累积概率图不同类别曲线之间无重叠,在四分类中仅上皮重度异常增生与其他类别曲线有重叠,说明模型的区分能力较好。在二分类病理等级中,当训练集和测试集比例为4∶1、决策树最大深度为2时,准确度、精确度、F1分值可达到较高,分别为0.792、0.801和0.795。在四分类病理等级中,当训练集和测试集比例为9∶1、决策树最大深度为4时,准确度、精确度、F1分值可达到较高,分别为0.611、0.537和0.569。结论·口腔黏膜病专科医师可将计算机辅助下自体荧光图像定量结果作为参考依据,预测口腔白斑病患者上皮异常增生程度,监控患者癌变风险。

关键词: 自体荧光图像 ; 口腔白斑病 ; 上皮异常增生 ; 有序多元Logistic回归模型 ; 混淆矩阵

Abstract

Objective ·To explore the correlation between the quantitative results of autofluorescence imaging under computer assistance and the grade of epithelial dysplasia in oral leukoplakia. Methods ·From April 2016 to January 2024, 357 patients with oral leukoplakia who visited the Department of Oral Mucosal Diseases at Shanghai Ninth People′s Hospital, Shanghai Jiao Tong University School of Medicine, were included. Autofluorescence images of the lesions were obtained using a handheld autofluorescence device. These images were converted to grayscale images to obtain quantitative metrics. An ordered multinomial Logistic regression model was fitted in Python, and cumulative probability plots were generated. The dataset was divided into training and testing sets, and a decision tree was generated. Different hyperparameters were adjusted to achieve optimal model performance. Accuracy, precision, and F1 scores were calculated. The model performance was visualized using a confusion matrix. Results ·As the degree of epithelial dysplasia increased, the relative mean color level showed a declining trend. In the binary classification of epithelial dysplasia, there was no overlap between the cumulative probability curves of different categories. In the four-category classification, only severe epithelial dysplasia overlapped with other category curves, indicating good discriminative ability of the model. In binary pathological grading, when the training and testing set ratio was 4∶1 and the maximum depth was 2, the accuracy, precision, and F1 scores were 0.792, 0.801, and 0.795, respectively. In the four-category pathological grading, when the training and testing set ratio was 9∶1 and the maximum depth was 4, the accuracy, precision, and F1 scores were 0.611, 0.537, and 0.569, respectively. Conclusion ·Computer-assisted quantitative analysis of autofluorescence images can be used by oral mucosal specialists as a reference to predict the degree of epithelial dysplasia in patients with oral leukoplakia and to monitor their risk of cancer.

Keywords: autofluorescence imaging ; oral leukoplakia ; epithelial dysplasia ; ordered multinomial Logistic regression model ; confusion matrix

PDF (4529KB) 元数据 多维度评价 相关文章 导出 EndNote| Ris| Bibtex  收藏本文

本文引用格式

李晨曦, 王子瑞, 金恬昊, 周曾同, 唐国瑶, 施琳俊. 计算机辅助下自体荧光图像定量结果与口腔白斑病上皮异常增生等级的相关性. 上海交通大学学报(医学版)[J], 2024, 44(9): 1146-1154 doi:10.3969/j.issn.1674-8115.2024.09.009

LI Chenxi, WANG Zirui, JIN Tianhao, ZHOU Zengtong, TANG Guoyao, SHI Linjun. Correlation between computer-assisted quantitative autofluorescence imaging results and the pathological grading of oral epithelial dysplasia in oral leukoplakia. Journal of Shanghai Jiao Tong University (Medical Science)[J], 2024, 44(9): 1146-1154 doi:10.3969/j.issn.1674-8115.2024.09.009

口腔潜在恶性疾患(oral potentially malignant disorders,OPMDs)指一组可能进展为口腔鳞状细胞癌(oral squamous cell carcinomas,OSCCs)的疾病总称1。世界卫生组织根据上皮异常增生程度,将OPMDs分为高级别(中、重度异常增生)和低级别(无上皮异常增生和轻度上皮异常增生)2类,以区别其癌变风险2。据文献3报道,约3.5%的OPMDs会转变为OSCCs,高级别OPMDs癌变率更高,达到了25.4%,并且癌变率随上皮异常增生程度加重而上升。口腔白斑病(oral leukoplakia)是临床上最常见的OPMDs之一,5年癌变率约为9.5%,并且其癌变率随着随访时间的延长而升高4-5

目前,临床上诊断口腔白斑病及口腔上皮细胞异常增生程度的金标准需要活检。然而活检作为一种有创的方法,无法多次重复,且会对患者身心造成较大的负担。自体荧光图像技术是一种无创筛查和诊断技术,因其操作简便、敏感度高等优势,具有良好的应用价值6-10。一项样本量为517例口腔白斑病的回顾性分析11(全世界单中心最大样本量的临床研究)证实,自体荧光图像技术诊断OPMDs伴发癌变的敏感度和阴性预测值均达到了100%。另一项样本量为184例口腔白斑病的回顾性队列研究12进一步证实,自体荧光阴性组患者在随访过程中的癌变率明显低于阳性组和整体队列,说明该技术适用于口腔白斑病患者的癌变风险分层管理。但目前自体荧光图像技术采用的是单纯的定性标准,即阳性和阴性两分类结果,结果判断较为主观,需要观察者同时具备较高的OSCCs和OPMDs诊断水平,以及自体荧光图像结果判读能力,故而限制了该技术在二级医院和基层医院口腔科的应用。同时,不同程度上皮异常增生的病理分级、癌变风险差异较大,而定性的自体荧光图像结果无法对上皮异常增生等级进行判断,限制了该技术在随访过程中的长期应用。因此,急需制定自体荧光图像技术诊断的客观定量标准,以减少观察者偏倚。因此,本研究拟通过横断面分析和机器学习的方法,拟合有序多元Logistic回归模型,在计算机辅助下进行自体荧光图像定量结果与口腔白斑病上皮异常增生等级的相关性分析,以期指导口腔白斑病上皮异常增生程度预测和癌变风险分层管理。

1 对象与方法

1.1 研究对象

纳入2016年4月—2024年1月在上海交通大学医学院附属第九人民医院口腔黏膜病科就诊的口腔白斑病患者357例。纳入标准:① 临床和病理组织学均诊断为口腔白斑病。② 年龄18~75周岁。③ 能够配合自体荧光检查和口腔白斑病损害部位活检。排除标准:① 妊娠及哺乳期妇女。② 同时患有其他肿瘤及精神疾病的患者。③ 病理诊断伴有口腔黏膜癌变。

1.2 诊断标准

参考以下口腔白斑病的诊断规范13-14:① 发生于口腔黏膜上以白色为主的损害,不能擦去,也不能以临床和组织病理学的方法诊断为其他可定义的损害。② 当以白色为主的损害在临床检查中不能被诊断为任何其他疾病或病症时,可进行白斑的临时诊断。③ 活检是必需的。④ 如果排除了任何病因,包括使用烟草或槟榔,并且组织病理学未证实其他特定疾病,则做出明确诊断。

1.3 研究流程

研究的流程为:① 告知患者研究目的及过程,签署知情同意书。② 记录符合标准的患者的流行病学信息。③ 进行传统口腔检查,记录损害部位、大小、类型。④ 对损害部位进行自体荧光图像检查,留存自体荧光图像。⑤ 同期、同部位行活检,完成组织病理学诊断。患者口腔损害部位苏木精-伊红染色(hematoxylin-eosin staining,H-E染色)的组织病理学照片由我院口腔病理科提供。

1.4 自体荧光检测方法

本研究的自体荧光检测采用手持式自体荧光检测仪器VELscope®Vx(LED Medical Diagnostics Inc,Burnaby,Canada)。通过其发出的一定波长的可见光(400~460 nm),激发生物组织自身的荧光基团,利用与仪器相连的设备(本研究采用的为iPod),拍摄并储存生物组织反射的荧光图像,用于后续量化分析。

1.5 自体荧光图像的量化

1.5.1 图像转化

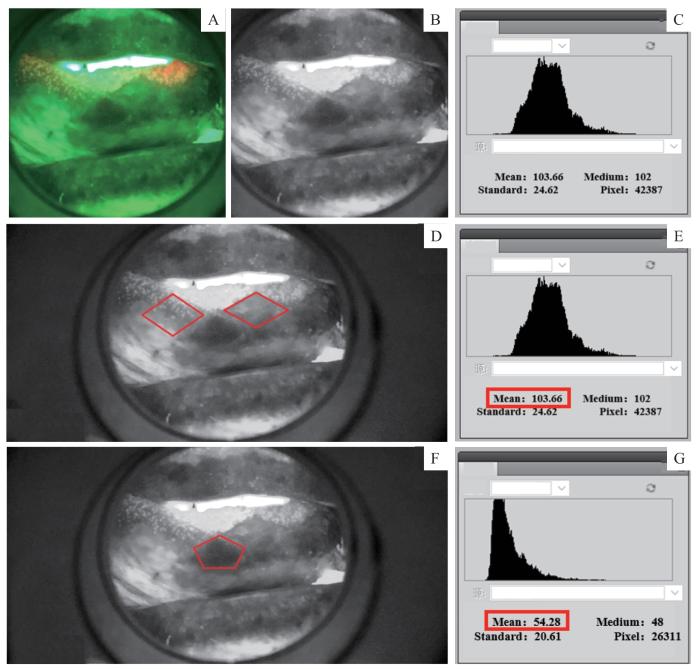
在Photoshop CS5中打开自体荧光图像,将彩色图像转化为灰度模式(图1A、B)。

图1

图1   自体荧光图像的量化

Note: A. Original autofluorescence image. B. Converted grayscale image. C. Grayscale image was used to obtain a histogram of grayscale levels, which was used to obtain the mean grayscale value. D. Selection of two negative regions as background controls. E. Obtaining the mean color level of the negative regions. F. Selection of one positive region. G. Obtaining the MCL of the positive region.

Fig 1   Quantification of autofluorescence imaging


1.5.2 分析指标选取

每一幅灰度图像可得到色阶图(图1C)。该色阶图本质上是一个直方图。在直方图中,横坐标标注质量特性值,纵坐标标注频数或频率值,各组的频数或频率的大小用直方柱的高度表示。在数字图像中,色阶图是说明照片中像素色调分布的直方图。其中,横坐标代表256种色阶,记为0~255,0代表黑色,255代表白色;纵坐标代表该色阶的频数,即像素值。本研究采用选定区域内的色阶平均值(mean color level,MCL)作为分析指标,对该区域图像进行数字化。

1.5.3 自体荧光检查图像数据的获取

研究者在白光照片中选取2处阴性区域和1处阳性区域,在灰度模式图像中圈出对应区域(图1D、F),得到其MCL并记录(图1E、G)。以上过程经2位具备500例以上自体荧光结果判读经验的研究者在互盲条件下重复2次完成,结果取平均值,以确保质量控制。

1.5.4 定量数据的齐化

由于损害部位不同,受试者阳性区域在自体荧光图像中呈现的颜色受周围组织背景色干扰。为消除该干扰,本研究采用相对色阶平均值(relative mean color level,RMCL)进行统计,使得受试者间比较更有意义。RMCL=阳性区域MCL(MCL)-阳性区域MCL(MCL)。

1.5.5 组织病理学结果赋分

根据上皮异常增生程度,将口腔白斑病的组织病理学结果记为0~3分。其中,0分代表无上皮异常增生,1分代表轻度上皮异常增生,2分代表中度上皮异常增生,3分代表重度上皮异常增生。对应世界卫生组织的标准,0~1分为低级别异常增生,2~3分为高级别异常增生。

1.6 统计学分析

将获得的自体荧光定量数据,使用Python 3.12.2拟合有序多元Logistic回归模型,绘制累积概率图。将数据划分为训练集和测试集,生成决策树,调整不同的超参数,例如训练集和测试集的比例、决策树的深度等,以获得最佳的模型效果。计算准确度(accuracy)、精确度(precision)和F1分值(F1 score)。利用混淆矩阵对模型性能进行可视化呈现。

2 结果

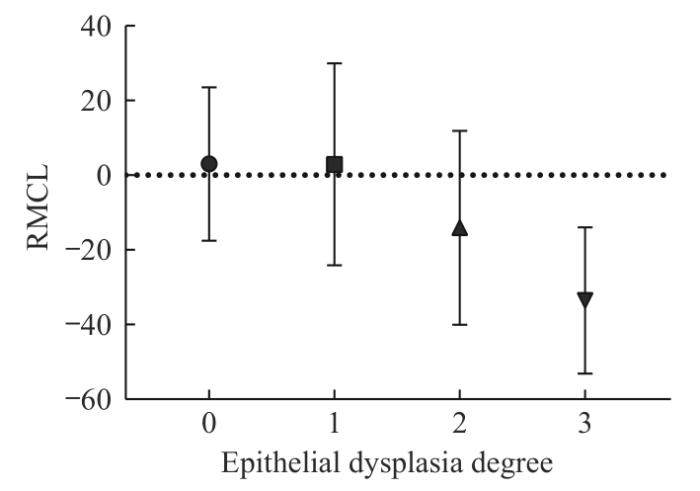
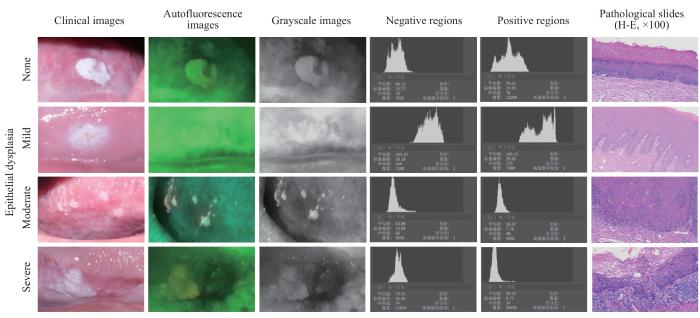
357例受试者中,病理结果显示无上皮异常增生者共31例,RMCL均值为3.29;轻度上皮异常增生者共207例,RMCL均值为3.88;中度上皮异常增生者共92例,RMCL均值为-10.78;重度异常增生者共27例,RMCL均值为-27.91。低级别上皮异常增生者共238例,RMCL均值为3.80;高级别上皮异常增生者共119例,RMCL均值为-14.67。由图2可以看出,随着上皮增生程度的增加,RMCL呈现下降趋势。图3展示了病理诊断分别为不同等级上皮异常增生的4例口腔白斑病的损害临床照片、自体荧光图像信息和H-E染色的组织病理学照片。

图2

图2   RMCL分布图

Note: A decreasing trend in RMCL was observed as the degree of epithelial dysplasia increased.

Fig 2   Distribution of RMCL


图3

图3   不同级别上皮异常增生的4例口腔白斑病

Fig 3   Four cases of oral leukoplakia with different levels of epithelial dysplasia


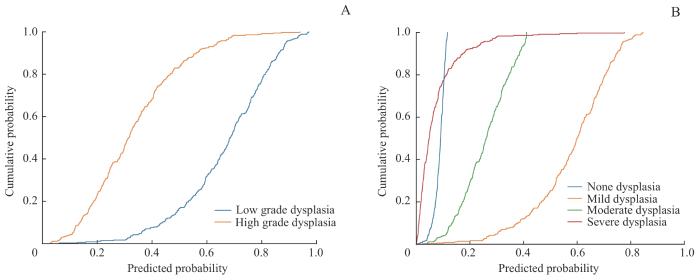
二分类的累积概率图中(图4A),不同类别曲线之间无重叠,说明模型区分类别(高、低级别)的效果较好。四分类的累积概率图中(图4B),不同类别曲线之间基本无重叠,仅重度异常增生与其他类别曲线有重叠,说明模型区分无、轻度、中度上皮异常增生效果较好。

图4

图4   有序多元Logistic回归模型预测病理结果的累积概率图

Fig 4   Cumulative probability plot for the prediction of pathological results using an ordinal multivariate Logistic regression model


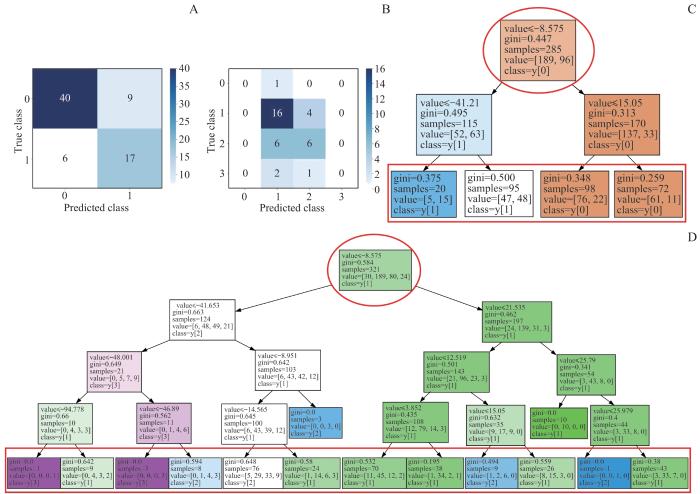
调整数据训练集和测试集的比例,以及决策树最大深度,分别生成混淆矩阵,计算准确度、精确度和F1分值。在二分类病理等级中,训练集和测试集比例为4∶1、决策树最大深度为2时,准确度、精确度、F1分值可达到较高,分别为0.792、0.801和0.795(表1)。此时的混淆矩阵如图5A所示,深色色块集中在主对角线。在四分类病理等级中,训练集和测试集比例为9∶1、决策树最大深度为4时,准确度、精确度、F1分值可达到较高,分别为0.611、0.537和0.569(表2)。此时的混淆矩阵如图5B所示,深色色块集中在第二、三列,可见模型倾向于把病损分类为1,也就是轻度异常增生。决策树如图5C、D所示,在二分类和四分类中,根节点均为-8.575。终末的叶节点表示分类水平。可以看出,在二分类中,左侧分类阈值较低的为1,也就是模型倾向于将小于该阈值的划分为高级别异常增生,而右侧分类阈值较高的为0,也就是模型倾向于将大于该阈值划分为低级别异常增生。在四分类中,从左到右,基本从3至0,上皮异常增生等级有序分布,仅小部分样本被错误预测。

表1   二分类病理结果的准确度、精确度和F1分值

Tab 1  Accuracy, precision, and F1 scores of binary classification of pathological results

Maximum depth of decision treeIndexThe proportion of the test set in all samples
0.100.150.200.250.300.350.400.450.50
2Accuracy0.6670.7410.7920.6560.6480.6320.6500.6710.665
Precision0.6750.7490.8010.6590.6550.5550.6040.6220.605
F1 score0.6690.7440.7950.5470.5340.5220.5560.5860.578
3Accuracy0.6390.6850.7500.5890.6480.6800.6290.6030.609
Precision0.6430.7000.7640.4850.6190.6650.5600.5360.536
F1 score0.6400.6900.7550.5080.5960.6630.5510.5540.554
4Accuracy0.6670.7040.7500.7110.6200.6640.6300.6340.631
Precision0.6670.7130.7640.7070.5790.6490.5720.5520.544
F1 score0.6670.7070.7550.7090.5760.6500.5660.5620.557

新窗口打开| 下载CSV


图5

图5   模型性能最佳时的混淆矩阵和决策树

Note: A. Confusion matrix of the test set prediction model for binary classification of pathological grade. Darker color blocks along the diagonal indicate a higher probability of correct predictions. B. Confusion matrix of the test set prediction model for four-class classification of pathological grade. Dark color blocks are primarily concentrated in the second and third column, indicating that the model tends to predict the degree of epithelial dysplasia as mild or moderate. C. Decision tree of the training set for binary classification of pathological grade, showing the prediction process of each sample. The red circle indicates the root node, and the red square indicates the leaf nodes, with different classification results. D. Decision tree of the training set for four-class classification of pathological grade, showing the prediction process of each sample. The red circle indicates the root node, and the red square indicates the leaf nodes, with different classification results.

Fig 5   Confusion matrix and decision tree with optimal model performance


表2   四分类病理结果的准确度、精确度和F1分值

Tab 2  Accuracy, precision, and F1 scores of four-class classification of pathological results

Max imum depth of decision treeIndexThe proportion of the test set in all samples
0.100.150.200.250.300.350.400.450.50
3Accuracy0.5280.5370.6110.5560.5190.5120.5460.5650.553
Precision0.3020.3440.5120.3950.3850.3940.4760.3520.346
F1 score0.3840.4190.5560.4250.4240.4140.4210.4330.423
4Accuracy0.6110.5740.5140.5220.5370.5360.5520.5710.559
Precision0.5370.5000.3370.4220.4180.4590.5410.5150.455
F1 score0.5690.5330.4070.4540.4270.4380.4650.4890.455
5Accuracy0.5280.5370.5420.5440.5560.5280.4830.5280.525
Precision0.4140.3860.3400.4430.4540.5500.4680.5250.465
F1 score0.4220.4460.4170.4600.4670.4530.4230.5060.460

新窗口打开| 下载CSV


3 讨论

外来光子被生物分子吸收后,会促使这些生物分子由基态转化为激发态。激发态的生物分子通过多途径丢失能量,最终返回基态。通常当生物分子重回基态时,能量通过热量的形式散失到周围。但在某些情况下,能量以光子发射的形式释放,即荧光现象。人体组织中的一些生物分子,如卟啉(porphyrins)、胶原(collagen)、氨基酸(amino acid)、弹性蛋白(elastin)和维生素等,在受到特定波长的光激发后会产生荧光。正常组织与癌变组织的分子组成结构存在差异,其荧光光谱特征也不同。据此,临床上可借助仪器(如本研究采用的手持自体荧光仪器VELscope®)发射一定波长的可见光并采集和储存图像(如本研究采用的iPod),进行结果判读,以此区分正常组织、癌前组织和癌变组织,从而对早期癌症或癌前病变的进展进行诊断,这也是自体荧光诊断技术的基础15

近年来,国内外许多学者对自体荧光图像技术的诊断效能做了相关研究和综述16-22,研究结果提示该技术作为无创检测手段在诊断早期OSCCs、高风险OPMDs损害和区分良恶性病变时有一定辅助作用。本团队前期研究11也证实了手持自体荧光仪器VELscope®诊断OPMDs癌变的敏感度及阴性预测值均为100%,也就是说对于自体荧光仪器VELscope®诊断为阴性的损害区域,活检结果均未提示癌变。这一结论能够帮助临床医师更好地进行诊疗决策,尤其对自体荧光图像检查结果为阴性的患者,可考虑暂缓活检,减轻患者的心理及经济负担。此外,本团队在另一项样本量为184例,随访时间6~60个月,以癌变作为终点结局指标的口腔白斑病的回顾性队列研究12中进一步证实,自体荧光阴性组在随访过程中的癌变率低于阳性组和整体队列,且差异具有统计学意义,提示自体荧光阴性结果的患者可以适当延长随访间隔以及进行更加宽松的随访管理。

然而,上述研究中自体荧光检查采用的均为定性标准,存在较大的主观性,导致结果差异较大。有学者23对该技术在疾病筛查中的应用价值提出了质疑,认为该技术仅对有相关经验的临床医师起到较好的辅助作用,而对缺乏经验的社区医师在疾病筛查时的作用尚无定论。此外,PENTENERO等24的研究还显示,对于自体荧光结果的判断,无论是有经验的口腔医学从业者(oral medicine practitioners,OMPs)还是普通的牙科医师(general dental practitioners,GDPs),观察者内部和观察者间的一致性均不理想,其中的重要原因之一是缺乏客观标准。因此,虽然自体荧光图像技术具有较好的应用前景,但由于缺乏定量标准,结果判断主观性高,对临床医师的判读经验要求较高,难以服务二级医院和基层医院用于高癌变风险患者筛查,限制了其推广和应用。

基于自体荧光诊断技术的原理,受可见光激发的生物分子含量是连续变化的,因此产生的自体荧光明暗程度也是一个连续的变量,这为实现自体荧光定量诊断提供了理论基础。近年来,研究者们也提出了一些自体荧光的定量检查。其中,HUANG等25证实癌变区域与正常区域的光强度和异质性存在明显差异,但他们没有进一步明确诊断阈值并进行验证,也没有对OPMDs与荧光量化之间关系进行探究。QUANG等26用红绿强度比(red to green ratio)对荧光暗区进行数字化,使用该方法对癌变的诊断准确性达到了85%,但研究未阐明其与上皮异常增生程度是否存在关联。CHERRY等27同样利用红绿强度比对病损区域进行风险评级,在随访过程中验证了评级结果与活检结果有较好的一致性,但同样未阐明其与上皮异常增生的关系。

本研究结果显示,随着上皮异常增生程度的增加,RMCL呈现下降趋势。也就是说,在荧光图像中病损区域较周围正常黏膜区域变暗,且随着上皮增生程度增加,暗区逐渐加深。在有序多元Logistic回归模型中,二分类病理结果的模型效果较好,可以有效区分高、低级别损害,为口腔白斑病患者病情进展以及癌变风险评估提供了较高的参考价值。另外,从结果可以看出,预测上皮增生等级为二分类时效果优于四分类,可能是由于总样本量不够大,且各个分类之间不均衡。例如轻度上皮异常增生组样本量明显大于其他组,导致了模型在进行精细分类时效果稍有欠缺。这一点在四分类的混淆矩阵中也有体现:模型倾向于把病损分类为轻度异常增生,可能是由于病例中轻度异常增生比例最高,使模型预测出现偏倚。

除了上皮异常增生等级分布不均外,造成模型预测不够准确的原因还可能与病损部位和类型有关:① 正常舌背黏膜在自体荧光图像中MCL较高,也就是普遍较亮;而舌背部位的损害,通常伴有舌乳头萎缩,在自体荧光图像中较暗,MCL较低。这一点造成的结果是,无论病损的上皮异常增生程度如何,RMCL均较小,影响了模型的准确程度。② 当损害为疣状时,较厚的角质层在自体荧光图像中均呈现较高的MCL,因此易被模型预测为无或轻度上皮异常增生,而实际的上皮异常增生等级可能更高。③ 当损害伴感染时,自体荧光图像易出现假阳性,也就是MCL远低于周围正常区域,导致RMCL较低,预测的上皮异常增生程度较重,可能与实际上皮异常增生程度不符。在后续研究中,增加样本量,将损害按不同部位和类型进行分类分析,有望进一步提高模型的准确度。

本研究为横断面分析,缺乏癌变等临床结局数据。未来有必要开展前瞻性队列研究对受试者进一步随访,在随访期间的不同时间点收集自体荧光图像。根据前瞻性研究结果,可将自体荧光检查作为上皮异常增生等级预测以及OPMDs癌变进展的监测工具。自体荧光图像定量结果在模型中被预测为高级别上皮异常增生的患者必须接受更严密的监测和更积极的治疗,以便早期发现潜在的恶变。

本研究评估了计算机辅助下自体荧光图像定量结果与口腔白斑病上皮异常增生等级的相关性。利用自体荧光图像定量结果建立的模型预测高、低级别上皮异常增生程度,准确率可以达到79.2%,预测无、轻度、中度、重度上皮异常增生程度,准确率为61.1%。因此,口腔黏膜病专科医师对口腔白斑病患者进行随访时,可将计算机辅助下自体荧光图像定量结果作为参考依据,以实现癌变风险分层管理。

Clinical Trial Registry:The study was registered in the Chinese Clinical Trial Registry (ChiCTR), and the registration number was CHICTR-DDD-17013359.

作者贡献声明

李晨曦负责自体荧光图像中病损及背景选取、数据分析和论文撰写;王子瑞、金恬昊负责数据分析;周曾同、唐国瑶负责病例收集;施琳俊负责自体荧光图像中病损及背景选取,病例收集和论文审校。所有作者均阅读并同意了最终稿件的提交。

AUTHOR's CONTRIBUTIONS

LI Chenxi was responsible for the selection of lesion and background in autofluorescence images, data analysis and paper writing; WANG Zirui and JIN Tianhao were responsible for data analysis; ZHOU Zengtong and TANG Guoyao were responsible for case collection; SHI Linjun was responsible for the selection of lesion and background in autofluorescence images, case collection and paper review. All authors have read the final manuscript and agreed to the submission.

利益冲突声明

所有作者声明不存在利益冲突。

COMPETING INTERESTS

All authors disclose no relevant conflict of interests.

参考文献

GONZÁLEZ-MOLES M Á, RUIZ-ÁVILA I, GONZÁLEZ-RUIZ L, et al. Malignant transformation risk of oral lichen planus: a systematic review and comprehensive meta-analysis[J]. Oral Oncol, 2019, 96: 121-130.

[本文引用: 1]

WARNAKULASURIYA S, REIBEL J, BOUQUOT J, et al. Oral epithelial dysplasia classification systems: predictive value, utility, weaknesses and scope for improvement[J]. J Oral Pathol Med, 2008, 37(3): 127-133.

[本文引用: 1]

SPERANDIO M, BROWN A L, LOCK C, et al. Predictive value of dysplasia grading and DNA ploidy in malignant transformation of oral potentially malignant disorders[J]. Cancer Prev Res, 2013, 6(8): 822-831.

[本文引用: 1]

IOCCA O, SOLLECITO T P, ALAWI F, et al. Potentially malignant disorders of the oral cavity and oral dysplasia: a systematic review and meta-analysis of malignant transformation rate by subtype[J]. Head Neck, 2020, 42(3): 539-555.

[本文引用: 1]

WARNAKULASURIYA S. Oral potentially malignant disorders: a comprehensive review on clinical aspects and management[J]. Oral Oncol, 2020, 102: 104550.

[本文引用: 1]

AWAN K H, MORGAN P R, WARNAKULASURIYA S. Evaluation of an autofluorescence based imaging system (VELscope™) in the detection of oral potentially malignant disorders and benign keratoses[J]. Oral Oncol, 2011, 47(4): 274-277.

[本文引用: 1]

LEUCI S, COPPOLA N, TURKINA A, et al. May VelScope be deemed an opportunistic oral cancer screening by general dentists? A pilot study[J]. J Clin Med, 2020, 9(6): 1754.

FARAH C S, DOST F, DO L. Usefulness of optical fluorescence imaging in identification and triaging of oral potentially malignant disorders: a study of VELscope in the LESIONS programme[J]. J Oral Pathol Med, 2019, 48(7): 581-587.

FLORES DOS SANTOS L C, FERNANDES J R, LIMA I F P, et al. Applicability of autofluorescence and fluorescent probes in early detection of oral potentially malignant disorders: a systematic review and meta-data analysis[J]. Photodiagnosis Photodyn Ther, 2022, 38: 102764.

李晨曦, 施琳俊, 唐国瑶. 无创筛查技术早期诊断口腔潜在恶性病患癌变的研究进展[J]. 临床口腔医学杂志, 2017, 33(6): 381-383.

[本文引用: 1]

LI C X, SHI L J, TANG G Y. Advances in early diagnosis of oral potentially malignant disorders through non-invasive screening techniques[J]. Journal of Clinical Stomatology, 2017, 33(6): 381-383.

[本文引用: 1]

SHI L J, LI C X, SHEN X M, et al. Potential role of autofluorescence imaging in determining biopsy of oral potentially malignant disorders: a large prospective diagnostic study[J]. Oral Oncol, 2019, 98: 176-179.

[本文引用: 2]

LI C X, ZHANG Q Q, SUN K, et al. Autofluorescence imaging as a noninvasive tool of risk stratification for malignant transformation of oral leukoplakia: a follow-up cohort study[J]. Oral Oncol, 2022, 130: 105941.

[本文引用: 2]

中华口腔医学会口腔黏膜病专业委员会. 口腔白斑病的定义与分级标准(试行)[J]. 中华口腔医学杂志, 2011, 46(10): 579-580.

[本文引用: 1]

Oral Mucosal Diseases Committee of the Chinese Stomatological Association. Definition and Grading Criteria of Oral Leukoplakia (Trial)[J]. Chinese Journal of Stomatology, 2011, 46(10): 579-580.

[本文引用: 1]

WARNAKULASURIYA S, JOHNSON N W, VAN DER WAAL I. Nomenclature and classification of potentially malignant disorders of the oral mucosa[J]. J Oral Pathol Med, 2007, 36(10): 575-580.

[本文引用: 1]

MONICI M. Cell and tissue autofluorescence research and diagnostic applications[J]. Biotechnol Annu Rev, 2005, 11: 227-256.

[本文引用: 1]

BUENAHORA M R, PERAZA-L A, DÍAZ-BÁEZ D, et al. Diagnostic accuracy of clinical visualization and light-based tests in precancerous and cancerous lesions of the oral cavity and oropharynx: a systematic review and meta-analysis[J]. Clin Oral Investig, 2021, 25(6): 4145-4159.

[本文引用: 1]

CHIANG T E, LIN Y C, LI Y H, et al. Comparative evaluation of autofluorescence imaging and histopathological investigation for oral potentially malignant disorders in Taiwan[J]. Clin Oral Investig, 2019, 23(5): 2395-2402.

TIWARI L, KUJAN O, FARAH C S. Optical fluorescence imaging in oral cancer and potentially malignant disorders: a systematic review[J]. Oral Dis, 2020, 26(3): 491-510.

吴露姝, 杨建堂, 张绍伟. 自体荧光技术在肿瘤诊断中的应用及研究进展[J]. 临床口腔医学杂志, 2019, 35(7): 438-440.

WU L S, YANG J T, ZHANG S W. Application and research progress of autofluorescence technology in tumor diagnosis[J]. Journal of Clinical Stomatology. 2019, 35(7): 438-440.

KIM D H, KIM S W, HWANG S H. Autofluorescence imaging to identify oral malignant or premalignant lesions: systematic review and meta-analysis[J]. Head Neck, 2020, 42(12): 3735-3743.

MENDONCA P, SUNNY S P, MOHAN U, et al. Non-invasive imaging of oral potentially malignant and malignant lesions: a systematic review and meta-analysis[J]. Oral Oncol, 2022, 130: 105877.

李晨曦, 施芷怡, 喻仲麟, 等. 口腔白斑病自体荧光成像结果与临床病理特征相关性分析[J]. 临床口腔医学杂志, 2023, 39(3): 153-157.

[本文引用: 1]

LI C X, SHI Z Y, YU Z L, et al. Correlation analysis between autofluorescence imaging results and clinicopathological characteristics of oral leukoplakia[J]. Journal of Clinical Stomatology, 2023, 39(3): 153-157.

[本文引用: 1]

SCIUBBA J, EPSTEIN J. Is no biopsy appropriate for oral potentially malignant lesion(s) without loss of autofluorescence using VELscope®? A large prospective diagnostic study[J]. Oral Oncol, 2020, 102: 104474.

[本文引用: 1]

PENTENERO M, TODARO D, MARINO R, et al. Interobserver and intraobserver variability affecting the assessment of loss of autofluorescence of oral mucosal lesions[J]. Photodiagnosis Photodyn Ther, 2019, 28: 338-342.

[本文引用: 1]

HUANG T T, HUANG J S, WANG Y Y, et al. Novel quantitative analysis of autofluorescence images for oral cancer screening[J]. Oral Oncol, 2017, 68: 20-26.

[本文引用: 1]

QUANG T, TRAN E Q, SCHWARZ R A, et al. Prospective evaluation of multimodal optical imaging with automated image analysis to detect oral neoplasia in vivo[J]. Cancer Prev Res, 2017, 10(10): 563-570.

[本文引用: 1]

CHERRY K D, SCHWARZ R A, YANG E C, et al. Autofluorescence imaging to monitor the progression of oral potentially malignant disorders[J]. Cancer Prev Res, 2019, 12(11): 791-800.

[本文引用: 1]

/