上海交通大学学报(医学版) ›› 2025, Vol. 45 ›› Issue (7): 900-909.doi: 10.3969/j.issn.1674-8115.2025.07.012
王蕊, 袁瑛, 陶晓峰( )
)
收稿日期:2024-12-30
接受日期:2025-04-08
出版日期:2025-07-28
发布日期:2025-07-28
通讯作者:
陶晓峰,主任医师,博士;电子信箱:cjr.taoxiaofeng@vip.163.com。
WANG Rui, YUAN Ying, TAO Xiaofeng()
Received:2024-12-30
Accepted:2025-04-08
Online:2025-07-28
Published:2025-07-28
Contact:
TAO Xiaofeng, E-mail: cjr.taoxiaofeng@vip.163.com.摘要:
目的·探究合成磁共振成像(synthetic magnetic resonance imaging,SyMRI)技术在口腔癌患者颈部淋巴结转移诊断中的价值。方法·对上海交通大学医学院附属第九人民医院于2023年11月—2024年4月期间收治的、经病理确诊为口腔癌且明确淋巴结转移状况的患者,进行回顾性分析。收集这些患者的术前颌面部磁共振图像,从SyMRI生成的定量图[包括合成T1 map、T2 map及质子密度(proton density,PD)map]、表观弥散系数(apparent diffusion coefficient,ADC)图以及对比增强图像的感兴趣体积区域(volume of interest,VOI)中,提取并筛选直方图特征。通过比较不同瘤周区域的直方图参数,确定最佳范围。在此基础上,进一步结合定量图与ADC图开展生境分析,提取肿瘤侵袭性亚区的生境特征,从而构建预测模型。运用受试者工作特征曲线(receiver operator characteristic curve,ROC曲线)、净重新分类指数(net reclassification improvement,NRI)、综合判别改善指数(integrated discrimination improvement,IDI)以及决策曲线分析(decision curve analysis,DCA),对模型性能进行综合评估。结果·研究共纳入61例口腔癌患者。基于SyMRI提取的瘤内直方图特征对于颈部淋巴结转移的预测曲线下面积(area under the curve,AUC)值为0.798(95%CI 0.673~0.924)。结合ADC图可提高AUC值到0.818(95%CI 0.635~0.861)。通过结合瘤周12 mm的直方图特征和生境特征,预测淋巴结转移的AUC值可进一步提升至0.907(95%CI 0.812~0.993)。NRI、IDI和DCA的分析结果均显示,该模型的预测性能优于临床诊断。结论·基于SyMRI,结合瘤内与瘤周的直方图特征以及生境特征,在口腔癌淋巴结转移预测中展现出较高性能,为无造影剂条件下短时间内成像预测转移淋巴结提供了可行途径。
中图分类号:
王蕊, 袁瑛, 陶晓峰. 合成磁共振成像在口腔癌颈部淋巴结转移诊断中的应用价值[J]. 上海交通大学学报(医学版), 2025, 45(7): 900-909.
WANG Rui, YUAN Ying, TAO Xiaofeng. Application value of synthetic magnetic resonance imaging in predicting cervical lymph node metastasis of oral cancer[J]. Journal of Shanghai Jiao Tong University (Medical Science), 2025, 45(7): 900-909.
| Indicator | Non-metastasis (n=42) | Metastasis (n=19) | P value |
|---|---|---|---|
| Age/year | 56.3±16.2 | 54.9±12.5 | 0.486 |
| Female/n (%) | 15 (35.7) | 2 (10.5) | 0.066 |
| Anatomical site/n (%) | 0.306 | ||
| Tongue | 32 (76.2) | 18 (94.7) | |
| Buccal mucosa | 10 (23.8) | 1 (5.3) | |
| T stage/n (%) | 0.094 | ||
| T1/T2 | 22 (52.4) | 5 (26.3) | |
| T3/T4 | 20 (47.6) | 14 (73.7) | |
| DOI/n (%) | 0.094 | ||
| ≤10 mm | 22 (52.4) | 5 (26.3) | |
| >10 mm | 20 (47.6) | 14 (73.7) | |
| MRI diagnostic report/n (%) | |||
| Positive | 9 (21.4) | 14 (73.7) | <0.001 |
| Negative | 33 (78.6) | 5 (26.3) |
表1 2组患者的临床特征
Tab 1 Clinical characteristics of patients in the two groups
| Indicator | Non-metastasis (n=42) | Metastasis (n=19) | P value |
|---|---|---|---|
| Age/year | 56.3±16.2 | 54.9±12.5 | 0.486 |
| Female/n (%) | 15 (35.7) | 2 (10.5) | 0.066 |
| Anatomical site/n (%) | 0.306 | ||
| Tongue | 32 (76.2) | 18 (94.7) | |
| Buccal mucosa | 10 (23.8) | 1 (5.3) | |
| T stage/n (%) | 0.094 | ||
| T1/T2 | 22 (52.4) | 5 (26.3) | |
| T3/T4 | 20 (47.6) | 14 (73.7) | |
| DOI/n (%) | 0.094 | ||
| ≤10 mm | 22 (52.4) | 5 (26.3) | |
| >10 mm | 20 (47.6) | 14 (73.7) | |
| MRI diagnostic report/n (%) | |||
| Positive | 9 (21.4) | 14 (73.7) | <0.001 |
| Negative | 33 (78.6) | 5 (26.3) |
| Variable | Metastasis | Non- metastasis | P value | AUC (95%CI) | Sensitivity/% | Specificity/% | Accuracy/% | ||
|---|---|---|---|---|---|---|---|---|---|
| Univariate | Multivariate | ||||||||
| Tumor in situ | 0.798 (0.673‒0.924) | 78.95 | 83.33 | 73.8 | |||||
| T1 | P10/ms | 906.88±146.33 | 768.07±156.07 | 0.001 | 0.007 | ||||
| Total energy/(×1010 ms-1) | 2.01±4.53 | 5.25±6.83 | 0.004 | 0.077 | |||||
| PD | Total energy/(×108 ms-1) | 1.68±2.01 | 0.65±0.13 | 0.003 | 0.048 | ||||
| 5 mm | 0.812 (0.689‒0.935) | 78.95 | 80.95 | 72.1 | |||||
| T1 | Mean/ms | 1 149.42±143.60 | 996.79±160.04 | 0.001 | 0.701 | ||||
| Median/ms | 1 149±143.6 | 996.8±160.0 | <0.001 | 0.131 | |||||
| Total energy/(×1010 ms-1) | 7.53±7.18 | 3.61±6.14 | 0.001 | 0.049 | |||||
| PD | Total energy/(×108 ms-1) | 2.69±2.28 | 1.42±1.71 | 0.004 | 0.049 | ||||
| 7 mm | 0.822 (0.701‒0.944) | 84.21 | 78.57 | 73.8 | |||||
| T1 | Mean/ms | 1 208.57±158.09 | 1064.47±184.70 | 0.001 | 0.916 | ||||
| Median/ms | 1 114±132.8 | 961.1±147.1 | 0.001 | 0.041 | |||||
| Total energy/(×1010 ms-1) | 8.58±7.89 | 4.34±6.89 | 0.001 | 0.023 | |||||
| PD | Total energy/(×108 ms-1) | 3.21±2.71 | 1.80±1.96 | 0.005 | 0.026 | ||||
| 10 mm | 0.891 (0.790‒0.992) | 78.95 | 92.86 | 86.9 | |||||
| T1 | Mean/ms | 1 175±152.8 | 1040±178.4 | 0.006 | 0.780 | ||||
| Median/ms | 1 079.24±127.72 | 931.57±156.00 | 0.013 | 0.019 | |||||
| Total energy/(×1010 ms-1) | 1.02±7.64 | 5.64±7.66 | 0.005 | 0.007 | |||||
| PD | Total energy/(×108 ms-1) | 4.00±2.51 | 2.48±2.20 | 0.002 | 0.008 | ||||
| 12 mm | 0.897 (0.800‒0.995) | 78.95 | 92.86 | 85.2 | |||||
| T1 | Mean/ms | 1 164±164.5 | 1033±177.1 | 0.007 | 0.733 | ||||
| Median/ms | 1 068.05±121.88 | 922.69±155.50 | 0.001 | 0.015 | |||||
| Total energy/(×1010 ms-1) | 10.88±7.80 | 6.16±7.89 | 0.001 | 0.005 | |||||
| PD | Total energy/(×108 ms-1) | 4.34±2.60 | 2.76±2.27 | 0.003 | 0.005 | ||||
| 15 mm | 0.746 (0.612‒0.870) | 84.21 | 57.14 | 73.8 | |||||
| T1 | Median/ms | 982.02±245.12 | 886.61±203.35 | 0.008 | 0.657 | ||||
| Total energy/(×1010 ms-1) | 13.0±10.53 | 7.60±8.74 | 0.004 | 0.023 | |||||
| PD | Total energy/(×1010 ms-1) | 239.61±149.49 | 60.69±26.65 | 0.006 | 0.037 | ||||
表2 瘤内和不同范围瘤周扩展的直方图特征
Tab 2 Histogram characteristics of intratumoral and peritumoral extensions of different ranges
| Variable | Metastasis | Non- metastasis | P value | AUC (95%CI) | Sensitivity/% | Specificity/% | Accuracy/% | ||
|---|---|---|---|---|---|---|---|---|---|
| Univariate | Multivariate | ||||||||
| Tumor in situ | 0.798 (0.673‒0.924) | 78.95 | 83.33 | 73.8 | |||||
| T1 | P10/ms | 906.88±146.33 | 768.07±156.07 | 0.001 | 0.007 | ||||
| Total energy/(×1010 ms-1) | 2.01±4.53 | 5.25±6.83 | 0.004 | 0.077 | |||||
| PD | Total energy/(×108 ms-1) | 1.68±2.01 | 0.65±0.13 | 0.003 | 0.048 | ||||
| 5 mm | 0.812 (0.689‒0.935) | 78.95 | 80.95 | 72.1 | |||||
| T1 | Mean/ms | 1 149.42±143.60 | 996.79±160.04 | 0.001 | 0.701 | ||||
| Median/ms | 1 149±143.6 | 996.8±160.0 | <0.001 | 0.131 | |||||
| Total energy/(×1010 ms-1) | 7.53±7.18 | 3.61±6.14 | 0.001 | 0.049 | |||||
| PD | Total energy/(×108 ms-1) | 2.69±2.28 | 1.42±1.71 | 0.004 | 0.049 | ||||
| 7 mm | 0.822 (0.701‒0.944) | 84.21 | 78.57 | 73.8 | |||||
| T1 | Mean/ms | 1 208.57±158.09 | 1064.47±184.70 | 0.001 | 0.916 | ||||
| Median/ms | 1 114±132.8 | 961.1±147.1 | 0.001 | 0.041 | |||||
| Total energy/(×1010 ms-1) | 8.58±7.89 | 4.34±6.89 | 0.001 | 0.023 | |||||
| PD | Total energy/(×108 ms-1) | 3.21±2.71 | 1.80±1.96 | 0.005 | 0.026 | ||||
| 10 mm | 0.891 (0.790‒0.992) | 78.95 | 92.86 | 86.9 | |||||
| T1 | Mean/ms | 1 175±152.8 | 1040±178.4 | 0.006 | 0.780 | ||||
| Median/ms | 1 079.24±127.72 | 931.57±156.00 | 0.013 | 0.019 | |||||
| Total energy/(×1010 ms-1) | 1.02±7.64 | 5.64±7.66 | 0.005 | 0.007 | |||||
| PD | Total energy/(×108 ms-1) | 4.00±2.51 | 2.48±2.20 | 0.002 | 0.008 | ||||
| 12 mm | 0.897 (0.800‒0.995) | 78.95 | 92.86 | 85.2 | |||||
| T1 | Mean/ms | 1 164±164.5 | 1033±177.1 | 0.007 | 0.733 | ||||
| Median/ms | 1 068.05±121.88 | 922.69±155.50 | 0.001 | 0.015 | |||||
| Total energy/(×1010 ms-1) | 10.88±7.80 | 6.16±7.89 | 0.001 | 0.005 | |||||
| PD | Total energy/(×108 ms-1) | 4.34±2.60 | 2.76±2.27 | 0.003 | 0.005 | ||||
| 15 mm | 0.746 (0.612‒0.870) | 84.21 | 57.14 | 73.8 | |||||
| T1 | Median/ms | 982.02±245.12 | 886.61±203.35 | 0.008 | 0.657 | ||||
| Total energy/(×1010 ms-1) | 13.0±10.53 | 7.60±8.74 | 0.004 | 0.023 | |||||
| PD | Total energy/(×1010 ms-1) | 239.61±149.49 | 60.69±26.65 | 0.006 | 0.037 | ||||
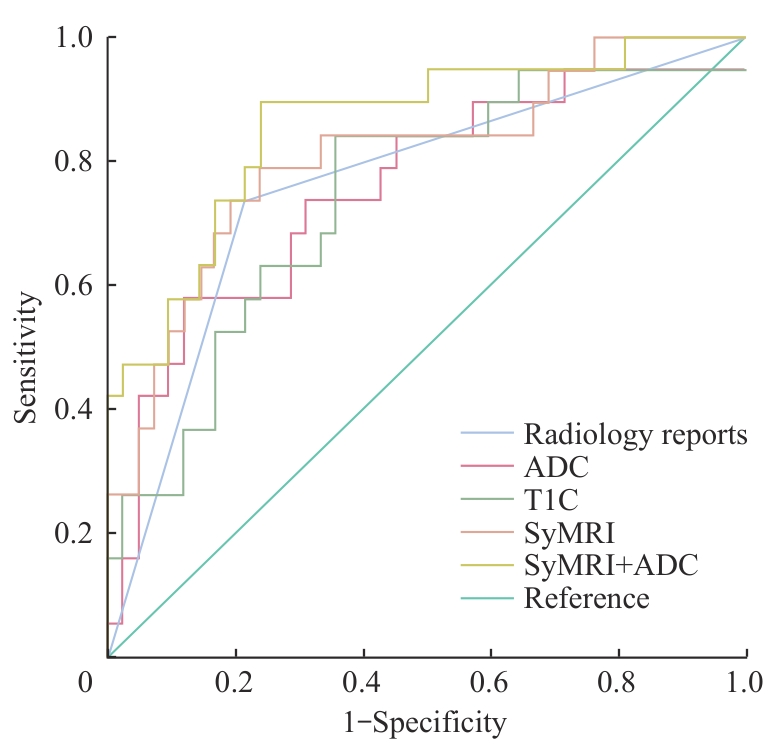
图1 瘤内直方图特征的ROC曲线
Fig 1 ROC curves of intra-tumoral histogram characteristics
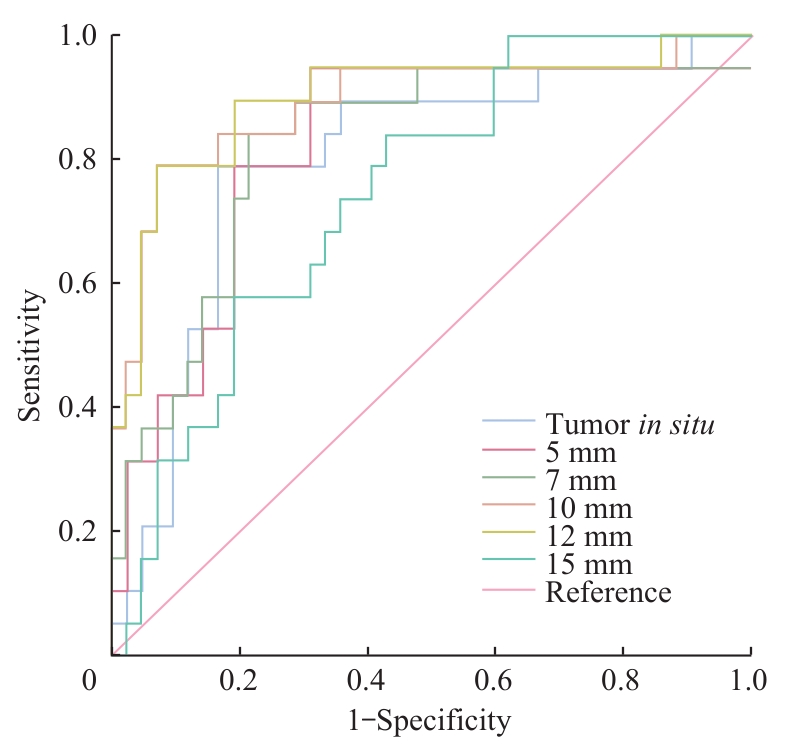
图2 不同的瘤周范围扩展直方图特征的预测性能
Fig 2 Predictive performance of histogram features of different peritumoral extension ranges
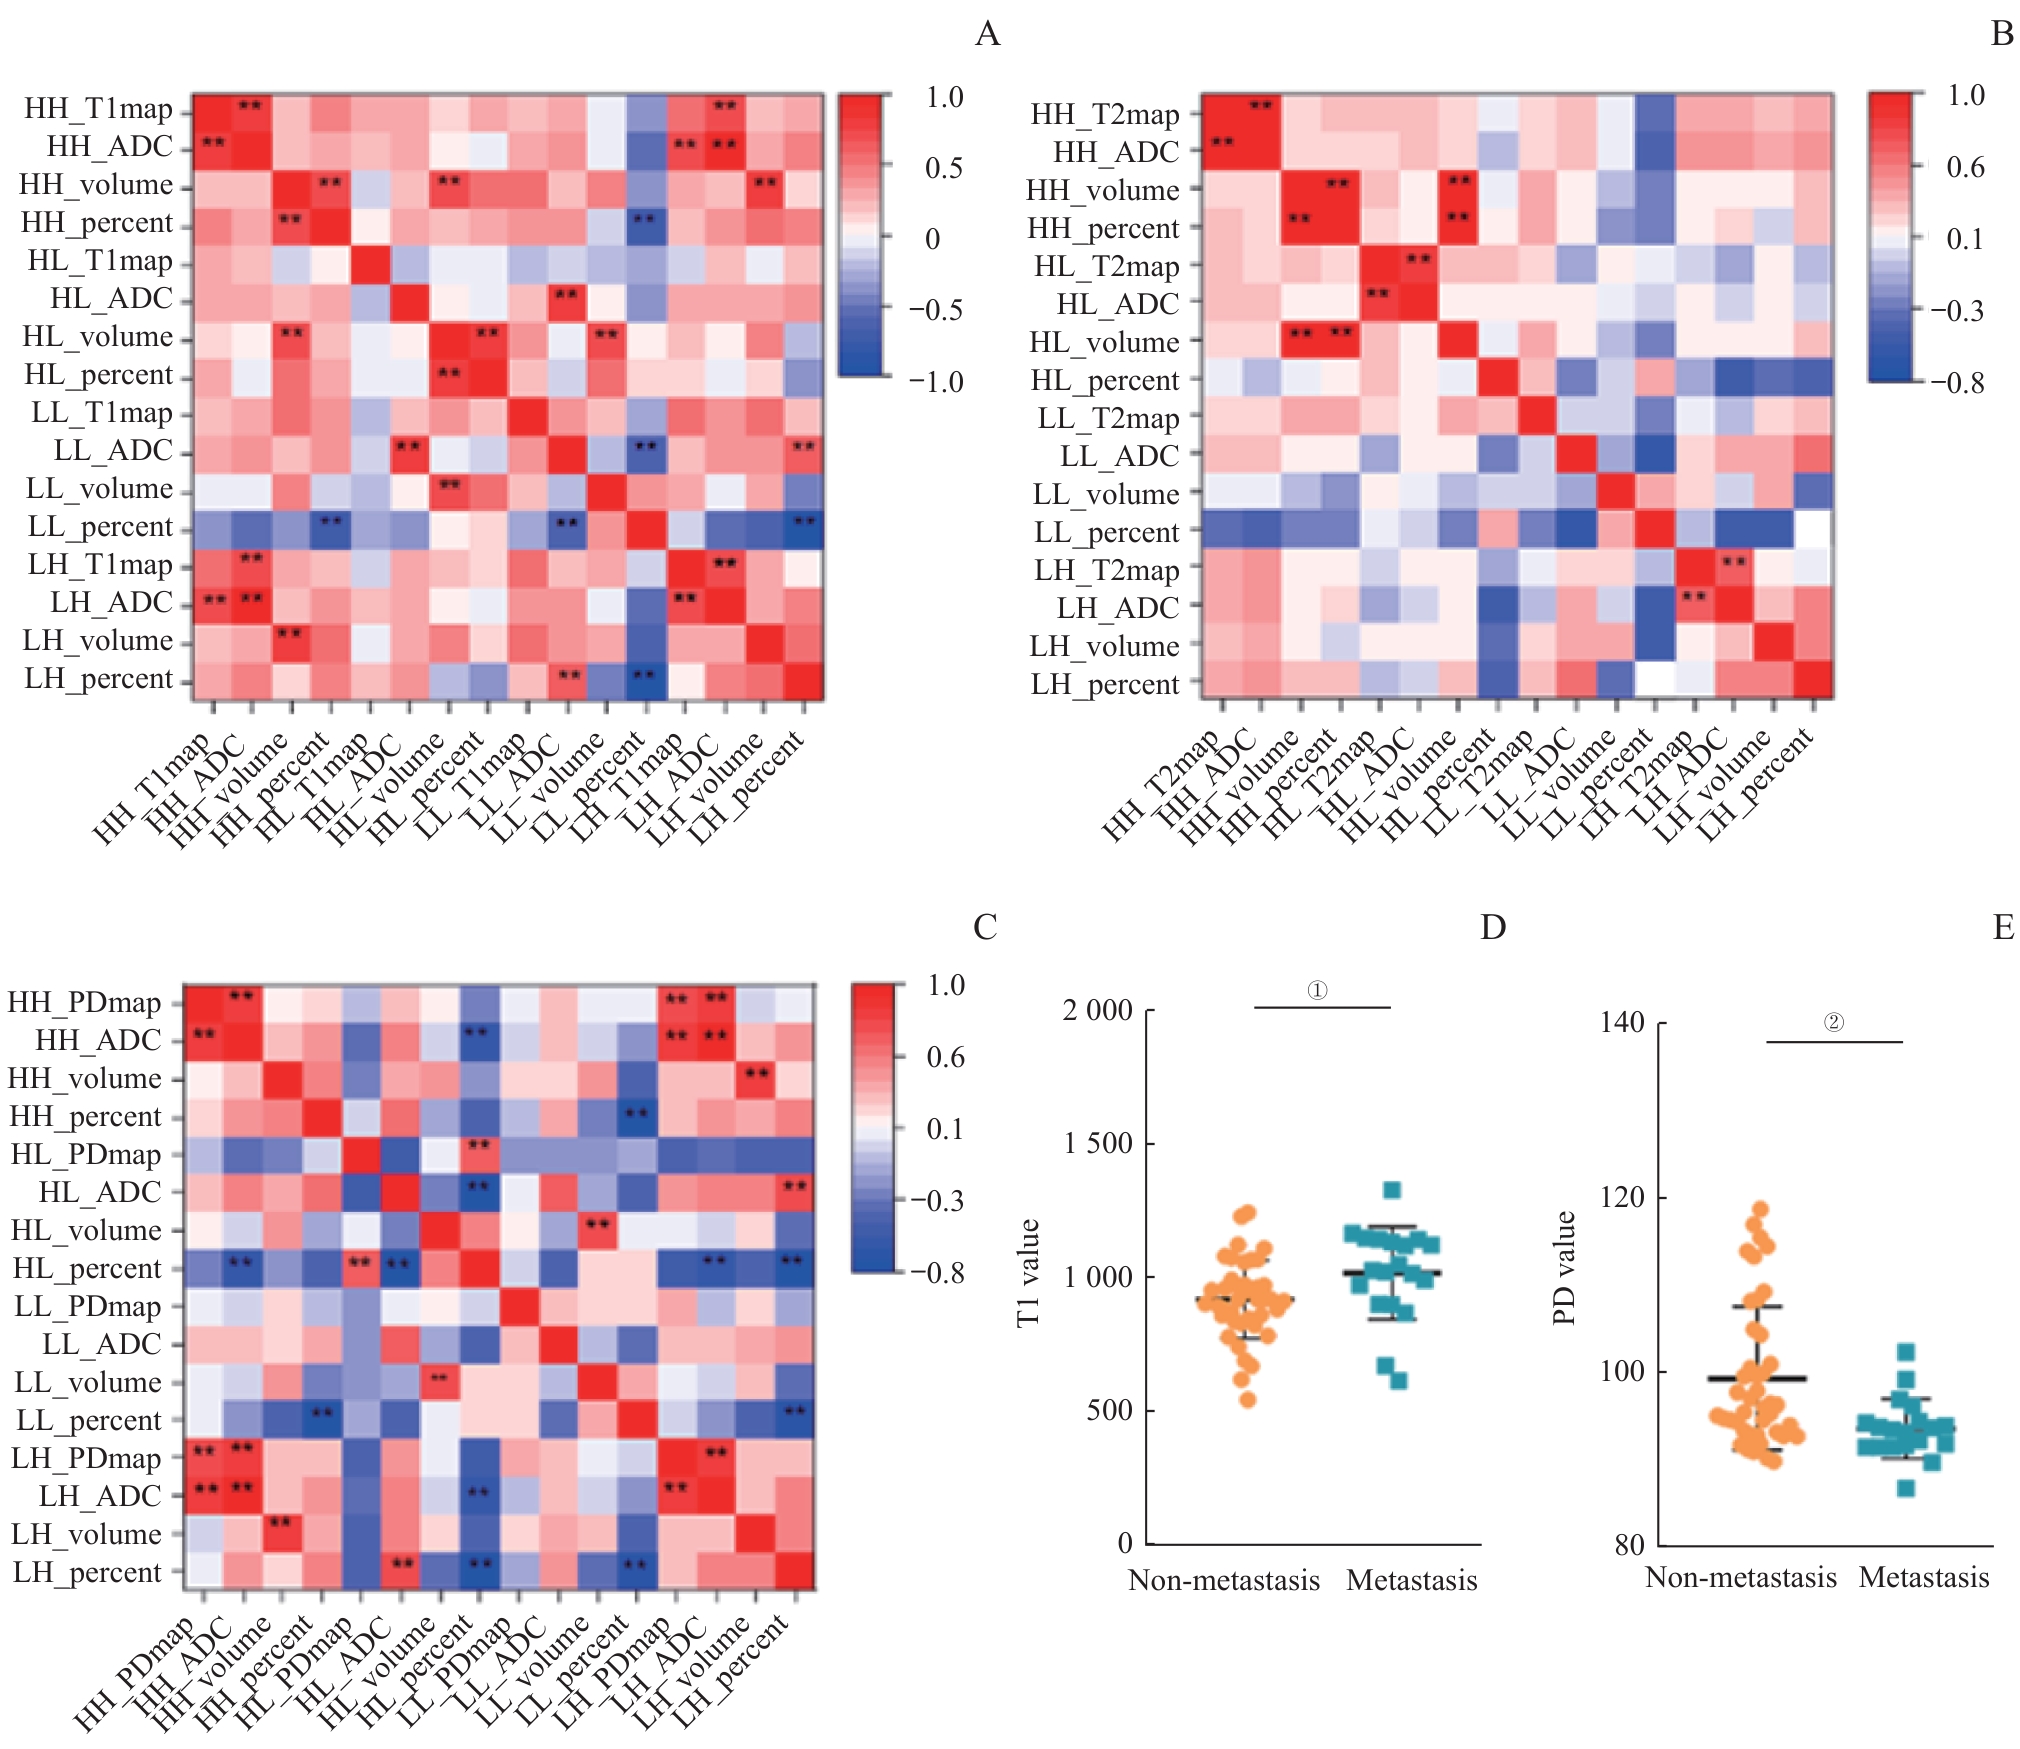
图3 不同亚区内生境特征之间的相关性分析热图和特征的差异性分析Note: A‒C. Heatmap analysis of the correlation between intrinsic features of different sub-regions in different modality combinations after threshold segmentation. D/E. Analysis of the differences in intrinsic features within the sub-regions of the low T1-ADC (T1-value diffusion-limited) region (D) and the high PD-ADC (PD-value diffusion-limited) region (E). The results showed that there were significant differences in T1 and PD values within these two sub-regions. LL—the regions with lower quantitative values and lower ADC values; LH—the regions with lower quantitative values and higher ADC values; HL—the regions with higher quantitative values and lower ADC values; HH—the regions with higher quantitative values and higher ADC values; ADC—apparent diffusion coefficient. ** represents P<0.01. ①P=0.008, ②P=0.003.
Fig 3 Heatmap of correlation analysis among habitat characteristics in different sub-regions and analysis of characteristic differences
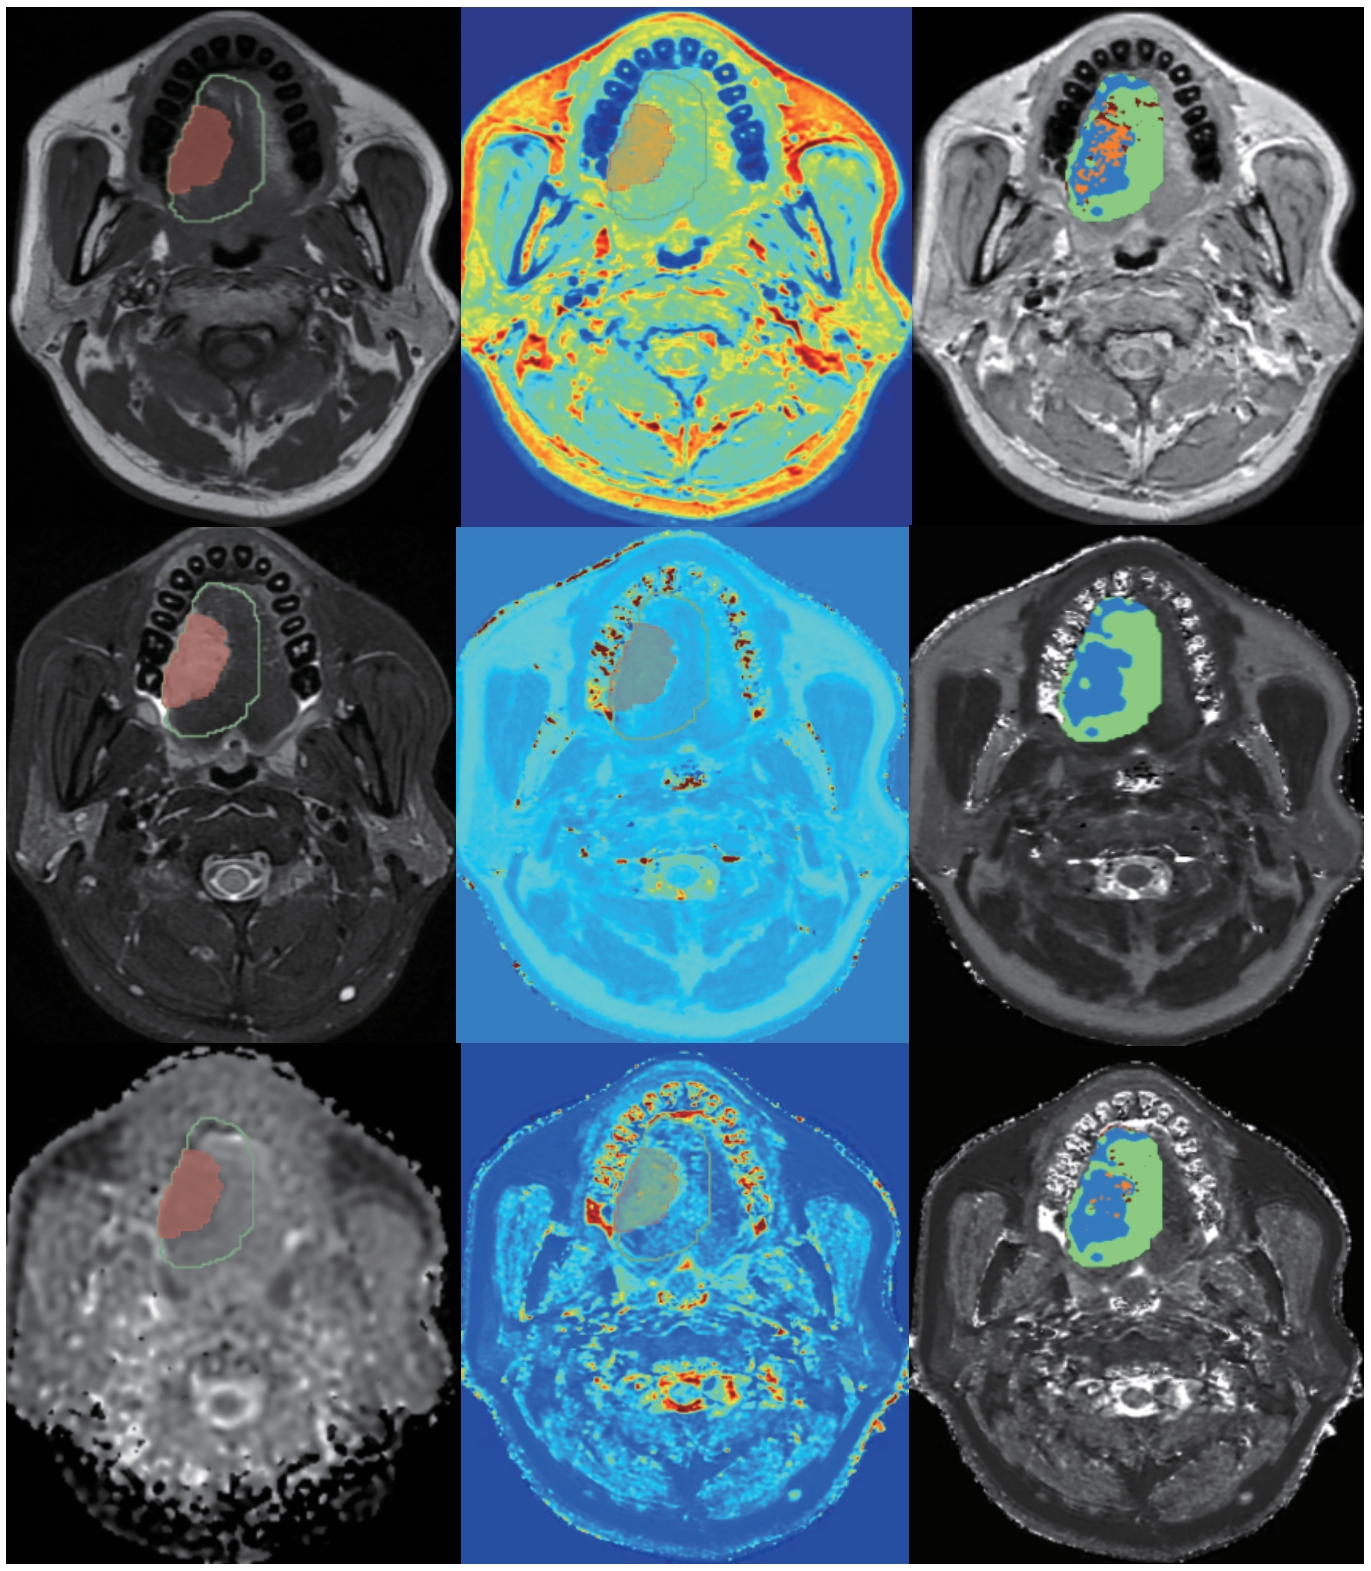
图4 基于12 mm瘤周扩展范围的生境分析结果
Fig 4 Results of habitat analysis based on 12 mm peritumoral extension
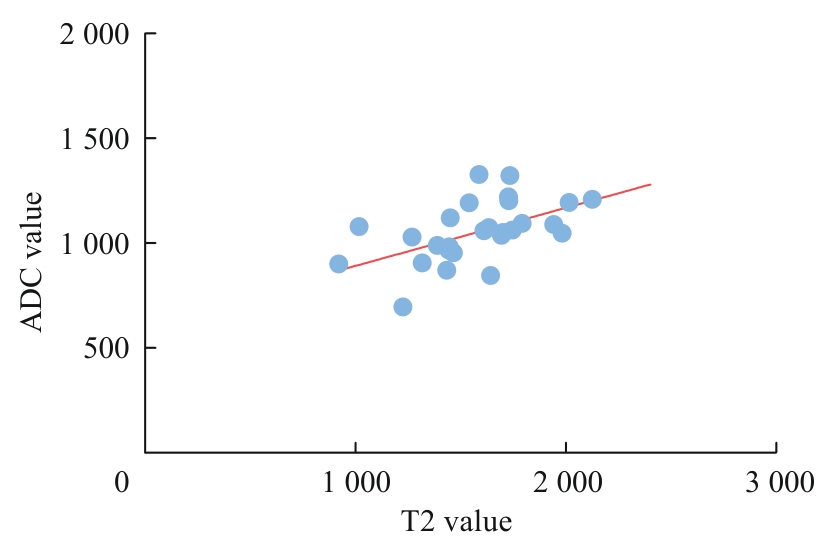
图5 T2值和ADC值之间的相关性
Fig 5 Correlation between T2 and ADC values
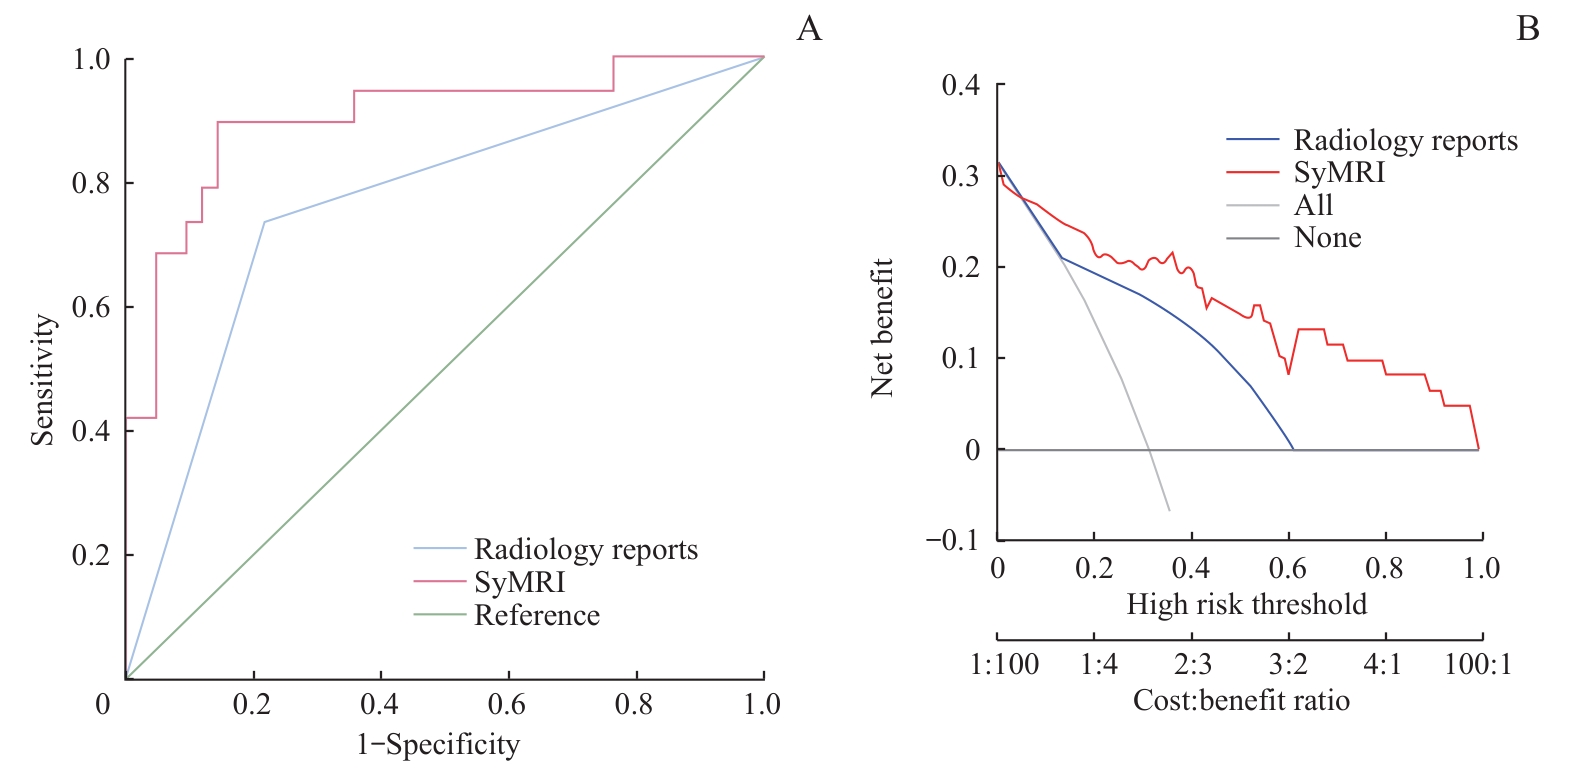
图6 最终建立模型的ROC以及决策曲线Note: A. The performance of the model was significantly higher than that of routine radiology report diagnosis. B. The model provided greater clinical net benefits across a broad range of thresholds.
Fig 6 ROC and decision curves of the final established model
| [1] | BRAV F, LAVERSANNE M, SUNG H, et al. Global cancer statistics 2022: GLOBOCAN estimates of incidence and mortality worldwide for 36 cancers in 185 countries[J]. CA Cancer J Clin, 2024, 74: 229-263. |
| [2] | RADBRUCH A. Gadolinium deposition in the brain: we need to differentiate between chelated and dechelated gadolinium[J]. Radiology, 2018, 288(2): 434-435. |
| [3] | 崔亚东, 李春媚, 陈敏. 合成MRI技术临床应用进展[J]. 中华放射学杂志, 2021, 55(6): 677-681. |
| CUI Y D, LI C M, CHEN M. Progress in clinical application of synthetic MRI technology [J]. Chinese Journal of Radiology, 2021, 55(6): 677-681. | |
| [4] | MAI J, ABUBRIG M, LEHMANN T, et al. T2 mapping in prostate cancer[J]. Invest Radiol, 2019, 54(3): 146-152. |
| [5] | WANG F, YANG Q, ZHANG Y P, et al. 3D variable flip angle T1 mapping for differentiating benign and malignant liver lesions at 3T: comparison with diffusion weighted imaging[J]. BMC Med Imaging, 2022, 22(1): 146. |
| [6] | GE Y X, HU S D, WANG Z, et al. Feasibility and reproducibility of T2 mapping and DWI for identifying malignant lymph nodes in rectal cancer[J]. Eur Radiol, 2021, 31(5): 3347-3354. |
| [7] | WANG P, HU S D, WANG X Y, et al. Synthetic MRI in differentiating benign from metastatic retropharyngeal lymph node: combination with diffusion-weighted imaging[J]. Eur Radiol, 2023, 33(1): 152-161. |
| [8] | ZHAO L, LIANG M, SHI Z, et al. Preoperative volumetric synthetic magnetic resonance imaging of the primary tumor for a more accurate prediction of lymph node metastasis in rectal cancer[J]. Quant Imaging Med Surg, 2021, 11(5): 1805-1816. |
| [9] | JARDIM J F, GONDAK R, GALVIS M M, et al. A decreased peritumoral CD1a+ cell number predicts a worse prognosis in oral squamous cell carcinoma[J]. Histopathology, 2018, 72(6): 905-913. |
| [10] | 赵楠楠, 朱芸, 汤晓敏, 等. 基于瘤内及瘤周MRI影像组学列线图预测乳腺癌腋窝淋巴结转移[J]. 磁共振成像, 2023, 14(3): 81-87, 94. |
| ZHAO N N, ZHU Y, TANG X M, et al. Prediction of axillary lymph node metastasis in breast cancer based on intratumoral and peritumoral MRI radiomics nomogram[J]. Chinese Journal of Magnetic Resonance Imaging, 2023, 14(3): 81-87, 94. | |
| [11] | CUI Y, THA K K, TERASAKA S, et al. Prognostic imaging biomarkers in glioblastoma: development and independent validation on the basis of multiregion and quantitative analysis of MR images[J]. Radiology, 2016, 278(2): 546-553. |
| [12] | PARK J E, KIM H S, KIM N, et al. Spatiotemporal heterogeneity in multiparametric physiologic MRI is associated with patient outcomes in IDH-wildtype glioblastoma[J]. Clin Cancer Res, 2021, 27(1): 237-245. |
| [13] | 傅旖, 马辰莺, 张露, 等. 生境分析在恶性肿瘤影像组学中的研究进展[J]. 国际肿瘤学杂志, 2024, (5): 292-297. |
| FU Y, MA C Y, ZHANG L, et al. Research progress of habitat analysis in radiomics of malignant tumors[J]. Journal of International Oncology, 2024, (5): 292-297. | |
| [14] | GOURTSOYIANNI S, DOUMOU G, PREZZI D, et al. Primary rectal cancer: repeatability of global and local-regional MR imaging texture features[J]. Radiology, 2017, 284(2): 552-561. |
| [15] | CUI Y F, YANG X T, DU X S, et al. Whole-tumour diffusion kurtosis MR imaging histogram analysis of rectal adenocarcinoma: correlation with clinical pathologic prognostic factors[J]. Eur Radiol, 2018, 28(4): 1485-1494. |
| [16] | YANG L Q, LIU D, FANG X, et al. Rectal cancer: can T2WI histogram of the primary tumor help predict the existence of lymph node metastasis?[J]. Eur Radiol, 2019, 29(12): 6469-6476. |
| [17] | REN J L, YUAN Y, TAO X F. Histogram analysis of diffusion-weighted imaging and dynamic contrast-enhanced MRI for predicting occult lymph node metastasis in early-stage oral tongue squamous cell carcinoma[J]. Eur Radiol, 2022, 32(4): 2739-2747. |
| [18] | REN J, LI Y, LIU X Y, et al. Diagnostic performance of ADC values and MRI-based radiomics analysis for detecting lymph node metastasis in patients with cervical cancer: a systematic review and meta-analysis[J]. Eur J Radiol, 2022, 156: 110504. |
| [19] | YANG X, LU Z, TAN X Y, et al. Evaluating the added value of synthetic magnetic resonance imaging in predicting sentinel lymph node status in breast cancer[J]. Quant Imaging Med Surg, 2024, 14(6): 3789-3802. |
| [20] | ROONEY W D, JOHNSON G, LI X, et al. Magnetic field and tissue dependencies of human brain longitudinal 1H2O relaxation in vivo[J]. Magn Reson Med, 2007, 57(2): 308-318. |
| [21] | IORDANISHVILI E, SCHALL M, LOUÇÃO R, et al. Quantitative MRI of cerebral white matter hyperintensities: a new approach towards understanding the underlying pathology[J]. Neuroimage, 2019, 202: 116077. |
| [22] | DENG S Z, WANG S M, SHI X K, et al. Microenvironment in oral potentially malignant disorders: multi-dimensional characteristics and mechanisms of carcinogenesis[J]. Int J Mol Sci, 2022, 23(16): 8940. |
| [23] | 谢佳培, 张卫东, 朱婧怡, 等. 磁共振T1、T2值在脑胶质瘤分级及细胞增殖活性预测中的临床价值[J]. 磁共振成像, 2021, 12(1):15-20. |
| XIE J P, ZHANG W D, ZHU J Y, et al. The clinical value of MRI T1 and T2 values in predicting glioma grading and cell proliferation activity [J]. Chinese Journal of Magnetic Resonance Imaging, 2021, 12(1): 15-20. | |
| [24] | JOHNSON D E, BURTNESS B, LEEMANS C R, et al. Head and neck squamous cell carcinoma[J]. Nat Rev Dis Primers, 2020, 6(1): 92. |
| [25] | 章梓郁, 杜楠楠, 李源茂, 等. 肿瘤淋巴结转移: 肿瘤细胞与免疫系统的博弈[J]. 中华转移性肿瘤杂志, 2022, 5(4): 357-361. |
| ZHANG Z Y, DU N N, LI Y M, et al. Lymph node metastasis of tumor: the battle between tumor cells and immune system[J]. Chinese Journal of Metastatic Cancer, 2022, 5(4): 357-361. | |
| [26] | GRACIEN R M, REITZ S C, HOF S M, et al. Changes and variability of proton density and T1 relaxation times in early multiple sclerosis: MRI markers of neuronal damage in the cerebral cortex[J]. Eur Radiol, 2016, 26(8): 2578-2586. |
| [27] | CHO Y A, YOON H J, LEE J I, et al. Relationship between the expressions of PD-L1 and tumor-infiltrating lymphocytes in oral squamous cell carcinoma[J]. Oral Oncol, 2011, 47(12): 1148-1153. |
| [28] | MERMOD M, BONGIOVANNI M, PETROVA T V, et al. Prediction of occult lymph node metastasis in squamous cell carcinoma of the oral cavity and the oropharynx using peritumoral Prospero homeobox protein 1 lymphatic nuclear quantification[J]. Head Neck, 2016, 38(9): 1407-1415. |
| [29] | WU Q X, WANG S, CHEN X, et al. Radiomics analysis of magnetic resonance imaging improves diagnostic performance of lymph node metastasis in patients with cervical cancer[J]. Radiother Oncol, 2019, 138: 141-148. |
| [30] | WANG Y X, SHANG Y Y, GUO Y X, et al. Clinical study on the prediction of ALN metastasis based on intratumoral and peritumoral DCE-MRI radiomics and clinico-radiological characteristics in breast cancer[J]. Front Oncol, 2024, 14: 1357145. |
| [31] | BAI H L, XIA W, JI X F, et al. Multiparametric magnetic resonance imaging-based peritumoral radiomics for preoperative prediction of the presence of extracapsular extension with prostate cancer[J]. J Magn Reson Imaging, 2021, 54(4): 1222-1230. |
| [32] | WANG F, TAN R K, FENG K, et al. Magnetic resonance imaging-based radiomics features associated with depth of invasion predicted lymph node metastasis and prognosis in tongue cancer[J]. J Magn Reson Imaging, 2022, 56(1): 196-209. |
| [33] | WANG S X, LIU X W, WU Y, et al. Habitat-based radiomics enhances the ability to predict lymphovascular space invasion in cervical cancer: a multi-center study[J]. Front Oncol, 2023, 13: 1252074. |
| [34] | HUANG H Z, CHEN H, ZHENG D Z, et al. Habitat-based radiomics analysis for evaluating immediate response in colorectal cancer lung metastases treated by radiofrequency ablation[J]. Cancer Imaging, 2024, 24(1): 44. |
| [1] | 李偲羽, 陈娅, 胡文韬, 戴勇鸣, 吴颖为. 磁共振耦合谱成像识别头颈部肿瘤异质性及隐匿性淋巴结转移[J]. 上海交通大学学报(医学版), 2025, 45(9): 1202-1213. |
| [2] | 吴媚, 梁妍景, 侯黎莉. 口腔癌术后言语功能的评估工具:一项范围综述[J]. 上海交通大学学报(医学版), 2022, 42(12): 1720-1728. |
| [3] | 徐欣,马秀梅,周荻,白永瑞 . 淋巴结转移状态对局部晚期食管鳞癌术后患者放射治疗预后的影响[J]. 上海交通大学学报(医学版), 2017, 37(10): 1407-. |
| [4] | 徐苓,夏立亮,宋飞飞,等. dCTP焦磷酸酶在胃癌组织中的表达和分布及其临床相关性研究[J]. 上海交通大学学报(医学版), 2016, 36(2): 172-. |
| [5] | 周荻,荣玲,白永瑞,叶明. 淋巴结转移比率对局部进展期直肠癌患者预后的相关性分析[J]. 上海交通大学学报(医学版), 2016, 36(11): 1622-. |
| [6] | 李艺,王燕,常婷,等. 经皮超声造影提示前哨淋巴结性质对腋窝淋巴结良恶性评估的价值[J]. 上海交通大学学报(医学版), 2015, 35(9): 1320-. |
| [7] | 邢伟,孙驰,邹琼琼,等. 基于平滑削边绝对偏离惩罚技术对大肠癌术前淋巴结转移因素的回顾性分析[J]. 上海交通大学学报(医学版), 2015, 35(4): 545-. |
| [8] | 俞 理,胡 兵,林燕苹,等. 实时组织弹性成像在乳腺癌腋窝淋巴结鉴别诊断中的应用[J]. 上海交通大学学报(医学版), 2014, 34(10): 1511-. |
| [9] | 方文涛. 第7版国际抗癌联盟食管鳞癌TNM分期解读[J]. , 2011, 31(3): 265-. |
| [10] | 汪 成, 季 福, 徐 明, 等. 乳腺浸润性微乳头状癌的病理特征及其与转移的关系[J]. , 2011, 31(1): 72-. |
| [11] | 乐 飞, 郑民华, 陆爱国, 等. 结直肠癌组织CypB表达及其对癌细胞迁移和侵袭能力的影响[J]. , 2010, 30(3): 288-. |
| [12] | 苏震东, 苏光启, 李小强, 等. T1-2期乳腺癌患者腋窝淋巴结生发中心和窦组织细胞增生与淋巴结转移的关系[J]. , 2010, 30(10): 1275-. |
| 阅读次数 | ||||||
|
全文 |
|
|||||
|
摘要 |
|
|||||