
上海交通大学学报(医学版) ›› 2026, Vol. 46 ›› Issue (8): 1091-1100.doi: 10.3969/j.issn.1674-8115.2026.08.009
• 论著 · 临床研究 • 上一篇
袁婉迪1, 朱紫茵2, 赵祖源3, 姚舒桓2, 孙香2, 韦海涛4, 李丽2,4( ), 李敏惠5
收稿日期:2026-02-24
接受日期:2026-05-26
出版日期:2026-08-13
发布日期:2026-08-13
通讯作者:
李 丽,教授,博士;电子信箱:10210051@vip.henu.edu.cn。作者简介:第一联系人:袁婉迪和朱紫茵负责论文撰写,赵祖源、姚舒桓、孙香负责数据收集、整理及统计分析,韦海涛负责手术相关审核,李丽和李敏惠负责论文的审核及指导。所有作者均阅读并同意了最终稿件的提交。
基金资助:
Yuan Wandi1, Zhu Ziyin2, Zhao Zuyuan3, Yao Shuhuan2, Sun Xiang2, Wei Haitao4, Li Li2,4(), Li Minhui5
Received:2026-02-24
Accepted:2026-05-26
Online:2026-08-13
Published:2026-08-13
Contact:
Li Li,E-mail:10210051@vip.henu.edu.cn.About author:First author contact:Yuan Wandi and Zhu Ziyin were responsible for drafting the manuscript. Zhao Zuyuan, Yao Shuhuan, and Sun Xiang were responsible for data collection, organization, and statistical analysis. Wei Haitao was responsible for the review of surgery-related content. Li Li and Li Minhui were responsible for the review and supervision of the manuscript. All authors have read and approved the final version of the manuscript.
Supported by:摘要:
目的·评估并比较3种食管癌根治术的疗效。方法·回顾性分析接受食管癌根治术的298例患者的临床资料,按手术方式分为充气式纵隔镜同步腹腔镜食管癌根治术(synchronous insufflation mediastinoscopy with laparoscopic esophagectomy,SIMLE)组、纵隔镜联合腹腔镜食管癌切除术(combined insufflation mediastinoscopy-laparoscopy esophagectomy,CIMLE)组和McKeown术组,采用倾向性评分匹配(propensity score matching,PSM)法以1∶1比例进行分层两两匹配。分析各组术前基线资料、手术时间、术中出血量、内环境稳态指标、术后并发症、淋巴结清扫数量、术后恢复情况等差异。结果·经PSM,SIMLE组与CIMLE组匹配75对,SIMLE组与McKeown组匹配88对。SIMLE组手术时间和术中出血量均显著低于CIMLE组和McKeown组(均P<0.001)。麻醉诱导结束时,SIMLE组血糖、酸碱度、剩余碱、乳酸水平均优于CIMLE组和McKeown组(均P<0.05)。SIMLE组术后吻合口瘘和吻合口狭窄等并发症的发生率低于CIMLE组和McKeown组(均P<0.05),术后住院时间也短于CIMLE及McKeown组(均P<0.001)。术后7 d,SIMLE组白细胞介素-6、肿瘤坏死因子-α、C反应蛋白水平均显著低于CIMLE组和McKeown 组(均P<0.05)。术后14 d,SIMLE组前白蛋白、白蛋白水平恢复更佳(均P<0.05)。术后1个月内,SIMLE组15项恢复质量评分量表的评分显著高于CIMLE组和McKeown组(均P<0.05)。结论·SIMLE术式通过纵隔镜与腹腔镜同步操作,可缩短手术时间,减少创伤应激,加速术后恢复,为食管癌患者提供了新的微创治疗选择。
中图分类号:
袁婉迪, 朱紫茵, 赵祖源, 姚舒桓, 孙香, 韦海涛, 李丽, 李敏惠. 不同微创路径下食管癌根治术的临床疗效分析[J]. 上海交通大学学报(医学版), 2026, 46(8): 1091-1100.
Yuan Wandi, Zhu Ziyin, Zhao Zuyuan, Yao Shuhuan, Sun Xiang, Wei Haitao, Li Li, Li Minhui. Analysis of clinical efficacy of radical esophagectomy for esophageal cancer using different minimally invasive approaches[J]. Journal of Shanghai Jiao Tong University (Medical Science), 2026,(8): 1091-1100.
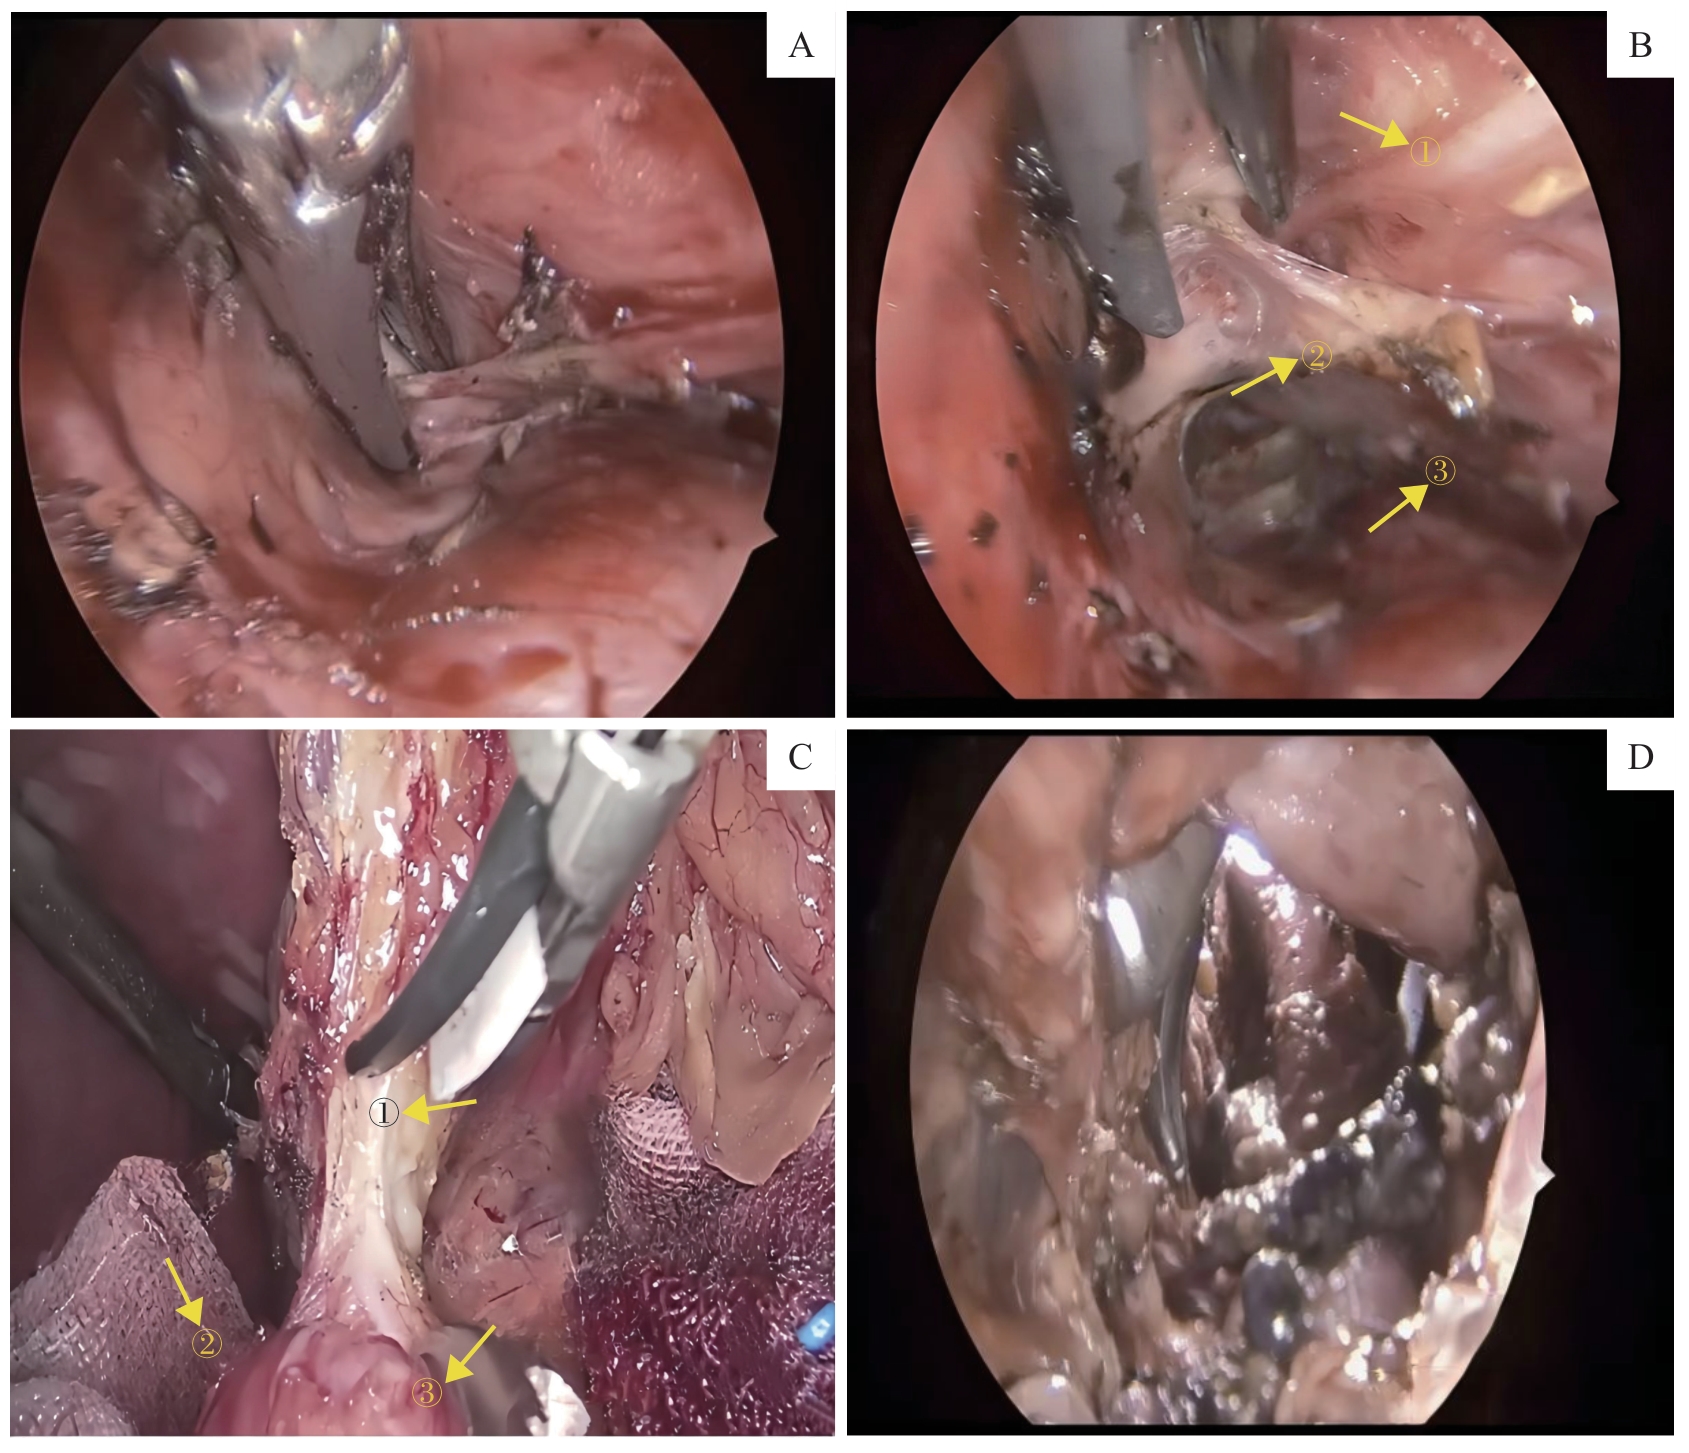
图1 SIMLE手术操作Note: A. Dissection of lymph nodes. B. Dissection of periesophageal lymph nodes with preservation of surrounding tissues (①left recurrent laryngeal nerve; ②lymph nodes along the left recurrent laryngeal nerve; ③esophagus). C. Preservation of the right gastroepiploic artery(①left gastric artery; ②common hepatic artery; ③splenic artery). D. The two teams converged at the carinal level.
Fig 1 Surgical procedures of SIMLE
| Clinical data | SIMLE group (n=103) | CIMLE group (n=94) | McKeown group (n=101) | Statistic value | P value |
|---|---|---|---|---|---|
| Gender/n | 0.124 | 0.940 | |||
| Male | 56 | 50 | 55 | ||
| Female | 47 | 44 | 46 | ||
| Age/year | 63.6±6.2 | 62.9±6.0 | 63.2±6.2 | 0.323 | 0.724 |
| BMI/(kg·m-2) | 21.8±3.4 | 21.5±3.2 | 21.3±3.0 | 0.629 | 0.534 |
| Tumor differentiation/n | 0.125 | 0.998 | |||
| Low | 30 | 28 | 30 | ||
| Moderate | 58 | 52 | 57 | ||
| High | 15 | 14 | 14 | ||
| Tumor location/n | 0.265 | 0.992 | |||
| Upper | 34 | 30 | 32 | ||
| Middle | 35 | 32 | 34 | ||
| Lower | 34 | 32 | 35 | ||
| Tumor diameter/n | 0.536 | 0.765 | |||
| <3 cm | 65 | 64 | 66 | ||
| 3‒5 cm | 38 | 30 | 35 | ||
| Pathological type/n | 1.086 | 0.897 | |||
| Squamous cell carcinoma | 49 | 50 | 52 | ||
| Adenocarcinoma | 46 | 38 | 40 | ||
| Other | 8 | 6 | 9 | ||
| Tumor stage/n | 0.172 | 0.999 | |||
| Ⅰ | 21 | 20 | 20 | ||
| Ⅱ | 41 | 38 | 41 | ||
| Ⅲ | 41 | 36 | 40 | ||
| Neoadjuvant therapy/n | 0.744 | 0.689 | |||
| Yes | 80 | 68 | 75 | ||
| No | 23 | 26 | 26 | ||
| Comorbidity/n | |||||
| Hypertension | 13 | 10 | 11 | 0.232 | 0.890 |
| Diabetes mellitus | 16 | 13 | 15 | 0.114 | 0.944 |
表1 PSM前3组一般资料比较
Tab 1 Comparison of general data among the three groups before PSM
| Clinical data | SIMLE group (n=103) | CIMLE group (n=94) | McKeown group (n=101) | Statistic value | P value |
|---|---|---|---|---|---|
| Gender/n | 0.124 | 0.940 | |||
| Male | 56 | 50 | 55 | ||
| Female | 47 | 44 | 46 | ||
| Age/year | 63.6±6.2 | 62.9±6.0 | 63.2±6.2 | 0.323 | 0.724 |
| BMI/(kg·m-2) | 21.8±3.4 | 21.5±3.2 | 21.3±3.0 | 0.629 | 0.534 |
| Tumor differentiation/n | 0.125 | 0.998 | |||
| Low | 30 | 28 | 30 | ||
| Moderate | 58 | 52 | 57 | ||
| High | 15 | 14 | 14 | ||
| Tumor location/n | 0.265 | 0.992 | |||
| Upper | 34 | 30 | 32 | ||
| Middle | 35 | 32 | 34 | ||
| Lower | 34 | 32 | 35 | ||
| Tumor diameter/n | 0.536 | 0.765 | |||
| <3 cm | 65 | 64 | 66 | ||
| 3‒5 cm | 38 | 30 | 35 | ||
| Pathological type/n | 1.086 | 0.897 | |||
| Squamous cell carcinoma | 49 | 50 | 52 | ||
| Adenocarcinoma | 46 | 38 | 40 | ||
| Other | 8 | 6 | 9 | ||
| Tumor stage/n | 0.172 | 0.999 | |||
| Ⅰ | 21 | 20 | 20 | ||
| Ⅱ | 41 | 38 | 41 | ||
| Ⅲ | 41 | 36 | 40 | ||
| Neoadjuvant therapy/n | 0.744 | 0.689 | |||
| Yes | 80 | 68 | 75 | ||
| No | 23 | 26 | 26 | ||
| Comorbidity/n | |||||
| Hypertension | 13 | 10 | 11 | 0.232 | 0.890 |
| Diabetes mellitus | 16 | 13 | 15 | 0.114 | 0.944 |
| Clinical data | SIMLE group (n=75) | CIMLE group (n=75) | Statistic value | P value |
|---|---|---|---|---|
| Gender/n | ‒ | 1.000 | ||
| Male | 41 | 41 | ||
| Female | 34 | 34 | ||
| Age/year | 63.5±6.1 | 63.4±6.0 | 0.102 | 0.921 |
| BMI/(kg·m-2) | 21.75±3.35 | 21.68±3.25 | 0.182 | 0.856 |
| Tumor differentiation/n | 0.485 | 0.628 | ||
| Low | 22 | 21 | ||
| Moderate | 42 | 43 | ||
| High | 11 | 11 | ||
| Tumor location/n | 0.158 | 0.924 | ||
| Upper | 25 | 24 | ||
| Middle | 26 | 27 | ||
| Lower | 24 | 24 | ||
| Tumor diameter/n | 0.133 | 0.715 | ||
| <3 cm | 49 | 48 | ||
| 3‒5 cm | 26 | 27 | ||
| Pathological type/n | 0.215 | 0.898 | ||
| Squamous cell carcinoma | 38 | 37 | ||
| Adenocarcinoma | 31 | 32 | ||
| Other | 6 | 6 | ||
| Tumor stage/n | 0.412 | 0.680 | ||
| Ⅰ | 15 | 14 | ||
| Ⅱ | 32 | 33 | ||
| Ⅲ | 28 | 28 | ||
| Neoadjuvant therapy/n | 0.300 | 0.584 | ||
| Yes | 58 | 57 | ||
| No | 17 | 18 | ||
| Comorbidity/n | ‒ | 1.000 | ||
| Hypertension | 10 | 10 | ||
| Diabetes mellitus | 12 | 11 |
表2 PSM后SIMLE组与CIMLE组一般资料比较
Tab 2 Comparison of general data between the SIMLE group and CIMLE group after PSM
| Clinical data | SIMLE group (n=75) | CIMLE group (n=75) | Statistic value | P value |
|---|---|---|---|---|
| Gender/n | ‒ | 1.000 | ||
| Male | 41 | 41 | ||
| Female | 34 | 34 | ||
| Age/year | 63.5±6.1 | 63.4±6.0 | 0.102 | 0.921 |
| BMI/(kg·m-2) | 21.75±3.35 | 21.68±3.25 | 0.182 | 0.856 |
| Tumor differentiation/n | 0.485 | 0.628 | ||
| Low | 22 | 21 | ||
| Moderate | 42 | 43 | ||
| High | 11 | 11 | ||
| Tumor location/n | 0.158 | 0.924 | ||
| Upper | 25 | 24 | ||
| Middle | 26 | 27 | ||
| Lower | 24 | 24 | ||
| Tumor diameter/n | 0.133 | 0.715 | ||
| <3 cm | 49 | 48 | ||
| 3‒5 cm | 26 | 27 | ||
| Pathological type/n | 0.215 | 0.898 | ||
| Squamous cell carcinoma | 38 | 37 | ||
| Adenocarcinoma | 31 | 32 | ||
| Other | 6 | 6 | ||
| Tumor stage/n | 0.412 | 0.680 | ||
| Ⅰ | 15 | 14 | ||
| Ⅱ | 32 | 33 | ||
| Ⅲ | 28 | 28 | ||
| Neoadjuvant therapy/n | 0.300 | 0.584 | ||
| Yes | 58 | 57 | ||
| No | 17 | 18 | ||
| Comorbidity/n | ‒ | 1.000 | ||
| Hypertension | 10 | 10 | ||
| Diabetes mellitus | 12 | 11 |
| Clinical data | SIMLE group(n=88) | McKeown group (n=88) | Statistic value | P value |
|---|---|---|---|---|
| Gender/n | ‒ | 1.000 | ||
| Male | 48 | 48 | ||
| Female | 40 | 40 | ||
| Age/year | 63.6±6.2 | 63.3±6.1 | 0.326 | 0.745 |
| BMI/(kg·m-2) | 21.82±3.38 | 21.55±3.10 | 0.415 | 0.679 |
| Tumor differentiation/n | 0.721 | 0.471 | ||
| Low | 26 | 25 | ||
| Moderate | 49 | 50 | ||
| High | 13 | 13 | ||
| Tumor location/n | 0.412 | 0.814 | ||
| Upper | 29 | 28 | ||
| Middle | 30 | 31 | ||
| Lower | 29 | 29 | ||
| Tumor diameter/n | ‒ | 1.000 | ||
| <3 cm | 57 | 57 | ||
| 3‒5 cm | 31 | 31 | ||
| Pathological type/n | 0.137 | 0.934 | ||
| Squamous cell carcinoma | 44 | 43 | ||
| Adenocarcinoma | 39 | 40 | ||
| Other | 5 | 5 | ||
| Tumor stage/n | 0.256 | 0.798 | ||
| Ⅰ | 18 | 17 | ||
| Ⅱ | 37 | 38 | ||
| Ⅲ | 33 | 33 | ||
| Neoadjuvant therapy/n | 1.000 | 0.317 | ||
| Yes | 67 | 65 | ||
| No | 21 | 23 | ||
| Comorbidity/n | ‒ | 1.000 | ||
| Hypertension | 11 | 11 | ||
| Diabetes mellitus | 14 | 14 |
表3 PSM后SIMLE组与McKeown组一般资料比较
Tab 3 Comparison of general data between the SIMLE group and McKeown group after PSM
| Clinical data | SIMLE group(n=88) | McKeown group (n=88) | Statistic value | P value |
|---|---|---|---|---|
| Gender/n | ‒ | 1.000 | ||
| Male | 48 | 48 | ||
| Female | 40 | 40 | ||
| Age/year | 63.6±6.2 | 63.3±6.1 | 0.326 | 0.745 |
| BMI/(kg·m-2) | 21.82±3.38 | 21.55±3.10 | 0.415 | 0.679 |
| Tumor differentiation/n | 0.721 | 0.471 | ||
| Low | 26 | 25 | ||
| Moderate | 49 | 50 | ||
| High | 13 | 13 | ||
| Tumor location/n | 0.412 | 0.814 | ||
| Upper | 29 | 28 | ||
| Middle | 30 | 31 | ||
| Lower | 29 | 29 | ||
| Tumor diameter/n | ‒ | 1.000 | ||
| <3 cm | 57 | 57 | ||
| 3‒5 cm | 31 | 31 | ||
| Pathological type/n | 0.137 | 0.934 | ||
| Squamous cell carcinoma | 44 | 43 | ||
| Adenocarcinoma | 39 | 40 | ||
| Other | 5 | 5 | ||
| Tumor stage/n | 0.256 | 0.798 | ||
| Ⅰ | 18 | 17 | ||
| Ⅱ | 37 | 38 | ||
| Ⅲ | 33 | 33 | ||
| Neoadjuvant therapy/n | 1.000 | 0.317 | ||
| Yes | 67 | 65 | ||
| No | 21 | 23 | ||
| Comorbidity/n | ‒ | 1.000 | ||
| Hypertension | 11 | 11 | ||
| Diabetes mellitus | 14 | 14 |
| Perioperative data | SIMLE group (n=75) | CIMLE group (n=75) | Statistic value | P value |
|---|---|---|---|---|
| Operation time/min | 90.25±10.37 | 130.37±10.30 | 23.8 | <0.001 |
| Intraoperative blood loss/mL | 38.13±10.21 | 62.52±10.28 | 14.6 | <0.001 |
| Postoperative hospital stay/d | 9.5±2.0 | 12.5±2.0 | 9.2 | <0.001 |
| Lymph nodes dissected/n | 22.3±2.1 | 21.7±2.1 | 1.7 | 0.084 |
| Gastric tube indwelling time/d | 5.2±1.8 | 6.0±2.1 | 2.5 | 0.013 |
| Nutrition tube indwelling time/d | 13.0±3.5 | 14.0±2.5 | 2.0 | 0.046 |
| Abdominal drainage tube indwelling time/d | 4.32±1.15 | 4.70±1.15 | 2.0 | 0.046 |
| Total abdominal drainage volume/mL | 160.54±42.36 | 180.28±45.72 | 2.7 | 0.007 |
| Mediastinal drainage tube indwelling time/d | 2.86±1.02 | 3.30±1.14 | 2.5 | 0.014 |
| Total mediastinal drainage volume/mL | 132.36±38.65 | 148.72±41.28 | 2.5 | 0.013 |
| Complication/n | ||||
| Pulmonary infection | 0 | 0 | ‒ | ‒ |
| Incision infection | 1 | 2 | ‒ | 0.092 |
| Hoarseness | 1 | 5 | ‒ | 0.236 |
| Anastomotic leakage | 1 | 8 | ‒ | 0.036 |
| Anastomotic stricture | 1 | 9 | ‒ | 0.024 |
| Chylous leakage | 0 | 1 | ‒ | 0.500 |
| Arrhythmia | 0 | 0 | ‒ | ‒ |
表4 SIMLE组与CIMLE组围手术期指标比较
Tab 4 Comparison of perioperative data between the SIMLE group and CIMLE group
| Perioperative data | SIMLE group (n=75) | CIMLE group (n=75) | Statistic value | P value |
|---|---|---|---|---|
| Operation time/min | 90.25±10.37 | 130.37±10.30 | 23.8 | <0.001 |
| Intraoperative blood loss/mL | 38.13±10.21 | 62.52±10.28 | 14.6 | <0.001 |
| Postoperative hospital stay/d | 9.5±2.0 | 12.5±2.0 | 9.2 | <0.001 |
| Lymph nodes dissected/n | 22.3±2.1 | 21.7±2.1 | 1.7 | 0.084 |
| Gastric tube indwelling time/d | 5.2±1.8 | 6.0±2.1 | 2.5 | 0.013 |
| Nutrition tube indwelling time/d | 13.0±3.5 | 14.0±2.5 | 2.0 | 0.046 |
| Abdominal drainage tube indwelling time/d | 4.32±1.15 | 4.70±1.15 | 2.0 | 0.046 |
| Total abdominal drainage volume/mL | 160.54±42.36 | 180.28±45.72 | 2.7 | 0.007 |
| Mediastinal drainage tube indwelling time/d | 2.86±1.02 | 3.30±1.14 | 2.5 | 0.014 |
| Total mediastinal drainage volume/mL | 132.36±38.65 | 148.72±41.28 | 2.5 | 0.013 |
| Complication/n | ||||
| Pulmonary infection | 0 | 0 | ‒ | ‒ |
| Incision infection | 1 | 2 | ‒ | 0.092 |
| Hoarseness | 1 | 5 | ‒ | 0.236 |
| Anastomotic leakage | 1 | 8 | ‒ | 0.036 |
| Anastomotic stricture | 1 | 9 | ‒ | 0.024 |
| Chylous leakage | 0 | 1 | ‒ | 0.500 |
| Arrhythmia | 0 | 0 | ‒ | ‒ |
| Perioperative data | SIMLE group (n=88) | McKeown group (n=88) | Statistic value | P value |
|---|---|---|---|---|
| Operation time/min | 97.42±10.11 | 154.45±10.22 | 37.2 | <0.001 |
| Intraoperative blood loss/mL | 42.53±10.00 | 82.13±10.42 | 25.7 | <0.001 |
| Postoperative hospital stay/d | 9.9±2.1 | 14.5±2.5 | 13.2 | <0.001 |
| Lymph nodes dissected/n | 22.5±2.0 | 22.0±2.2 | 1.5 | 0.116 |
| Gastric tube indwelling time/d | 5.5±1.5 | 7.9±2.5 | 7.7 | <0.001 |
| Nutrition tube indwelling time/d | 13.2±3.0 | 14.5±4.2 | 2.3 | 0.019 |
| Abdominal drainage tube indwelling time/d | 4.40±1.10 | 9.16±2.03 | 19.3 | <0.001 |
| Total abdominal drainage volume/mL | 162.50±42.00 | 489.74±126.35 | 20.0 | <0.001 |
| Mediastinal drainage tube indwelling time/d | 2.30±1.11 | 5.75±1.63 | 16.4 | <0.001 |
| Total mediastinal drainage volume/mL | 135.54±40.00 | 210.35±48.41 | 11.1 | <0.001 |
| Complication/n | ||||
| Pulmonary infection | 0 | 6 | ‒ | 0.041 |
| Incision infection | 1 | 3 | ‒ | 0.622 |
| Hoarseness | 0 | 6 | ‒ | 0.041 |
| Anastomotic leakage | 1 | 10 | ‒ | 0.011 |
| Anastomotic stricture | 1 | 12 | ‒ | 0.004 |
| Chylous leakage | 0 | 4 | ‒ | 0.062 |
| Arrhythmia | 0 | 2 | ‒ | 0.249 |
表5 SIMLE组与McKeown组围手术期指标比较
Tab 5 Comparison of perioperative data between the SIMLE group and McKeown group
| Perioperative data | SIMLE group (n=88) | McKeown group (n=88) | Statistic value | P value |
|---|---|---|---|---|
| Operation time/min | 97.42±10.11 | 154.45±10.22 | 37.2 | <0.001 |
| Intraoperative blood loss/mL | 42.53±10.00 | 82.13±10.42 | 25.7 | <0.001 |
| Postoperative hospital stay/d | 9.9±2.1 | 14.5±2.5 | 13.2 | <0.001 |
| Lymph nodes dissected/n | 22.5±2.0 | 22.0±2.2 | 1.5 | 0.116 |
| Gastric tube indwelling time/d | 5.5±1.5 | 7.9±2.5 | 7.7 | <0.001 |
| Nutrition tube indwelling time/d | 13.2±3.0 | 14.5±4.2 | 2.3 | 0.019 |
| Abdominal drainage tube indwelling time/d | 4.40±1.10 | 9.16±2.03 | 19.3 | <0.001 |
| Total abdominal drainage volume/mL | 162.50±42.00 | 489.74±126.35 | 20.0 | <0.001 |
| Mediastinal drainage tube indwelling time/d | 2.30±1.11 | 5.75±1.63 | 16.4 | <0.001 |
| Total mediastinal drainage volume/mL | 135.54±40.00 | 210.35±48.41 | 11.1 | <0.001 |
| Complication/n | ||||
| Pulmonary infection | 0 | 6 | ‒ | 0.041 |
| Incision infection | 1 | 3 | ‒ | 0.622 |
| Hoarseness | 0 | 6 | ‒ | 0.041 |
| Anastomotic leakage | 1 | 10 | ‒ | 0.011 |
| Anastomotic stricture | 1 | 12 | ‒ | 0.004 |
| Chylous leakage | 0 | 4 | ‒ | 0.062 |
| Arrhythmia | 0 | 2 | ‒ | 0.249 |
| Variable | SIMLE group (n=75) | CIMLE group (n=75) | Statistic value | P value |
|---|---|---|---|---|
| Preoperative | ||||
| IL-6/(ng·mL-1) | 1.74±0.21 | 1.72±0.20 | 0.597 | 0.550 |
| TNF-α/(ng·mL-1) | 1.04±0.11 | 1.03±0.12 | 0.532 | 0.596 |
| CRP/(mg·L-1) | 2.07±0.20 | 2.05±0.21 | 0.597 | 0.551 |
| Postoperative Day 7 | ||||
| IL-6/(ng·mL-1) | 3.08±0.32 | 5.05±0.30 | 38.895 | <0.001 |
| TNF-α/(ng·mL-1) | 3.55±0.25 | 4.78±0.24 | 30.735 | <0.001 |
| CRP/(mg·L-1) | 97.77±34.38 | 113.24±35.21 | 2.722 | 0.007 |
表6 SIMLE组与CIMLE组炎症因子水平比较
Tab 6 Comparison of inflammatory factor levels between the SIMLE group and CIMLE group
| Variable | SIMLE group (n=75) | CIMLE group (n=75) | Statistic value | P value |
|---|---|---|---|---|
| Preoperative | ||||
| IL-6/(ng·mL-1) | 1.74±0.21 | 1.72±0.20 | 0.597 | 0.550 |
| TNF-α/(ng·mL-1) | 1.04±0.11 | 1.03±0.12 | 0.532 | 0.596 |
| CRP/(mg·L-1) | 2.07±0.20 | 2.05±0.21 | 0.597 | 0.551 |
| Postoperative Day 7 | ||||
| IL-6/(ng·mL-1) | 3.08±0.32 | 5.05±0.30 | 38.895 | <0.001 |
| TNF-α/(ng·mL-1) | 3.55±0.25 | 4.78±0.24 | 30.735 | <0.001 |
| CRP/(mg·L-1) | 97.77±34.38 | 113.24±35.21 | 2.722 | 0.007 |
| Variable | SIMLE group (n=88) | McKeown group (n=88) | Statistic value | P value |
|---|---|---|---|---|
| Preoperative | ||||
| IL-6/(ng·mL-1) | 1.78±0.21 | 1.80±0.20 | 0.647 | 0.518 |
| TNF-α/(ng·mL-1) | 1.07±0.11 | 1.10±0.11 | 1.807 | 0.072 |
| CRP/(mg·L-1) | 2.10±0.20 | 2.12±0.22 | 0.633 | 0.527 |
| Postoperative Day 7 | ||||
| IL-6/(ng·mL-1) | 3.15±0.30 | 5.75±0.32 | 55.604 | <0.001 |
| TNF-α/(ng·mL-1) | 3.60±0.28 | 5.81±0.28 | 52.355 | <0.001 |
| CRP/(mg·L-1) | 105.04±35.14 | 158.33±38.56 | 9.582 | <0.001 |
表7 SIMLE组与McKeown组炎症因子水平比较
Tab 7 Comparison of inflammatory factor levels between the SIMLE group and McKeown group
| Variable | SIMLE group (n=88) | McKeown group (n=88) | Statistic value | P value |
|---|---|---|---|---|
| Preoperative | ||||
| IL-6/(ng·mL-1) | 1.78±0.21 | 1.80±0.20 | 0.647 | 0.518 |
| TNF-α/(ng·mL-1) | 1.07±0.11 | 1.10±0.11 | 1.807 | 0.072 |
| CRP/(mg·L-1) | 2.10±0.20 | 2.12±0.22 | 0.633 | 0.527 |
| Postoperative Day 7 | ||||
| IL-6/(ng·mL-1) | 3.15±0.30 | 5.75±0.32 | 55.604 | <0.001 |
| TNF-α/(ng·mL-1) | 3.60±0.28 | 5.81±0.28 | 52.355 | <0.001 |
| CRP/(mg·L-1) | 105.04±35.14 | 158.33±38.56 | 9.582 | <0.001 |
| Variable | SIMLE group (n=75) | CIMLE group (n=75) | Statistic value | P value |
|---|---|---|---|---|
| Preoperative | ||||
| Prealbumin/(mg·L-1) | 235.12±47.85 | 233.45±48.10 | 0.213 | 0.832 |
| Albumin/(g·L-1) | 24.48±4.05 | 24.65±3.98 | 0.259 | 0.796 |
| Postoperative Day 14 | ||||
| Prealbumin/(mg·L-1) | 320.45±52.10 | 302.80±51.65 | 2.084 | 0.039 |
| Albumin/(g·L-1) | 35.12±5.20 | 33.00±4.95 | 2.557 | 0.012 |
| Postoperative Month 1 | ||||
| Prealbumin/(mg·L-1) | 346.80±48.50 | 328.40±47.10 | 2.357 | 0.020 |
| Albumin/(g·L-1) | 35.15±5.25 | 33.05±4.90 | 2.533 | 0.012 |
| Postoperative Month 3 | ||||
| Prealbumin/(mg·L-1) | 362.10±43.50 | 347.80±41.20 | 2.067 | 0.041 |
| Albumin/(g·L-1) | 39.15±3.85 | 37.55±3.70 | 2.595 | 0.010 |
表8 SIMLE组与CIMLE组营养指标比较
Tab 8 Comparison of nutritional indicators between the SIMLE group and CIMLE group
| Variable | SIMLE group (n=75) | CIMLE group (n=75) | Statistic value | P value |
|---|---|---|---|---|
| Preoperative | ||||
| Prealbumin/(mg·L-1) | 235.12±47.85 | 233.45±48.10 | 0.213 | 0.832 |
| Albumin/(g·L-1) | 24.48±4.05 | 24.65±3.98 | 0.259 | 0.796 |
| Postoperative Day 14 | ||||
| Prealbumin/(mg·L-1) | 320.45±52.10 | 302.80±51.65 | 2.084 | 0.039 |
| Albumin/(g·L-1) | 35.12±5.20 | 33.00±4.95 | 2.557 | 0.012 |
| Postoperative Month 1 | ||||
| Prealbumin/(mg·L-1) | 346.80±48.50 | 328.40±47.10 | 2.357 | 0.020 |
| Albumin/(g·L-1) | 35.15±5.25 | 33.05±4.90 | 2.533 | 0.012 |
| Postoperative Month 3 | ||||
| Prealbumin/(mg·L-1) | 362.10±43.50 | 347.80±41.20 | 2.067 | 0.041 |
| Albumin/(g·L-1) | 39.15±3.85 | 37.55±3.70 | 2.595 | 0.010 |
| Variable | SIMLE group (n=88) | McKeown group (n=88) | Statistic value | P value |
|---|---|---|---|---|
| Preoperative | ||||
| Prealbumin/(mg·L-1) | 234.50±47.20 | 231.80±49.50 | 0.371 | 0.711 |
| Albumin/(g·L-1) | 24.52±4.10 | 24.61±4.02 | 0.147 | 0.883 |
| Postoperative Day 14 | ||||
| Prealbumin/(mg·L-1) | 319.80±53.25 | 285.40±56.10 | 4.172 | <0.001 |
| Albumin/(g·L-1) | 35.28±5.35 | 30.85±5.10 | 5.623 | <0.001 |
| Postoperative Month 1 | ||||
| Prealbumin/(mg·L-1) | 348.15±49.20 | 301.50±53.40 | 6.027 | <0.001 |
| Albumin/(g·L-1) | 35.30±5.30 | 30.80±5.05 | 5.766 | <0.001 |
| Postoperative Month 3 | ||||
| Prealbumin/(mg·L-1) | 363.50±44.10 | 314.20±49.50 | 6.976 | <0.001 |
| Albumin/(g·L-1) | 39.30±3.90 | 34.85±3.65 | 7.815 | <0.001 |
表9 SIMLE组与McKeown组营养指标比较
Tab 9 Comparison of nutritional indicators between the SIMLE group and McKeown group
| Variable | SIMLE group (n=88) | McKeown group (n=88) | Statistic value | P value |
|---|---|---|---|---|
| Preoperative | ||||
| Prealbumin/(mg·L-1) | 234.50±47.20 | 231.80±49.50 | 0.371 | 0.711 |
| Albumin/(g·L-1) | 24.52±4.10 | 24.61±4.02 | 0.147 | 0.883 |
| Postoperative Day 14 | ||||
| Prealbumin/(mg·L-1) | 319.80±53.25 | 285.40±56.10 | 4.172 | <0.001 |
| Albumin/(g·L-1) | 35.28±5.35 | 30.85±5.10 | 5.623 | <0.001 |
| Postoperative Month 1 | ||||
| Prealbumin/(mg·L-1) | 348.15±49.20 | 301.50±53.40 | 6.027 | <0.001 |
| Albumin/(g·L-1) | 35.30±5.30 | 30.80±5.05 | 5.766 | <0.001 |
| Postoperative Month 3 | ||||
| Prealbumin/(mg·L-1) | 363.50±44.10 | 314.20±49.50 | 6.976 | <0.001 |
| Albumin/(g·L-1) | 39.30±3.90 | 34.85±3.65 | 7.815 | <0.001 |
| Variable | SIMLE group (n=75) | CIMLE group (n=75) | Statistic value | P value |
|---|---|---|---|---|
| Before anesthesia induction | ||||
| pH value | 7.42±0.03 | 7.42±0.04 | ‒ | 1.000 |
| Glu/(mmol·L-1) | 5.22±0.51 | 5.15±0.45 | 0.891 | 0.374 |
| BE/(mmol·L-1) | 1.52±1.50 | 1.58±1.25 | 0.266 | 0.790 |
| Lac/(mmol·L-1) | 0.88±0.16 | 0.87±0.14 | 0.407 | 0.684 |
| After anesthesia induction | ||||
| pH value | 7.35±0.04 | 7.31±0.05 | 0.675 | <0.001 |
| Glu/(mmol·L-1) | 7.72±0.86 | 8.21±1.12 | 3.005 | 0.003 |
| BE/(mmol·L-1) | -0.95±1.42 | -1.65±1.90 | 2.556 | 0.012 |
| Lac/(mmol·L-1) | 1.42±0.30 | 1.76±0.42 | 5.708 | <0.001 |
表10 SIMLE组与CIMLE组内环境稳态指标比较
Tab 10 Comparison of indicators of internal homeostasis between the SIMLE group and CIMLE group
| Variable | SIMLE group (n=75) | CIMLE group (n=75) | Statistic value | P value |
|---|---|---|---|---|
| Before anesthesia induction | ||||
| pH value | 7.42±0.03 | 7.42±0.04 | ‒ | 1.000 |
| Glu/(mmol·L-1) | 5.22±0.51 | 5.15±0.45 | 0.891 | 0.374 |
| BE/(mmol·L-1) | 1.52±1.50 | 1.58±1.25 | 0.266 | 0.790 |
| Lac/(mmol·L-1) | 0.88±0.16 | 0.87±0.14 | 0.407 | 0.684 |
| After anesthesia induction | ||||
| pH value | 7.35±0.04 | 7.31±0.05 | 0.675 | <0.001 |
| Glu/(mmol·L-1) | 7.72±0.86 | 8.21±1.12 | 3.005 | 0.003 |
| BE/(mmol·L-1) | -0.95±1.42 | -1.65±1.90 | 2.556 | 0.012 |
| Lac/(mmol·L-1) | 1.42±0.30 | 1.76±0.42 | 5.708 | <0.001 |
| Variable | SIMLE group (n=88) | McKeown group (n=88) | Statistic value | P value |
|---|---|---|---|---|
| Before anesthesia induction | ||||
| pH value | 7.41±0.03 | 7.41±0.05 | ‒ | 1.000 |
| Glu/(mmol·L-1) | 5.14±0.48 | 5.10±0.44 | 0.576 | 0.565 |
| BE/(mmol·L-1) | 1.54±1.48 | 1.62±1.42 | 0.366 | 0.715 |
| Lac/(mmol·L-1) | 0.88±0.15 | 0.89±0.13 | 0.472 | 0.637 |
| After anesthesia induction | ||||
| pH value | 7.34±0.04 | 7.26±0.05 | 11.720 | <0.001 |
| Glu/(mmol·L-1) | 7.75±0.88 | 8.65±1.18 | 5.736 | <0.001 |
| BE/(mmol·L-1) | -1.05±1.45 | -2.45±1.85 | 5.587 | <0.001 |
| Lac/(mmol·L-1) | 1.45±0.31 | 2.02±0.60 | 7.918 | <0.001 |
表11 SIMLE组与McKeown组内环境稳态指标比较
Tab 11 Comparison of indicators of internal homeostasis between the SIMLE group and McKeown group
| Variable | SIMLE group (n=88) | McKeown group (n=88) | Statistic value | P value |
|---|---|---|---|---|
| Before anesthesia induction | ||||
| pH value | 7.41±0.03 | 7.41±0.05 | ‒ | 1.000 |
| Glu/(mmol·L-1) | 5.14±0.48 | 5.10±0.44 | 0.576 | 0.565 |
| BE/(mmol·L-1) | 1.54±1.48 | 1.62±1.42 | 0.366 | 0.715 |
| Lac/(mmol·L-1) | 0.88±0.15 | 0.89±0.13 | 0.472 | 0.637 |
| After anesthesia induction | ||||
| pH value | 7.34±0.04 | 7.26±0.05 | 11.720 | <0.001 |
| Glu/(mmol·L-1) | 7.75±0.88 | 8.65±1.18 | 5.736 | <0.001 |
| BE/(mmol·L-1) | -1.05±1.45 | -2.45±1.85 | 5.587 | <0.001 |
| Lac/(mmol·L-1) | 1.45±0.31 | 2.02±0.60 | 7.918 | <0.001 |
| Variable | SIMLE group (n=75) | CIMLE group (n=75) | Statistic value | P value |
|---|---|---|---|---|
| Preoperative | 129 (122, 135) | 128 (121, 134) | ‒ | 1.000 |
| Postoperative Day 1 | 123 (117, 129) | 119 (115, 124) | 2.00 | 0.045 |
| Postoperative Day 7 | 135 (131, 139) | 131 (127, 135) | 2.70 | 0.007 |
| Postoperative Day 14 | 139 (135, 143) | 135 (131, 139) | 3.20 | 0.001 |
| Postoperative Month 1 | 145 (141, 148) | 141 (137, 144) | 3.70 | <0.001 |
表12 SIMLE组与CIMLE组不同时点QoR-15量表评分比较(/分)
Tab 12 Comparison of QoR-15 scale scores at different time points between the SIMLE group and CIMLE group (/score)
| Variable | SIMLE group (n=75) | CIMLE group (n=75) | Statistic value | P value |
|---|---|---|---|---|
| Preoperative | 129 (122, 135) | 128 (121, 134) | ‒ | 1.000 |
| Postoperative Day 1 | 123 (117, 129) | 119 (115, 124) | 2.00 | 0.045 |
| Postoperative Day 7 | 135 (131, 139) | 131 (127, 135) | 2.70 | 0.007 |
| Postoperative Day 14 | 139 (135, 143) | 135 (131, 139) | 3.20 | 0.001 |
| Postoperative Month 1 | 145 (141, 148) | 141 (137, 144) | 3.70 | <0.001 |
| Variable | SIMLE group (n=88) | McKeown group (n=88) | Statistic value | P value |
|---|---|---|---|---|
| Preoperative | 128 (121, 135) | 128 (122, 133) | ‒ | 1.000 |
| Postoperative Day 1 | 122 (117, 128) | 115 (111, 120) | 5.86 | <0.001 |
| Postoperative Day 7 | 134 (130, 138) | 125 (121, 129) | 7.64 | <0.001 |
| Postoperative Day 14 | 138 (134, 142) | 129 (125, 133) | 7.92 | <0.001 |
| Postoperative Month 1 | 144 (140, 148) | 133 (129, 137) | 8.49 | <0.001 |
表13 SIMLE组与McKeown组不同时点QoR-15量表评分比较(/分)
Tab 13 Comparison of QoR-15 scale scores at different time points between the SIMLE group and McKeown group (/score)
| Variable | SIMLE group (n=88) | McKeown group (n=88) | Statistic value | P value |
|---|---|---|---|---|
| Preoperative | 128 (121, 135) | 128 (122, 133) | ‒ | 1.000 |
| Postoperative Day 1 | 122 (117, 128) | 115 (111, 120) | 5.86 | <0.001 |
| Postoperative Day 7 | 134 (130, 138) | 125 (121, 129) | 7.64 | <0.001 |
| Postoperative Day 14 | 138 (134, 142) | 129 (125, 133) | 7.92 | <0.001 |
| Postoperative Month 1 | 144 (140, 148) | 133 (129, 137) | 8.49 | <0.001 |
| [1] | Yang H, Wang F, Hallemeier C L, et al. Oesophageal cancer[J]. Lancet, 2024, 404(10466): 1991-2005. |
| [2] | Zhu H C, Ma X, Ye T, et al. Esophageal cancer in China: practice and research in the new era[J]. Int J Cancer, 2023, 152(9): 1741-1751. |
| [3] | Zhang Y J, Dong D, Cao Y Q, et al. Robotic versus conventional minimally invasive esophagectomy for esophageal cancer: a meta-analysis[J]. Ann Surg, 2023, 278(1): 39-50. |
| [4] | 舒欣, 朱易紫婷, 李雨捷, 等. 《食管癌手术加速康复策略麻醉专家共识》解读[J]. 西部医学, 2024, 36(12): 1717-1721. |
| Shu X, Zhu Y Z T, Li Y J, et al. Interpretation of expert consensus on anesthesia in enhanced recovery after surgery for esophageal cancer surgery[J]. Medical Journal of West China, 2024, 36(12): 1717-1721. | |
| [5] | 卢万里, 王俊钢, 郝蒙福. 充气纵隔镜与胸腔镜联合腹腔镜手术治疗早期食管癌的临床效果比较[J]. 河南医学研究, 2025, 34(3): 460-463. |
| Lu W L,Wang J G, Hao M F. Comparison of clinical effects on pneumatic mediastinoscopy and thoracoscopic combined with laparoscopic surgery in the treatment of early esophageal cancer[J]. Henan Medical Research, 2025,34(3):460-463. | |
| [6] | Tejada B, Giannaris E S, Hashemi S, et al. Comparison of the ivor-lewis vs McKeown procedure in esophageal cancers: an updated meta-analysis and systematic review[J]. Am Surg, 2025, 91(11): 1974-1982. |
| [7] | Booka E, Takeuchi H. Current advances and challenges in minimally invasive esophagectomy[J]. Int J Clin Oncol, 2025, 30(8): 1463-1474. |
| [8] | Fujita T. Robot-assisted transcervical esophagectomy for thoracic esophageal carcinoma[J]. J Chest Surg, 2025, 58(5): 209-213. |
| [9] | 张锋, 许诺, 韦海涛, 等. 充气式纵隔镜同步腹腔镜对比McKeown术式治疗食管癌的回顾性队列对比研究[J]. 中国肿瘤临床, 2026, 53(3): 109-115. |
| Zhang F, Xu N, Wei H T, et al. A retrospective cohort comparative study of pneumatic mediastinoscopic synchronous laparoscopy versus the McKeown procedure for the treatment of esophageal cancer[J]. Chinese Journal of Clinical Oncology, 2026, 53(3): 109-115. | |
| [10] | Stark P A, Myles P S, Burke J A. Development and psychometric evaluation of a postoperative quality of recovery score: the QoR-15[J]. Anesthesiology, 2013, 118(6): 1332-1340. |
| [11] | Ofuchi T, Kosumi K, Iwatuski M. Advancing surgical options in esophageal cancer: key findings from the ROMIO randomized clinical trial[J]. J Thorac Dis, 2025, 17(1): 5-9. |
| [12] | Patton A, Davey M G, Quinn E, et al. Minimally invasive vs open vs hybrid esophagectomy for esophageal cancer: a systematic review and network meta-analysis[J]. Dis Esophagus, 2024, 37(12): doae086. |
| [1] | 林子博, 裘佳培, 孙延军, 姚皓弋, 任挺, 赵强. 经左胸小切口多支冠状动脉搭桥与杂交冠状动脉血运重建的对比研究:近中期临床疗效分析[J]. 上海交通大学学报(医学版), 2025, 45(12): 1598-1605. |
| [2] | 张晓彬, 刘鹏, 刘智超, 杨洋, 李斌, 孙益峰, 华荣, 郭旭峰, 何毅, 顾海勇, 李志刚. Ⅰ期食管鳞癌的生物学特征和外科治疗结果[J]. 上海交通大学学报(医学版), 2021, 41(2): 202-209. |
| [3] | 张冬蕾, 魏华兵, 周力璜, 钱晓哲. 快速康复外科联合胸腹腔镜下食管癌根治术对老年患者的疗效分析[J]. 上海交通大学学报(医学版), 2021, 41(1): 74-77. |
| [4] | 董琦,孙为增,王玉芸,张京. 腹腔镜下行Soave根治术治疗先天性巨结肠患儿的疗效评估[J]. 上海交通大学学报(医学版), 2018, 38(7): 841-. |
| [5] | 王洁 1,杨克 2,陈敬贤 1,吕玲玲 1,卞晓岚 3,郑岚 1. 徐黄合剂对糖尿病性下肢动脉硬化闭塞症的疗效观察[J]. 上海交通大学学报(医学版), 2018, 38(11): 1333-. |
| [6] | 林智恺,束蓉,钱洁蕾,谢玉峰. 改良侧向转位冠向复位瓣联合结缔组织移植治疗单牙重度牙龈退缩的临床效果[J]. 上海交通大学学报(医学版), 2017, 37(5): 656-. |
| [7] | 张琳袁,张明,达骏. mTOR抑制剂依维莫司在肾细胞癌治疗中的应用[J]. 上海交通大学学报(医学版), 2016, 36(12): 1812-. |
| [8] | 陈 炯,闫培芳,孙 喆. 三种脱敏剂治疗牙颈部牙本质敏感症的疗效观察[J]. 上海交通大学学报(医学版), 2013, 33(8): 1122-. |
| 阅读次数 | ||||||
|
全文 |
|
|||||
|
摘要 |
|
|||||
