Journal of Shanghai Jiao Tong University (Medical Science) ›› 2024, Vol. 44 ›› Issue (2): 212-222.doi: 10.3969/j.issn.1674-8115.2024.02.007
• Clinical research • Previous Articles Next Articles
WU Lirong1( ), CHEN Ruihua2, CHAO Xiaowen1, GUO Yuhuai1, SUN Tao1, LI Mengci1, CHEN Tianlu1()
Received:2023-08-03
Accepted:2023-11-30
Online:2024-02-28
Published:2024-02-28
Contact:
CHEN Tianlu
E-mail:wlr7089@163.com;chentianlu@sjtu.edu.cn
Supported by:CLC Number:
WU Lirong, CHEN Ruihua, CHAO Xiaowen, GUO Yuhuai, SUN Tao, LI Mengci, CHEN Tianlu. Study of metabolic association between elevated fasting blood glucose and cognitive deterioration[J]. Journal of Shanghai Jiao Tong University (Medical Science), 2024, 44(2): 212-222.
Add to citation manager EndNote|Ris|BibTeX
URL: https://xuebao.shsmu.edu.cn/EN/10.3969/j.issn.1674-8115.2024.02.007
| Characteristic | Total (n=1 317) | Normal FBG (n=1 153) | High FBG (n=164) | χ2/U value | P value |
|---|---|---|---|---|---|
| Glucose/(mmol·L-1) | 5.36±0.90 | 5.11±0.47 | 7.10±1.23 | 0.00 | 0.000 |
| Age/year | 73.86±7.04 | 73.78±7.11 | 74.43±6.44 | 89 440.50 | 0.263 |
| BMI/(kg·m-2) | 26.80±4.61 | 26.80±4.53 | 26.78±5.12 | 73 600.50 | 0.475 |
| Gender/n(%) | 7.64 | 0.006 | |||
| Male | 727 (55.20) | 620 (53.77) | 107 (65.24) | ||
| Female | 590 (44.80) | 533 (46.23) | 57 (34.76) | ||
| Education/year | 15.94±2.79 | 15.94±2.81 | 15.95±2.66 | 93 899.50 | 0.886 |
| Race/n(%) | 23.57 | 0.001 | |||
| White | 1 224 (92.94) | 1 081 (93.76) | 143 (87.20) | ||
| Black | 52 (3.95) | 41 (3.56) | 11 (6.71) | ||
| Asian | 22 (1.67) | 18 (1.56) | 4 (2.44) | ||
| Other | 19 (1.44) | 13 (1.13) | 6 (3.66) | ||
| APOE4/n(%) | 0.05 | 0.828 | |||
| Negative | 693 (52.62) | 608 (52.73) | 85 (51.83) | ||
| Positive | 624 (47.38) | 545 (47.27) | 79 (48.17) |
Tab 1 Comparison of baseline characteristics between the normal FBG group and high FBG group
| Characteristic | Total (n=1 317) | Normal FBG (n=1 153) | High FBG (n=164) | χ2/U value | P value |
|---|---|---|---|---|---|
| Glucose/(mmol·L-1) | 5.36±0.90 | 5.11±0.47 | 7.10±1.23 | 0.00 | 0.000 |
| Age/year | 73.86±7.04 | 73.78±7.11 | 74.43±6.44 | 89 440.50 | 0.263 |
| BMI/(kg·m-2) | 26.80±4.61 | 26.80±4.53 | 26.78±5.12 | 73 600.50 | 0.475 |
| Gender/n(%) | 7.64 | 0.006 | |||
| Male | 727 (55.20) | 620 (53.77) | 107 (65.24) | ||
| Female | 590 (44.80) | 533 (46.23) | 57 (34.76) | ||
| Education/year | 15.94±2.79 | 15.94±2.81 | 15.95±2.66 | 93 899.50 | 0.886 |
| Race/n(%) | 23.57 | 0.001 | |||
| White | 1 224 (92.94) | 1 081 (93.76) | 143 (87.20) | ||
| Black | 52 (3.95) | 41 (3.56) | 11 (6.71) | ||
| Asian | 22 (1.67) | 18 (1.56) | 4 (2.44) | ||
| Other | 19 (1.44) | 13 (1.13) | 6 (3.66) | ||
| APOE4/n(%) | 0.05 | 0.828 | |||
| Negative | 693 (52.62) | 608 (52.73) | 85 (51.83) | ||
| Positive | 624 (47.38) | 545 (47.27) | 79 (48.17) |
| Characteristic | Without cognitive deterioration (n=989) | With cognitive deterioration (n=328) | χ2/U value | P value |
|---|---|---|---|---|
| Glucose/(mmol·L-1) | 5.34±0.86 | 5.41±1.02 | 158 106.00 | 0.493 |
| Age/year | 73.62±7.08 | 74.59±6.84 | 147 380.00 | 0.013 |
| BMI/(kg·m-2) | 26.79±4.65 | 26.82±4.47 | 126 838.50 | 0.700 |
| Gender/n(%) | 5.28 | 0.022 | ||
| Male | 528 (53.90) | 199 (60.67) | ||
| Female | 461 (46.61) | 129 (39.33) | ||
| Education/year | 15.93±2.83 | 15.98±2.65 | 161 357.50 | 0.887 |
| Race/n(%) | 4.66 | 0.588 | ||
| White | 913 (92.32) | 311 (94.82) | ||
| Black | 41 (4.15) | 11 (3.35) | ||
| Asian | 17 (1.72) | 5 (1.52) | ||
| Other | 18 (1.82) | 1 (0.30) | ||
| APOE4/n(%) | 29.54 | 0.000 | ||
| Negative | 563 (56.93) | 130 (39.63) | ||
| Positive | 426 (43.07) | 198 (60.37) |
Tab 2 Comparison of baseline characteristics between individuals without and with cognitive deterioration (all data)
| Characteristic | Without cognitive deterioration (n=989) | With cognitive deterioration (n=328) | χ2/U value | P value |
|---|---|---|---|---|
| Glucose/(mmol·L-1) | 5.34±0.86 | 5.41±1.02 | 158 106.00 | 0.493 |
| Age/year | 73.62±7.08 | 74.59±6.84 | 147 380.00 | 0.013 |
| BMI/(kg·m-2) | 26.79±4.65 | 26.82±4.47 | 126 838.50 | 0.700 |
| Gender/n(%) | 5.28 | 0.022 | ||
| Male | 528 (53.90) | 199 (60.67) | ||
| Female | 461 (46.61) | 129 (39.33) | ||
| Education/year | 15.93±2.83 | 15.98±2.65 | 161 357.50 | 0.887 |
| Race/n(%) | 4.66 | 0.588 | ||
| White | 913 (92.32) | 311 (94.82) | ||
| Black | 41 (4.15) | 11 (3.35) | ||
| Asian | 17 (1.72) | 5 (1.52) | ||
| Other | 18 (1.82) | 1 (0.30) | ||
| APOE4/n(%) | 29.54 | 0.000 | ||
| Negative | 563 (56.93) | 130 (39.63) | ||
| Positive | 426 (43.07) | 198 (60.37) |
| Characteristic | Without cognitive deterioration (n=878) | With cognitive deterioration (n=275) | χ2/U value | P value |
|---|---|---|---|---|
| Glucose/(mmol·L-1) | 5.11±0.47 | 5.09±0.46 | 117 183.00 | 0.462 |
| Age/year | 73.57±7.15 | 74.45±6.96 | 110 131.50 | 0.028 |
| BMI/(kg·m-2) | 26.80±4.60 | 26.80±4.32 | 93 583.00 | 0.627 |
| Gender/n(%) | 3.31 | 0.069 | ||
| Male | 459 (52.28) | 161 (58.55) | ||
| Female | 419 (47.72) | 114 (41.45) | ||
| Education/year | 15.96±2.84 | 15.90 ± 2.70 | 118 879.00 | 0.698 |
| Race/n(%) | 5.33 | 0.377 | ||
| White | 817 (93.05) | 264 (96.00) | ||
| Black | 34 (3.87) | 7 (2.55) | ||
| Asian | 14 (1.59) | 4 (1.45) | ||
| Other | 13 (1.48) | 0 (0) | ||
| APOE4/n(%) | 26.25 | 0.000 | ||
| Negative | 500 (56.95) | 108 (39.27) | ||
| Positive | 378 (43.05) | 167 (60.73) |
Tab 3 Comparison of baseline characteristics between individuals without and with cognitive deterioration (normal FBG group)
| Characteristic | Without cognitive deterioration (n=878) | With cognitive deterioration (n=275) | χ2/U value | P value |
|---|---|---|---|---|
| Glucose/(mmol·L-1) | 5.11±0.47 | 5.09±0.46 | 117 183.00 | 0.462 |
| Age/year | 73.57±7.15 | 74.45±6.96 | 110 131.50 | 0.028 |
| BMI/(kg·m-2) | 26.80±4.60 | 26.80±4.32 | 93 583.00 | 0.627 |
| Gender/n(%) | 3.31 | 0.069 | ||
| Male | 459 (52.28) | 161 (58.55) | ||
| Female | 419 (47.72) | 114 (41.45) | ||
| Education/year | 15.96±2.84 | 15.90 ± 2.70 | 118 879.00 | 0.698 |
| Race/n(%) | 5.33 | 0.377 | ||
| White | 817 (93.05) | 264 (96.00) | ||
| Black | 34 (3.87) | 7 (2.55) | ||
| Asian | 14 (1.59) | 4 (1.45) | ||
| Other | 13 (1.48) | 0 (0) | ||
| APOE4/n(%) | 26.25 | 0.000 | ||
| Negative | 500 (56.95) | 108 (39.27) | ||
| Positive | 378 (43.05) | 167 (60.73) |
| Characteristic | Without cognitive impairment (n=111) | With cognitive impairment (n=53) | χ2/U value | P value |
|---|---|---|---|---|
| Glucose/(mmol·L-1) | 7.11±1.13 | 7.09±1.42 | 2 569.00 | 0.190 |
| Age/year | 74.00±6.54 | 75.33±6.19 | 2 635.50 | 0.282 |
| BMI/(kg·m-2) | 26.72±5.07 | 26.90±5.27 | 2 383.50 | 0.956 |
| Gender/n(%) | 1.44 | 0.230 | ||
| Male | 69 (62.16) | 38 (71.70) | ||
| Female | 42 (37.84) | 15 (28.30) | ||
| Education/year | 15.73±2.77 | 16.42±2.37 | 2 565.50 | 0.177 |
| Race/n(%) | 1.25 | 0.869 | ||
| White | 96 (86.49) | 47 (88.68) | ||
| Black | 7 (6.31) | 4 (7.55) | ||
| Asian | 3 (2.70) | 1 (1.89) | ||
| Other | 5 (4.50) | 1 (1.89) | ||
| APOE4/n(%) | 3.34 | 0.068 | ||
| Negative | 63 (56.76) | 22 (41.51) | ||
| Positive | 48 (43.24) | 31 (58.49) |
Tab 4 Comparison of baseline characteristics between individuals without and with cognitive deterioration (high FBG group)
| Characteristic | Without cognitive impairment (n=111) | With cognitive impairment (n=53) | χ2/U value | P value |
|---|---|---|---|---|
| Glucose/(mmol·L-1) | 7.11±1.13 | 7.09±1.42 | 2 569.00 | 0.190 |
| Age/year | 74.00±6.54 | 75.33±6.19 | 2 635.50 | 0.282 |
| BMI/(kg·m-2) | 26.72±5.07 | 26.90±5.27 | 2 383.50 | 0.956 |
| Gender/n(%) | 1.44 | 0.230 | ||
| Male | 69 (62.16) | 38 (71.70) | ||
| Female | 42 (37.84) | 15 (28.30) | ||
| Education/year | 15.73±2.77 | 16.42±2.37 | 2 565.50 | 0.177 |
| Race/n(%) | 1.25 | 0.869 | ||
| White | 96 (86.49) | 47 (88.68) | ||
| Black | 7 (6.31) | 4 (7.55) | ||
| Asian | 3 (2.70) | 1 (1.89) | ||
| Other | 5 (4.50) | 1 (1.89) | ||
| APOE4/n(%) | 3.34 | 0.068 | ||
| Negative | 63 (56.76) | 22 (41.51) | ||
| Positive | 48 (43.24) | 31 (58.49) |
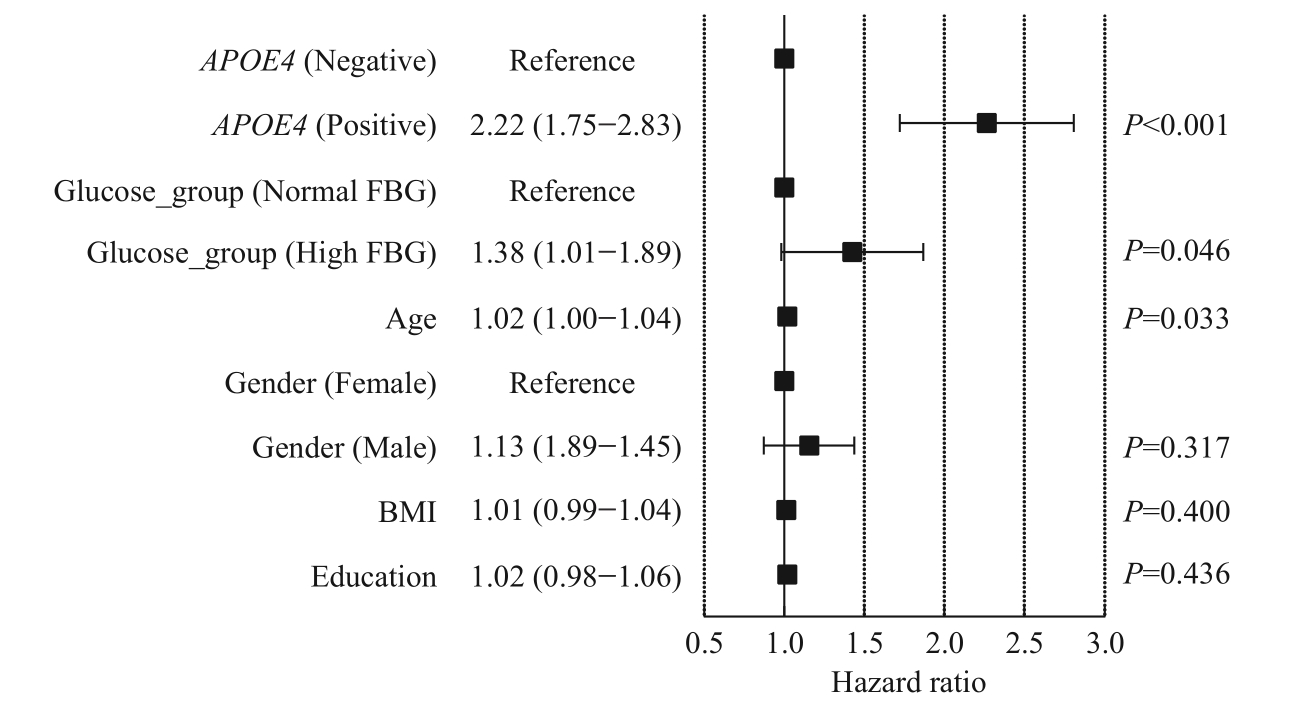
Fig 1 Cox proportional hazards analysis forest plot
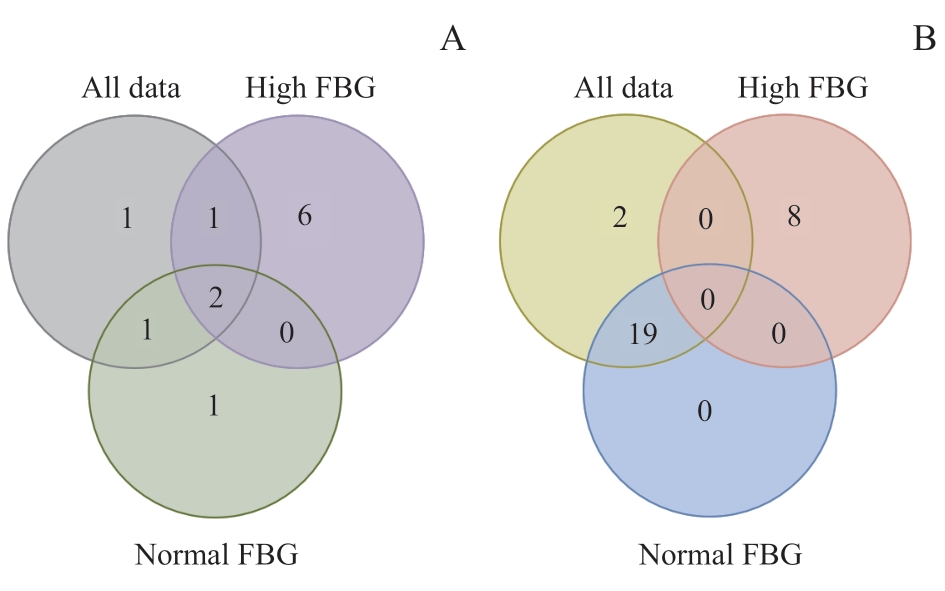
Fig 2 Venn diagram of differential metabolites
| Indicator | P value | Trend | VIP value |
|---|---|---|---|
| All data | |||
| Sphingomyelins | 0.041 | ↓ | 1.66 |
| Phospholipids to total lipids ratio in medium HDL | 0.011 | ↑ | 1.93 |
| Cholesterol to total lipids ratio in medium HDL | 0.037 | ↓ | 1.31 |
| Phospholipids to total lipids ratio in IDL | 0.034 | ↑ | 2.71 |
| Phospholipids to total lipids ratio in very small VLDL | 0.009 | ↑ | 2.39 |
| Normal FBG group | |||
| Cholesteryl esters to total lipids ratio in large HDL | 0.026 | ↓ | 1.13 |
| Phospholipids to total lipids ratio in medium HDL | 0.020 | ↑ | 2.23 |
| Cholesterol to total lipids ratio in medium HDL | 0.045 | ↓ | 1.78 |
| Phospholipids to total lipids ratio in very small VLDL | 0.049 | ↑ | 2.51 |
| High FBG group | |||
| Valine | 0.023 | ↑ | 1.02 |
| Histidine | 0.014 | ↑ | 1.38 |
| Phospholipids to total lipids ratio in medium HDL | 0.042 | ↑ | 1.08 |
| Free cholesterol to total lipids ratio in small HDL | 0.017 | ↓ | 1.21 |
| Cholesteryl esters to total lipids ratio in IDL | 0.044 | ↓ | 1.53 |
| Phospholipids to total lipids ratio in IDL | 0.010 | ↑ | 2.16 |
| Phospholipids to total lipids ratio in very large VLDL | 0.049 | ↑ | 1.91 |
| Free cholesterol to total lipids ratio in very large VLDL | 0.016 | ↑ | 1.92 |
| Phospholipids to total lipids ratio in very small VLDL | 0.033 | ↑ | 1.75 |
Tab 5 Differential metabolic indicators between the individuals without and with cognitive deterioration at baseline (all data)
| Indicator | P value | Trend | VIP value |
|---|---|---|---|
| All data | |||
| Sphingomyelins | 0.041 | ↓ | 1.66 |
| Phospholipids to total lipids ratio in medium HDL | 0.011 | ↑ | 1.93 |
| Cholesterol to total lipids ratio in medium HDL | 0.037 | ↓ | 1.31 |
| Phospholipids to total lipids ratio in IDL | 0.034 | ↑ | 2.71 |
| Phospholipids to total lipids ratio in very small VLDL | 0.009 | ↑ | 2.39 |
| Normal FBG group | |||
| Cholesteryl esters to total lipids ratio in large HDL | 0.026 | ↓ | 1.13 |
| Phospholipids to total lipids ratio in medium HDL | 0.020 | ↑ | 2.23 |
| Cholesterol to total lipids ratio in medium HDL | 0.045 | ↓ | 1.78 |
| Phospholipids to total lipids ratio in very small VLDL | 0.049 | ↑ | 2.51 |
| High FBG group | |||
| Valine | 0.023 | ↑ | 1.02 |
| Histidine | 0.014 | ↑ | 1.38 |
| Phospholipids to total lipids ratio in medium HDL | 0.042 | ↑ | 1.08 |
| Free cholesterol to total lipids ratio in small HDL | 0.017 | ↓ | 1.21 |
| Cholesteryl esters to total lipids ratio in IDL | 0.044 | ↓ | 1.53 |
| Phospholipids to total lipids ratio in IDL | 0.010 | ↑ | 2.16 |
| Phospholipids to total lipids ratio in very large VLDL | 0.049 | ↑ | 1.91 |
| Free cholesterol to total lipids ratio in very large VLDL | 0.016 | ↑ | 1.92 |
| Phospholipids to total lipids ratio in very small VLDL | 0.033 | ↑ | 1.75 |
| Indicator | P value | Trend | VIP value |
|---|---|---|---|
| All data | |||
| Leucine | 0.001 | ↑ | 1.03 |
| Phenylalanine | <0.001 | ↑ | 1.63 |
| Albumin | 0.008 | ↑ | 1.24 |
| Total lipids in very large HDL | 0.046 | ↓ | 2.06 |
| Free cholesterol in very large HDL | 0.027 | ↓ | 2.48 |
| Phospholipids in very large HDL | 0.030 | ↓ | 2.14 |
| Cholesterol to total lipids ratio in very large HDL | 0.029 | ↑ | 2.08 |
| Cholesteryl esters to total lipids ratio in very large HDL | 0.006 | ↑ | 2.40 |
| Phospholipids to total lipids ratio in very large HDL | 0.017 | ↓ | 2.37 |
| Free cholesterol to total lipids ratio in large HDL | 0.014 | ↓ | 1.73 |
| Concentration of small HDL particles | 0.002 | ↑ | 2.78 |
| Total lipids in small HDL | 0.007 | ↑ | 2.38 |
| Total cholesterol in small HDL | 0.004 | ↑ | 2.83 |
| Free cholesterol in small HDL | 0.027 | ↑ | 1.91 |
| Cholesterol esters in small HDL | 0.002 | ↑ | 3.04 |
| Phospholipids in small HDL | 0.022 | ↑ | 2.05 |
| Cholesterol to total lipids ratio in small LDL | 0.002 | ↑ | 2.28 |
| Cholesteryl esters to total lipids ratio in small LDL | 0.004 | ↑ | 1.16 |
| Phospholipids to total lipids ratio in small LDL | 0.001 | ↓ | 1.85 |
| Cholesterol to total lipids ratio in very large VLDL | 0.045 | ↑ | 1.22 |
| Cholesteryl esters to total lipids ratio in very large VLDL | 0.038 | ↑ | 1.55 |
| Normal FBG group | |||
| Phenylalanine | <0.001 | ↑ | 1.64 |
| Leucine | 0.005 | ↑ | 1.01 |
| Albumin | 0.030 | ↑ | 1.35 |
| Cholesterol to total lipids ratio in very large HDL | 0.043 | ↑ | 2.22 |
| Cholesteryl esters to total lipids ratio in very large HDL | 0.014 | ↑ | 2.57 |
| Phospholipids to total lipids ratio in very large HDL | 0.044 | ↓ | 2.14 |
| Free cholesterol in very large HDL | 0.048 | ↓ | 2.32 |
| Free cholesterol to total lipids ratio in large HDL | 0.022 | ↓ | 1.50 |
| Concentration of small HDL particles | 0.005 | ↑ | 2.95 |
| Total lipids in small HDL | 0.011 | ↑ | 2.60 |
| Free cholesterol in small HDL | 0.030 | ↑ | 2.19 |
| Total cholesterol in small HDL | 0.008 | ↑ | 2.97 |
| Cholesterol esters in small HDL | 0.006 | ↑ | 3.14 |
| Phospholipids in small HDL | 0.029 | ↑ | 2.29 |
| Cholesterol to total lipids ratio in small LDL | 0.003 | ↑ | 2.70 |
| Cholesteryl esters to total lipids ratio in small LDL | 0.003 | ↑ | 1.71 |
| Phospholipids to total lipids ratio in small LDL | 0.002 | ↓ | 2.26 |
| Cholesterol to total lipids ratio in very large VLDL | 0.042 | ↑ | 1.40 |
| Cholesteryl esters to total lipids ratio in very large VLDL | 0.043 | ↑ | 1.64 |
| High FBG group | |||
| Concentration of medium LDL particles | 0.031 | ↑ | 1.93 |
| Total lipids in medium LDL | 0.030 | ↑ | 2.15 |
| Cholesterol esters in medium LDL | 0.033 | ↑ | 2.15 |
| Phospholipids in medium LDL | 0.023 | ↑ | 2.18 |
| Phospholipids to total lipids ratio in IDL | 0.037 | ↓ | 1.94 |
| Total lipids in small LDL | 0.036 | ↑ | 1.96 |
| Cholesterol esters in small LDL | 0.049 | ↑ | 1.95 |
| Phospholipids in small LDL | 0.043 | ↑ | 1.82 |
Tab 6 Differential metabolic indicators between the individuals with cognitive deterioration before and after cognitive deterioration
| Indicator | P value | Trend | VIP value |
|---|---|---|---|
| All data | |||
| Leucine | 0.001 | ↑ | 1.03 |
| Phenylalanine | <0.001 | ↑ | 1.63 |
| Albumin | 0.008 | ↑ | 1.24 |
| Total lipids in very large HDL | 0.046 | ↓ | 2.06 |
| Free cholesterol in very large HDL | 0.027 | ↓ | 2.48 |
| Phospholipids in very large HDL | 0.030 | ↓ | 2.14 |
| Cholesterol to total lipids ratio in very large HDL | 0.029 | ↑ | 2.08 |
| Cholesteryl esters to total lipids ratio in very large HDL | 0.006 | ↑ | 2.40 |
| Phospholipids to total lipids ratio in very large HDL | 0.017 | ↓ | 2.37 |
| Free cholesterol to total lipids ratio in large HDL | 0.014 | ↓ | 1.73 |
| Concentration of small HDL particles | 0.002 | ↑ | 2.78 |
| Total lipids in small HDL | 0.007 | ↑ | 2.38 |
| Total cholesterol in small HDL | 0.004 | ↑ | 2.83 |
| Free cholesterol in small HDL | 0.027 | ↑ | 1.91 |
| Cholesterol esters in small HDL | 0.002 | ↑ | 3.04 |
| Phospholipids in small HDL | 0.022 | ↑ | 2.05 |
| Cholesterol to total lipids ratio in small LDL | 0.002 | ↑ | 2.28 |
| Cholesteryl esters to total lipids ratio in small LDL | 0.004 | ↑ | 1.16 |
| Phospholipids to total lipids ratio in small LDL | 0.001 | ↓ | 1.85 |
| Cholesterol to total lipids ratio in very large VLDL | 0.045 | ↑ | 1.22 |
| Cholesteryl esters to total lipids ratio in very large VLDL | 0.038 | ↑ | 1.55 |
| Normal FBG group | |||
| Phenylalanine | <0.001 | ↑ | 1.64 |
| Leucine | 0.005 | ↑ | 1.01 |
| Albumin | 0.030 | ↑ | 1.35 |
| Cholesterol to total lipids ratio in very large HDL | 0.043 | ↑ | 2.22 |
| Cholesteryl esters to total lipids ratio in very large HDL | 0.014 | ↑ | 2.57 |
| Phospholipids to total lipids ratio in very large HDL | 0.044 | ↓ | 2.14 |
| Free cholesterol in very large HDL | 0.048 | ↓ | 2.32 |
| Free cholesterol to total lipids ratio in large HDL | 0.022 | ↓ | 1.50 |
| Concentration of small HDL particles | 0.005 | ↑ | 2.95 |
| Total lipids in small HDL | 0.011 | ↑ | 2.60 |
| Free cholesterol in small HDL | 0.030 | ↑ | 2.19 |
| Total cholesterol in small HDL | 0.008 | ↑ | 2.97 |
| Cholesterol esters in small HDL | 0.006 | ↑ | 3.14 |
| Phospholipids in small HDL | 0.029 | ↑ | 2.29 |
| Cholesterol to total lipids ratio in small LDL | 0.003 | ↑ | 2.70 |
| Cholesteryl esters to total lipids ratio in small LDL | 0.003 | ↑ | 1.71 |
| Phospholipids to total lipids ratio in small LDL | 0.002 | ↓ | 2.26 |
| Cholesterol to total lipids ratio in very large VLDL | 0.042 | ↑ | 1.40 |
| Cholesteryl esters to total lipids ratio in very large VLDL | 0.043 | ↑ | 1.64 |
| High FBG group | |||
| Concentration of medium LDL particles | 0.031 | ↑ | 1.93 |
| Total lipids in medium LDL | 0.030 | ↑ | 2.15 |
| Cholesterol esters in medium LDL | 0.033 | ↑ | 2.15 |
| Phospholipids in medium LDL | 0.023 | ↑ | 2.18 |
| Phospholipids to total lipids ratio in IDL | 0.037 | ↓ | 1.94 |
| Total lipids in small LDL | 0.036 | ↑ | 1.96 |
| Cholesterol esters in small LDL | 0.049 | ↑ | 1.95 |
| Phospholipids in small LDL | 0.043 | ↑ | 1.82 |
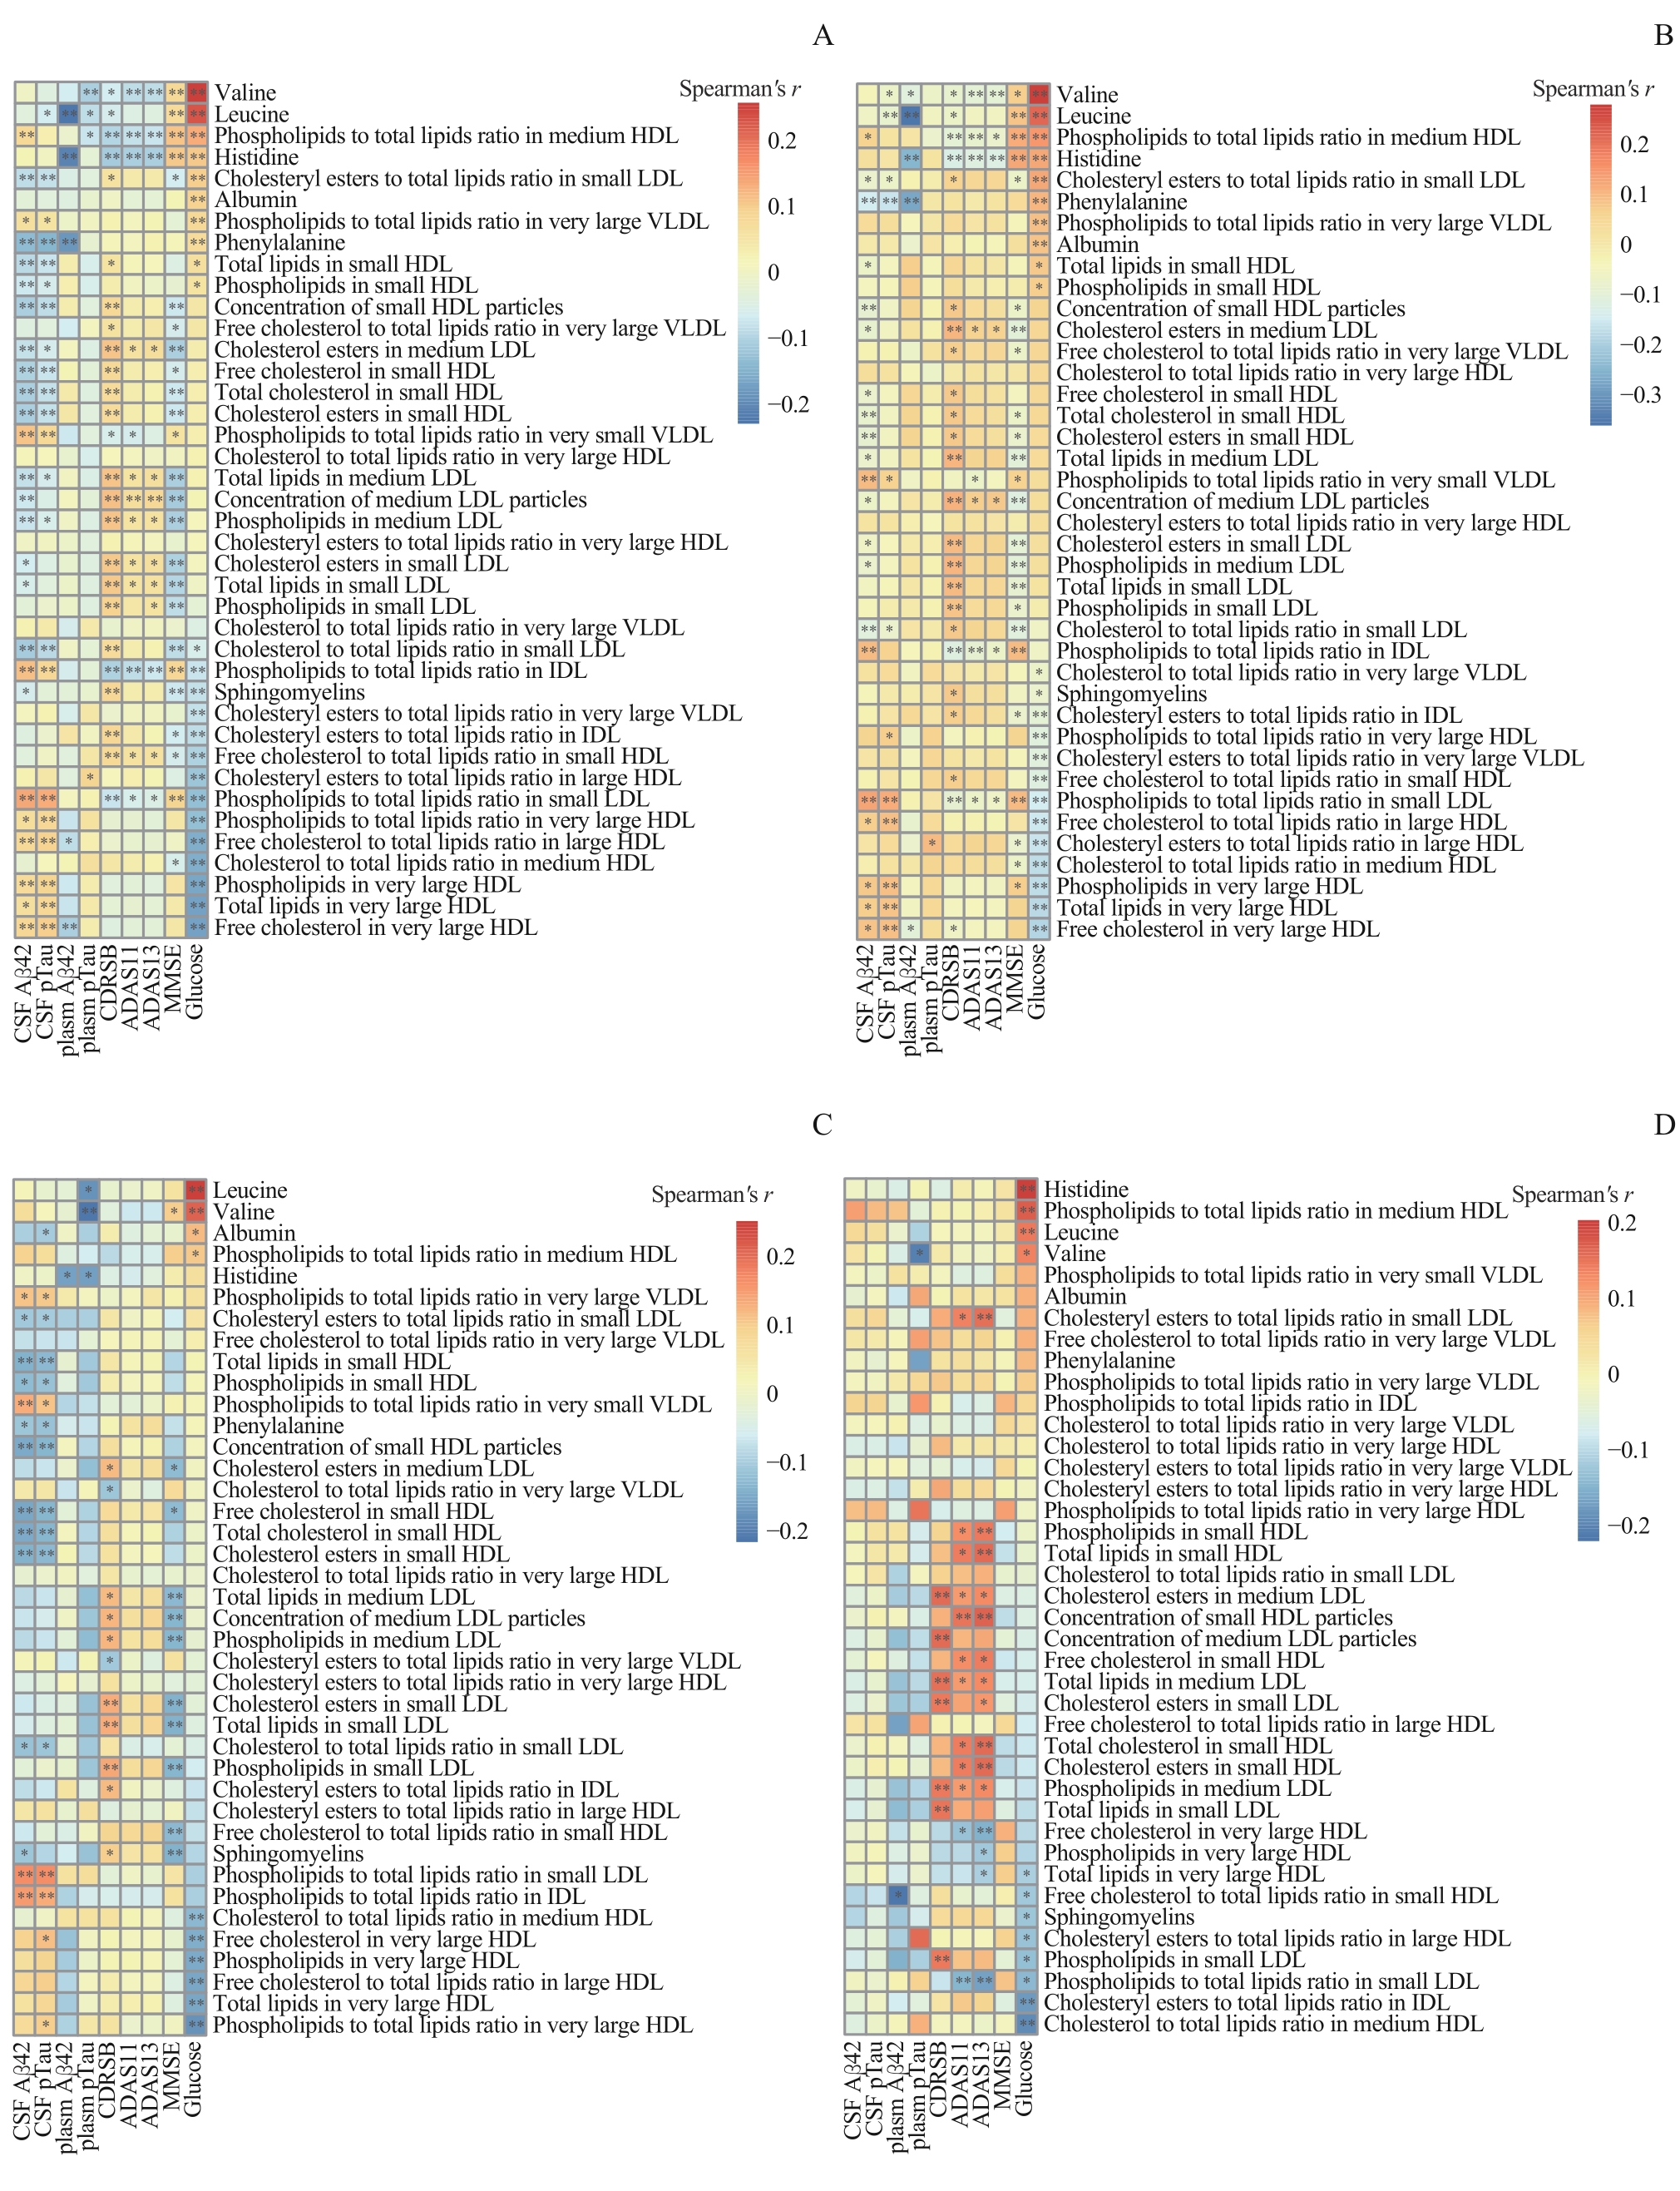
Fig 3 Spearman's correlation analysis heatmap between metabolites and indicators of cognitive impairment
| 1 | 《中国老年2型糖尿病防治临床指南》编写组. 中国老年2型糖尿病防治临床指南(2022年版)[J]. 中国糖尿病杂志, 2022, 30(1): 2-51. |
| Authoring Committee for the Clinical Guidelines on the Prevention and Treatment of Elderly Diabetes in China. Clinical guidelines for the prevention and treatment of type 2 diabetes mellitus in the elderly in China (2022 edition)[J]. Chinese Journal of Diabetes Mellitus, 2022, 30(1): 2-51. | |
| 2 | 中华医学会内分泌学分会. 糖尿病患者认知功能障碍专家共识[J]. 中华糖尿病杂志, 2021, 13(7): 678-694. |
| Chinese Society of Endocrinology. Expert consensus on cognitive dysfunction in patients with diabetes mellitus[J]. Chinese Journal of Diabetes Mellitus, 2021, 13(7): 678-694. | |
| 3 | HOWARTH C, GLEESON P, ATTWELL D. Updated energy budgets for neural computation in the neocortex and cerebellum[J]. J Cereb Blood Flow Metab, 2012, 32(7): 1222-1232. |
| 4 | CAMANDOLA S, MATTSON M P. Brain metabolism in health, aging, and neurodegeneration[J]. EMBO J, 2017, 36(11): 1474-1492. |
| 5 | SZABLEWSKI L. Glucose transporters in brain: in health and in Alzheimer's disease[J]. J Alzheimers Dis, 2017, 55(4): 1307-1320. |
| 6 | BAO H, LIU Y M, ZHANG M G, et al. Increased β-site APP cleaving enzyme 1-mediated insulin receptor cleavage in type 2 diabetes mellitus with cognitive impairment[J]. Alzheimers Dement, 2021, 17(7): 1097-1108. |
| 7 | QU M L, ZUO L H, ZHANG M R, et al. High glucose induces tau hyperphosphorylation in hippocampal neurons via inhibition of ALKBH5-mediated Dgkh m6A demethylation: a potential mechanism for diabetic cognitive dysfunction[J]. Cell Death Dis, 2023, 14(6): 385. |
| 8 | WANG J, LI L, ZHANG Z, et al. Extracellular vesicles mediate the communication of adipose tissue with brain and promote cognitive impairment associated with insulin resistance[J]. Cell Metab, 2022, 34(9): 1264-1279.e8. |
| 9 | NHO K, KUEIDER-PAISLEY A, MAHMOUDIANDEHKORDI S, et al. Altered bile acid profile in mild cognitive impairment and Alzheimer's disease: relationship to neuroimaging and CSF biomarkers[J]. Alzheimers Dement, 2019, 15(2): 232-244. |
| 10 | SOININEN P, KANGAS A J, WÜRTZ P, et al. High-throughput serum NMR metabonomics for cost-effective holistic studies on systemic metabolism[J]. Analyst, 2009, 134(9): 1781-1785. |
| 11 | PETERSEN R C, AISEN P S, BECKETT L A, et al. Alzheimer's Disease Neuroimaging Initiative (ADNI): clinical characterization[J]. Neurology, 2010, 74(3): 201-209. |
| 12 | MCKHANN G, DRACHMAN D, FOLSTEIN M, et al. Clinical diagnosis of Alzheimer's disease: report of the NINCDS-ADRDA Work Group under the auspices of Department of Health and Human Services Task Force on Alzheimer's Disease[J]. Neurology, 1984, 34(7): 939-944. |
| 13 | JAGIELSKI A C, JIANG C Q, XU L, et al. Glycaemia is associated with cognitive impairment in older adults: the Guangzhou Biobank Cohort Study[J]. Age Ageing, 2015, 44(1): 65-71. |
| 14 | GONZÁLEZ H M, TARRAF W, GONZÁLEZ K A, et al. Diabetes, cognitive decline, and mild cognitive impairment among diverse Hispanics/Latinos: study of Latinos-investigation of neurocognitive aging results (HCHS/SOL)[J]. Diabetes Care, 2020, 43(5): 1111-1117. |
| 15 | WOODIE L, BLYTHE S. The differential effects of high-fat and high-fructose diets on physiology and behavior in male rats[J]. Nutr Neurosci, 2018, 21(5): 328-336. |
| 16 | TAN B L, NORHAIZAN M E. Effect of high-fat diets on oxidative stress, cellular inflammatory response and cognitive function[J]. Nutrients, 2019, 11(11): 2579. |
| 17 | REITZ C, TANG M X, LUCHSINGER J, et al. Relation of plasma lipids to Alzheimer disease and vascular dementia[J]. Arch Neurol, 2004, 61(5): 705-714. |
| 18 | BAUMGART M, SNYDER H M, CARRILLO M C, et al. Summary of the evidence on modifiable risk factors for cognitive decline and dementia: a population-based perspective[J]. Alzheimer's Dement, 2015, 11(6): 718-726. |
| 19 | STROM B L, SCHINNAR R, KARLAWISH J, et al. Statin therapy and risk of acute memory impairment[J]. JAMA Intern Med, 2015, 175(8): 1399-1405. |
| 20 | OLSSON A G, ANGELIN B, ASSMANN G, et al. Can LDL cholesterol be too low? Possible risks of extremely low levels[J]. J Intern Med, 2017, 281(6): 534-553. |
| 21 | ISO H, JACOBS D R Jr, WENTWORTH D, et al. Serum cholesterol levels and six-year mortality from stroke in 350 977 men screened for the multiple risk factor intervention trial[J]. N Engl J Med, 1989, 320(14): 904-910. |
| 22 | WHITE P J, MCGARRAH R W, HERMAN M A, et al. Insulin action, type 2 diabetes, and branched-chain amino acids: a two-way street[J]. Mol Metab, 2021, 52: 101261. |
| 23 | SHIDA Y, ENDO H, OWADA S, et al. Branched-chain amino acids govern the high learning ability phenotype in Tokai high avoider (THA) rats[J]. Sci Rep, 2021, 11(1): 23104. |
| 24 | COLE J T, MITALA C M, KUNDU S, et al. Dietary branched chain amino acids ameliorate injury-induced cognitive impairment[J]. Proc Natl Acad Sci U S A, 2010, 107(1): 366-371. |
| 25 | SIDDIK M A B, MULLINS C A, KRAMER A, et al. Branched-chain amino acids are linked with Alzheimer's disease-related pathology and cognitive deficits[J]. Cells, 2022, 11(21): 3523. |
| 26 | EUSER S M, SATTAR N, WITTEMAN J C M, et al. A prospective analysis of elevated fasting glucose levels and cognitive function in older people: results from PROSPER and the Rotterdam Study[J]. Diabetes, 2010, 59(7): 1601-1607. |
| 27 | GANGULI M, BEER J C, ZMUDA J M, et al. Aging, diabetes, obesity, and cognitive decline: a population-based study[J]. J Am Geriatr Soc, 2020, 68(5): 991-998. |
| 28 | NAGAI N, ITO Y, SASAKI H. Hyperglycemia enhances the production of amyloid β1-42 in the lenses of Otsuka Long-Evans Tokushima Fatty rats, a model of human type 2 diabetes[J]. Invest Ophthalmol Vis Sci, 2016, 57(3): 1408-1417. |
| 29 | YANG Y, WU Y L, ZHANG S T, et al. High glucose promotes Aβ production by inhibiting APP degradation[J]. PLoS One, 2013, 8(7): e69824. |
| 30 | EXALTO L G, van der FLIER W M, SCHELTENS P, et al. Glycemia and levels of cerebrospinal fluid amyloid and tau in patients attending a memory clinic[J]. J Am Geriatr Soc, 2010, 58(7): 1318-1321. |
| 31 | LU Y H, JIANG X J, LIU S L, et al. Changes in cerebrospinal fluid tau and β-amyloid levels in diabetic and prediabetic patients: a meta-analysis[J]. Front Aging Neurosci, 2018, 10: 271. |
| 32 | ARNOLD S E, ARVANITAKIS Z, MACAULEY-RAMBACH S L, et al. Brain insulin resistance in type 2 diabetes and Alzheimer disease: concepts and conundrums[J]. Nat Rev Neurol, 2018, 14(3): 168-181. |
| 33 | BUTTERFIELD D A, HALLIWELL B. Oxidative stress, dysfunctional glucose metabolism and Alzheimer disease[J]. Nat Rev Neurosci, 2019, 20(3): 148-160. |
| 34 | NGUYEN T T, TA Q T H, NGUYEN T K O, et al. Type 3 diabetes and its role implications in Alzheimer's disease[J]. Int J Mol Sci, 2020, 21(9): 3165. |
| [1] | Amuti Abulikemu, Li Youran, Yang Chendie, GuanPoh Tay, Feng Shuo, Zhang Ruiyan, Wang Xiaoqun. Impact of apolipoprotein B control on coronary atherosclerotic plaque progression: a cohort study using intravascular ultrasound [J]. Journal of Shanghai Jiao Tong University (Medical Science), 2026, 46(3): 312-321. |
| [2] | Wu Kexin, Lu Jia, Wu Xingyu, Yu Zhihua. Role of microglial TRPV1 in apolipoprotein E4-associated Parkinson's disease [J]. Journal of Shanghai Jiao Tong University (Medical Science), 2026, 46(2): 163-171. |
| [3] | HUANG Xin, LIU Jiahui, YE Jingwen, QIAN Wenli, XU Wanxing, WANG Lin. Development and clinical application of a machine learning-driven model for metabolite-based diagnosis of small cell lung cancer [J]. Journal of Shanghai Jiao Tong University (Medical Science), 2025, 45(8): 1009-1016. |
| [4] | GU Liangrui, YAN Bicong, FANG Tonglei, WU Jinliang. Correlation between brain imaging features and cognitive impairment in end-stage renal disease patients based on susceptibility-weighted imaging [J]. Journal of Shanghai Jiao Tong University (Medical Science), 2025, 45(6): 760-765. |
| [5] | CAO Mingming, WANG Hui, YIN Yafu. Current research status of imaging markers for cognitive impairment in Parkinson′s disease [J]. Journal of Shanghai Jiao Tong University (Medical Science), 2025, 45(5): 646-652. |
| [6] | XU Wanxing, WANG Lin, GUO Qiaomei, WANG Xueqing, LOU Jiatao. Clinical validation and application value exploration of multi-modal pulmonary nodule diagnosis model [J]. Journal of Shanghai Jiao Tong University (Medical Science), 2024, 44(8): 1030-1036. |
| [7] | LI Yu, ZHANG Yu. Analysis of risk factors of adverse pregnancy outcomes in patients with chronic kidney disease [J]. Journal of Shanghai Jiao Tong University (Medical Science), 2024, 44(5): 560-566. |
| [8] | LI Ping, JIANG Huiru, YE Mengyue, WANG Yayu, CHEN Xiaoyu, YUAN Ancai, XU Wenjie, DAI Huimin, CHEN Xi, YAN Xiaoxiang, TU Shengxian, ZHENG Yuanqi, ZHANG Wei, PU Jun. Analysis of epidemiological characteristics of risk factors for cardiovascular diseases and malignant tumors based on the Shanghai community elderly cohort [J]. Journal of Shanghai Jiao Tong University (Medical Science), 2024, 44(5): 617-625. |
| [9] | DU Yage, LU Yanhui, AN Yu, SONG Ying, ZHENG Jie. Research progress in mechanisms of gut microbiota in diabetic cognitive impairment and its targeted intervention [J]. Journal of Shanghai Jiao Tong University (Medical Science), 2024, 44(4): 494-500. |
| [10] | WU Qian, LI Huating. Progress of olfactory changes in metabolic diseases and the mechanisms [J]. Journal of Shanghai Jiao Tong University (Medical Science), 2024, 44(1): 131-136. |
| [11] | JIANG Xinting, HUANG Gaozhong. Research progress in the effect of nutritional intervention on cognitive impairment related to Alzheimer's disease [J]. Journal of Shanghai Jiao Tong University (Medical Science), 2023, 43(6): 788-794. |
| [12] | SHEN Li, HUANG Hengye, YU Guangjun. Current status of neurodevelopmental outcomes and its influencing factors of early-to-moderate preterm infants at corrected age of 18 months [J]. Journal of Shanghai Jiao Tong University (Medical Science), 2023, 43(4): 445-452. |
| [13] | JIANG Jing, BIAN Yong, ZHENG Jijian, HUANG Yue. Factors influencing the amount of blood loss in pediatric patients during craniosynostosis surgery [J]. Journal of Shanghai Jiao Tong University (Medical Science), 2023, 43(4): 453-458. |
| [14] | YI Xiaoxuan, HU Senlin, SUN Yang, HUANG Qingxia, TANG Huiru. Quantitative characteristics of serum lipoprotein phenotypes for HBV patients [J]. Journal of Shanghai Jiao Tong University (Medical Science), 2023, 43(2): 143-151. |
| [15] | XUE Linlin, LI Binghan, CHANG Lixian, LI Weikun, LIU Chunyun, LIU Li. Construction and evaluation of a nomogram prediction model for bacterial infection in patients with decompensated hepatitis C cirrhosis [J]. Journal of Shanghai Jiao Tong University (Medical Science), 2023, 43(1): 52-60. |
| Viewed | ||||||
|
Full text |
|
|||||
|
Abstract |
|
|||||