Journal of Shanghai Jiao Tong University (Medical Science) ›› 2022, Vol. 42 ›› Issue (8): 1070-1080.doi: 10.3969/j.issn.1674-8115.2022.08.012
• Clinical research • Previous Articles Next Articles
QIU Jiahui1,2( ), CAI Qianqian2, YANG Yan2, CHENG Feichi2, QIU Zhengjun1,2(), HUANG Chen1,2()
Received:2022-03-11
Accepted:2022-07-21
Online:2022-08-28
Published:2022-10-08
Contact:
QIU Zhengjun,HUANG Chen
E-mail:1326880749@qq.com;qiuzjdoctor@sina.com;richard-hc@hotmail.com
Supported by:CLC Number:
QIU Jiahui, CAI Qianqian, YANG Yan, CHENG Feichi, QIU Zhengjun, HUANG Chen. Value of combined perineural lymphovascular invasion and tumor-stroma ratio in guiding the prognosis of colorecatal cancer[J]. Journal of Shanghai Jiao Tong University (Medical Science), 2022, 42(8): 1070-1080.
Add to citation manager EndNote|Ris|BibTeX
URL: https://xuebao.shsmu.edu.cn/EN/10.3969/j.issn.1674-8115.2022.08.012
| Indicator | Univariate analysis | Multivariate analysis | |||||
|---|---|---|---|---|---|---|---|
| HR | 95%CI | P value | HR | 95%CI | P value | ||
| Grade | |||||||
| Well | ‒ | 1 | ‒ | ||||
| Moderate | 2.333 | 0.945‒5.759 | 0.660 | ||||
| Poor | 3.824 | 1.451‒10.079 | 0.007* | ||||
| T Stage | |||||||
| T1 | ‒ | 1 | ‒ | ||||
| T2 | 1.897 | 0.240‒14.981 | 0.544 | ||||
| T3 | 2.201 | 0.291‒16.676 | 0.445 | ||||
| T4 | 6.070 | 0.845‒43.588 | 0.073 | ||||
| N Stage | |||||||
| N0 | ‒ | 1 | ‒ | ‒ | 1 | ‒ | |
| N1 | 2.364 | 1.477‒3.784 | 0.000** | 1.742 | 1.065‒2.850 | 0.027* | |
| N2 | 5.832 | 3.725‒9.130 | 0.000** | 5.022 | 3.103‒8.128 | 0.000** | |
| Tumor location | |||||||
| Right | ‒ | 1 | ‒ | ‒ | 1 | ‒ | |
| Left | 0.461 | 0.281‒0.757 | 0.002* | 0.438 | 0.265‒0.723 | 0.001* | |
| Rectal | 0.472 | 0.307‒0.725 | 0.001* | 0.472 | 0.304‒0.735 | 0.001* | |
| Gender | |||||||
| Male | ‒ | 1 | ‒ | ‒ | 1 | ‒ | |
| Female | 0.602 | 0.402‒0.902 | 0.014* | 0.569 | 0.377‒0.858 | 0.007* | |
| Tumor size | |||||||
| <5 cm | ‒ | 1 | ‒ | ||||
| ≥5 cm | 1.294 | 0.887‒1.888 | 0.182 | ||||
| Age | |||||||
| ≤67 years | ‒ | 1 | ‒ | ‒ | 1 | ‒ | |
| >67 years | 3.315 | 2.188‒5.022 | 0.000** | 3.426 | 2.245‒5.227 | 0.000** | |
| Risk factor | |||||||
| 0 | ‒ | 1 | ‒ | ‒ | 1 | ‒ | |
| 1 | 2.122 | 1.156‒3.893 | 0.015* | 2.037 | 1.105‒3.755 | 0.023* | |
| 2 | 3.742 | 2.013‒6.957 | 0.000** | 2.604 | 1.372‒4.942 | 0.003* | |
| 3 | 6.074 | 3.065‒12.037 | 0.000** | 3.564 | 1.732‒7.336 | 0.001* | |
Tab 1 Univariate and multivariate COX analysis of influencing factors for overall survival of CRC
| Indicator | Univariate analysis | Multivariate analysis | |||||
|---|---|---|---|---|---|---|---|
| HR | 95%CI | P value | HR | 95%CI | P value | ||
| Grade | |||||||
| Well | ‒ | 1 | ‒ | ||||
| Moderate | 2.333 | 0.945‒5.759 | 0.660 | ||||
| Poor | 3.824 | 1.451‒10.079 | 0.007* | ||||
| T Stage | |||||||
| T1 | ‒ | 1 | ‒ | ||||
| T2 | 1.897 | 0.240‒14.981 | 0.544 | ||||
| T3 | 2.201 | 0.291‒16.676 | 0.445 | ||||
| T4 | 6.070 | 0.845‒43.588 | 0.073 | ||||
| N Stage | |||||||
| N0 | ‒ | 1 | ‒ | ‒ | 1 | ‒ | |
| N1 | 2.364 | 1.477‒3.784 | 0.000** | 1.742 | 1.065‒2.850 | 0.027* | |
| N2 | 5.832 | 3.725‒9.130 | 0.000** | 5.022 | 3.103‒8.128 | 0.000** | |
| Tumor location | |||||||
| Right | ‒ | 1 | ‒ | ‒ | 1 | ‒ | |
| Left | 0.461 | 0.281‒0.757 | 0.002* | 0.438 | 0.265‒0.723 | 0.001* | |
| Rectal | 0.472 | 0.307‒0.725 | 0.001* | 0.472 | 0.304‒0.735 | 0.001* | |
| Gender | |||||||
| Male | ‒ | 1 | ‒ | ‒ | 1 | ‒ | |
| Female | 0.602 | 0.402‒0.902 | 0.014* | 0.569 | 0.377‒0.858 | 0.007* | |
| Tumor size | |||||||
| <5 cm | ‒ | 1 | ‒ | ||||
| ≥5 cm | 1.294 | 0.887‒1.888 | 0.182 | ||||
| Age | |||||||
| ≤67 years | ‒ | 1 | ‒ | ‒ | 1 | ‒ | |
| >67 years | 3.315 | 2.188‒5.022 | 0.000** | 3.426 | 2.245‒5.227 | 0.000** | |
| Risk factor | |||||||
| 0 | ‒ | 1 | ‒ | ‒ | 1 | ‒ | |
| 1 | 2.122 | 1.156‒3.893 | 0.015* | 2.037 | 1.105‒3.755 | 0.023* | |
| 2 | 3.742 | 2.013‒6.957 | 0.000** | 2.604 | 1.372‒4.942 | 0.003* | |
| 3 | 6.074 | 3.065‒12.037 | 0.000** | 3.564 | 1.732‒7.336 | 0.001* | |
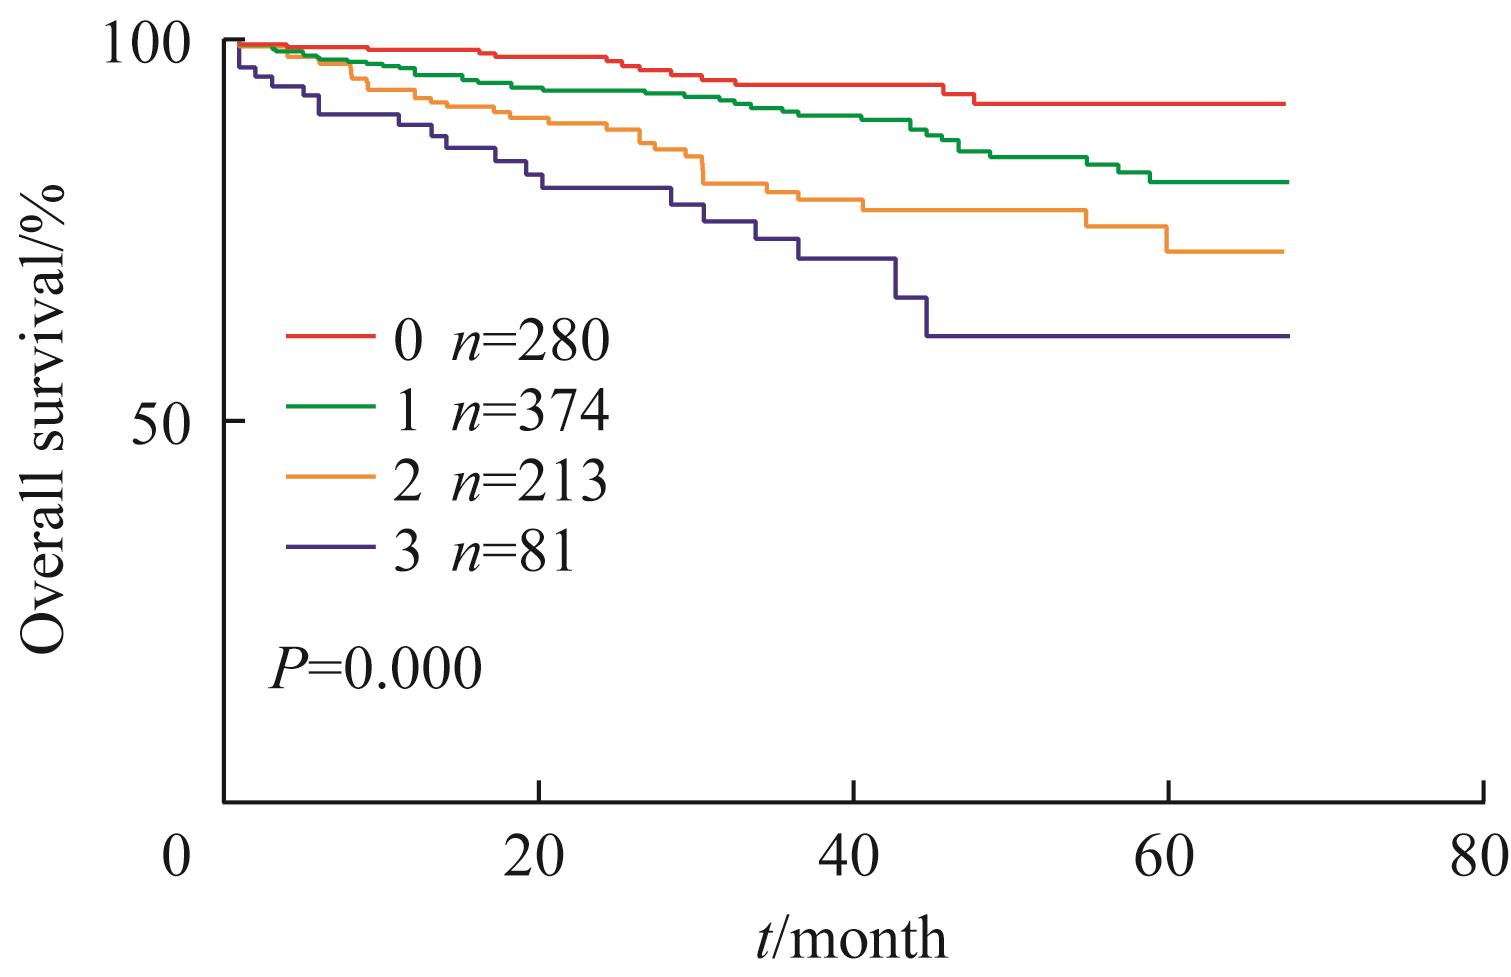
Fig 1 Kaplan-Meier survival analysis for CRC
| Indicator | Group | P value | |
|---|---|---|---|
| Low-risk | High-risk | ||
| Gradea | 0.038* | ||
| Well | 80 (8.4) | 2 (0.2) | |
| Moderate | 667 (70.4) | 62 (6.5) | |
| Poor | 120 (12.7) | 17 (1.8) | |
| TNM Stagea | 0.000** | ||
| Ⅰ | 157 (16.6) | 3 (0.3) | |
| Ⅱ | 406 (42.8) | 15 (1.6) | |
| Ⅲ | 298 (31.4) | 61 (6.4) | |
| Ⅳ | 6 (0.7) | 2 (0.2) | |
| T Stagea | 0.014* | ||
| T1 | 36 (3.8) | 2 (0.2) | |
| T2 | 144 (15.2) | 4 (0.4) | |
| T3 | 187 (19.7) | 15 (1.6) | |
| T4 | 500 (52.7) | 60 (6.4) | |
| N Stagea | 0.000** | ||
| N0 | 564 (59.5) | 19 (2.0) | |
| N1 | 187 (19.7) | 34 (3.6) | |
| N2 | 116 (12.2) | 28 (3.0) | |
| Tumor location | 0.729 | ||
| Right | 283 (29.9) | 25 (2.6) | |
| Left | 232 (24.5) | 25 (2.6) | |
| Rectal | 352 (37.1) | 31 (3.3) | |
| Gendera | 0.009* | ||
| Male | 490 (51.7) | 58 (6.1) | |
| Female | 377 (39.8) | 23 (2.4) | |
| Tumor sizea | 0.888 | ||
| <5 cm | 539 (56.9) | 51 (5.4) | |
| ≥5 cm | 328 (34.6) | 30 (3.1) | |
| Agea | 66.0 (58.0‒74.0) | 65.0 (54.5‒75.5) | 0.538 |
| CEAb | 0.051 | ||
| Normal | 432 (58.5) | 35 (4.7) | |
| Abnormal | 240 (32.5) | 32 (4.3) | |
| CA199c | 0.001** | ||
| Normal | 540 (71.9) | 42 (5.6) | |
| Abnormal | 143 (19.0) | 26 (3.5) | |
| CA50d | 0.765 | ||
| Normal | 318 (83.2) | 30 (7.9) | |
| Abnormal | 30 (7.9) | 4 (1.0) | |
| CA125e | 0.398 | ||
| Normal | 334 (83.5) | 28 (7.0) | |
| Abnormal | 33 (8.3) | 5 (1.2) | |
| CA724f | 0.960 | ||
| Normal | 563 (77.4) | 57 (7.8) | |
| Abnormal | 97 (13.3) | 10 (1.5) | |
| KRASg | 0.433 | ||
| Wild type | 186 (51.2) | 27 (7.4) | |
| Mutant type | 135 (37.2) | 15 (4.2) | |
| NRASh | 0.604 | ||
| Wild type | 315 (86.3) | 42 (11.5) | |
| Mutant type | 8 (2.2) | 0 (0) | |
| BRAFi | 1.000 | ||
| Wild type | 235 (86.1) | 27 (9.9) | |
| Mutant type | 10 (3.7) | 1 (0.3) | |
| MMRj | 0.510 | ||
| pMMR | 381 (65.8) | 39 (6.7) | |
| dMMR | 147 (25.4) | 12 (2.1) | |
Tab 2 Correlation analysis of clinicopathological factors between high-risk and low-risk patients [n(%)]
| Indicator | Group | P value | |
|---|---|---|---|
| Low-risk | High-risk | ||
| Gradea | 0.038* | ||
| Well | 80 (8.4) | 2 (0.2) | |
| Moderate | 667 (70.4) | 62 (6.5) | |
| Poor | 120 (12.7) | 17 (1.8) | |
| TNM Stagea | 0.000** | ||
| Ⅰ | 157 (16.6) | 3 (0.3) | |
| Ⅱ | 406 (42.8) | 15 (1.6) | |
| Ⅲ | 298 (31.4) | 61 (6.4) | |
| Ⅳ | 6 (0.7) | 2 (0.2) | |
| T Stagea | 0.014* | ||
| T1 | 36 (3.8) | 2 (0.2) | |
| T2 | 144 (15.2) | 4 (0.4) | |
| T3 | 187 (19.7) | 15 (1.6) | |
| T4 | 500 (52.7) | 60 (6.4) | |
| N Stagea | 0.000** | ||
| N0 | 564 (59.5) | 19 (2.0) | |
| N1 | 187 (19.7) | 34 (3.6) | |
| N2 | 116 (12.2) | 28 (3.0) | |
| Tumor location | 0.729 | ||
| Right | 283 (29.9) | 25 (2.6) | |
| Left | 232 (24.5) | 25 (2.6) | |
| Rectal | 352 (37.1) | 31 (3.3) | |
| Gendera | 0.009* | ||
| Male | 490 (51.7) | 58 (6.1) | |
| Female | 377 (39.8) | 23 (2.4) | |
| Tumor sizea | 0.888 | ||
| <5 cm | 539 (56.9) | 51 (5.4) | |
| ≥5 cm | 328 (34.6) | 30 (3.1) | |
| Agea | 66.0 (58.0‒74.0) | 65.0 (54.5‒75.5) | 0.538 |
| CEAb | 0.051 | ||
| Normal | 432 (58.5) | 35 (4.7) | |
| Abnormal | 240 (32.5) | 32 (4.3) | |
| CA199c | 0.001** | ||
| Normal | 540 (71.9) | 42 (5.6) | |
| Abnormal | 143 (19.0) | 26 (3.5) | |
| CA50d | 0.765 | ||
| Normal | 318 (83.2) | 30 (7.9) | |
| Abnormal | 30 (7.9) | 4 (1.0) | |
| CA125e | 0.398 | ||
| Normal | 334 (83.5) | 28 (7.0) | |
| Abnormal | 33 (8.3) | 5 (1.2) | |
| CA724f | 0.960 | ||
| Normal | 563 (77.4) | 57 (7.8) | |
| Abnormal | 97 (13.3) | 10 (1.5) | |
| KRASg | 0.433 | ||
| Wild type | 186 (51.2) | 27 (7.4) | |
| Mutant type | 135 (37.2) | 15 (4.2) | |
| NRASh | 0.604 | ||
| Wild type | 315 (86.3) | 42 (11.5) | |
| Mutant type | 8 (2.2) | 0 (0) | |
| BRAFi | 1.000 | ||
| Wild type | 235 (86.1) | 27 (9.9) | |
| Mutant type | 10 (3.7) | 1 (0.3) | |
| MMRj | 0.510 | ||
| pMMR | 381 (65.8) | 39 (6.7) | |
| dMMR | 147 (25.4) | 12 (2.1) | |
| Indicator | Univariate analysis | Multivariate analysis | |||||
|---|---|---|---|---|---|---|---|
| HR | 95%CI | P value | HR | 95%CI | P value | ||
| Grade | |||||||
| Well | ‒ | 1 | ‒ | ||||
| Moderate | 2.333 | 0.945‒5.759 | 0.660 | ||||
| Poor | 3.824 | 1.451‒10.079 | 0.007 | ||||
| T Stage | |||||||
| T1 | ‒ | 1 | ‒ | ||||
| T2 | 1.897 | 0.240‒14.981 | 0.544 | ||||
| T3 | 2.201 | 0.291‒16.676 | 0.445 | ||||
| T4 | 6.070 | 0.845‒43.588 | 0.073 | ||||
| N Stage | |||||||
| N0 | ‒ | 1 | ‒ | ‒ | 1 | ‒ | |
| N1 | 2.364 | 1.477‒3.784 | 0.000** | 1.971 | 1.211‒3.209 | 0.006* | |
| N2 | 5.832 | 3.725‒9.130 | 0.000** | 5.648 | 3.510‒9.087 | 0.000** | |
| Tumor location | |||||||
| Right | ‒ | 1 | ‒ | ‒ | 1 | ‒ | |
| Left | 0.461 | 0.281‒0.757 | 0.002* | 0.483 | 0.291‒0.803 | 0.005* | |
| Rectal | 0.472 | 0.307‒0.725 | 0.001* | 0.574 | 0.363‒0.906 | 0.017* | |
| Gender | |||||||
| Male | ‒ | 1 | ‒ | ‒ | 1 | ‒ | |
| Female | 0.602 | 0.402‒0.902 | 0.014* | 0.617 | 0.406‒0.937 | 0.023* | |
| Tumor size | |||||||
| <5 cm | ‒ | 1 | ‒ | ||||
| ≥5 cm | 1.294 | 0.887‒1.888 | 0.182 | ||||
| Age | |||||||
| ≤67 years | ‒ | 1 | ‒ | ‒ | 1 | ‒ | |
| >67 years | 3.315 | 2.188‒5.022 | 0.000** | 3.354 | 2.183‒5.152 | 0.000** | |
| Risk group | |||||||
| Low | ‒ | 1 | ‒ | ‒ | 1 | ‒ | |
| High | 2.876 | 1.769‒4.676 | 0.000** | 2.078 | 1.236‒3.496 | 0.006* | |
| CEA | |||||||
| Normal | ‒ | 1 | ‒ | ‒ | 1 | ‒ | |
| Abnormal | 2.463 | 1.561‒3.887 | 0.000** | 1.729 | 1.045‒2.859 | 0.033* | |
| CA199 | |||||||
| Normal | ‒ | 1 | ‒ | ‒ | 1 | ‒ | |
| Abnormal | 1.719 | 1.053‒2.806 | 0.030* | 0.701 | 0.385‒1.275 | 0.244 | |
| CA50 | |||||||
| Normal | ‒ | 1 | ‒ | ‒ | 1 | ‒ | |
| Abnormal | 2.478 | 1.095‒5.607 | 0.029* | 1.975 | 0.772‒5.050 | 0.155 | |
| CA125 | |||||||
| Normal | ‒ | 1 | ‒ | ‒ | 1 | ‒ | |
| Abnormal | 2.690 | 1.293‒5.598 | 0.008* | 1.752 | 0.815‒3.766 | 0.151 | |
| CA724 | |||||||
| Normal | ‒ | 1 | ‒ | ||||
| Abnormal | 1.044 | 0.548‒1.989 | 0.897 | ||||
| KRAS | |||||||
| Wild type | ‒ | 1 | ‒ | ‒ | 1 | ‒ | |
| Mutant type | 2.818 | 1.559‒5.092 | 0.001* | 2.048 | 1.108‒3.786 | 0.022* | |
| NRAS | |||||||
| Wild type | ‒ | 1 | ‒ | ||||
| Mutant type | 2.009 | 0.487‒8.283 | 0.334 | ||||
| BRAF | |||||||
| Wild type | ‒ | 1 | ‒ | ||||
| Mutant type | 2.242 | 0.534‒9.412 | 0.270 | ||||
| MMR | |||||||
| pMMR | ‒ | 1 | ‒ | ||||
| dMMR | 1.343 | 0.767‒2.351 | 0.301 | ||||
Tab 3 Univariate and multivariate COX analysis of influencing factors for overall survival of CRC (Unmatched queue of SGH)
| Indicator | Univariate analysis | Multivariate analysis | |||||
|---|---|---|---|---|---|---|---|
| HR | 95%CI | P value | HR | 95%CI | P value | ||
| Grade | |||||||
| Well | ‒ | 1 | ‒ | ||||
| Moderate | 2.333 | 0.945‒5.759 | 0.660 | ||||
| Poor | 3.824 | 1.451‒10.079 | 0.007 | ||||
| T Stage | |||||||
| T1 | ‒ | 1 | ‒ | ||||
| T2 | 1.897 | 0.240‒14.981 | 0.544 | ||||
| T3 | 2.201 | 0.291‒16.676 | 0.445 | ||||
| T4 | 6.070 | 0.845‒43.588 | 0.073 | ||||
| N Stage | |||||||
| N0 | ‒ | 1 | ‒ | ‒ | 1 | ‒ | |
| N1 | 2.364 | 1.477‒3.784 | 0.000** | 1.971 | 1.211‒3.209 | 0.006* | |
| N2 | 5.832 | 3.725‒9.130 | 0.000** | 5.648 | 3.510‒9.087 | 0.000** | |
| Tumor location | |||||||
| Right | ‒ | 1 | ‒ | ‒ | 1 | ‒ | |
| Left | 0.461 | 0.281‒0.757 | 0.002* | 0.483 | 0.291‒0.803 | 0.005* | |
| Rectal | 0.472 | 0.307‒0.725 | 0.001* | 0.574 | 0.363‒0.906 | 0.017* | |
| Gender | |||||||
| Male | ‒ | 1 | ‒ | ‒ | 1 | ‒ | |
| Female | 0.602 | 0.402‒0.902 | 0.014* | 0.617 | 0.406‒0.937 | 0.023* | |
| Tumor size | |||||||
| <5 cm | ‒ | 1 | ‒ | ||||
| ≥5 cm | 1.294 | 0.887‒1.888 | 0.182 | ||||
| Age | |||||||
| ≤67 years | ‒ | 1 | ‒ | ‒ | 1 | ‒ | |
| >67 years | 3.315 | 2.188‒5.022 | 0.000** | 3.354 | 2.183‒5.152 | 0.000** | |
| Risk group | |||||||
| Low | ‒ | 1 | ‒ | ‒ | 1 | ‒ | |
| High | 2.876 | 1.769‒4.676 | 0.000** | 2.078 | 1.236‒3.496 | 0.006* | |
| CEA | |||||||
| Normal | ‒ | 1 | ‒ | ‒ | 1 | ‒ | |
| Abnormal | 2.463 | 1.561‒3.887 | 0.000** | 1.729 | 1.045‒2.859 | 0.033* | |
| CA199 | |||||||
| Normal | ‒ | 1 | ‒ | ‒ | 1 | ‒ | |
| Abnormal | 1.719 | 1.053‒2.806 | 0.030* | 0.701 | 0.385‒1.275 | 0.244 | |
| CA50 | |||||||
| Normal | ‒ | 1 | ‒ | ‒ | 1 | ‒ | |
| Abnormal | 2.478 | 1.095‒5.607 | 0.029* | 1.975 | 0.772‒5.050 | 0.155 | |
| CA125 | |||||||
| Normal | ‒ | 1 | ‒ | ‒ | 1 | ‒ | |
| Abnormal | 2.690 | 1.293‒5.598 | 0.008* | 1.752 | 0.815‒3.766 | 0.151 | |
| CA724 | |||||||
| Normal | ‒ | 1 | ‒ | ||||
| Abnormal | 1.044 | 0.548‒1.989 | 0.897 | ||||
| KRAS | |||||||
| Wild type | ‒ | 1 | ‒ | ‒ | 1 | ‒ | |
| Mutant type | 2.818 | 1.559‒5.092 | 0.001* | 2.048 | 1.108‒3.786 | 0.022* | |
| NRAS | |||||||
| Wild type | ‒ | 1 | ‒ | ||||
| Mutant type | 2.009 | 0.487‒8.283 | 0.334 | ||||
| BRAF | |||||||
| Wild type | ‒ | 1 | ‒ | ||||
| Mutant type | 2.242 | 0.534‒9.412 | 0.270 | ||||
| MMR | |||||||
| pMMR | ‒ | 1 | ‒ | ||||
| dMMR | 1.343 | 0.767‒2.351 | 0.301 | ||||
| Indicator | Univariate analysis | Multivariate analysis | |||||
|---|---|---|---|---|---|---|---|
| HR | 95%CI | P value | HR | 95%CI | P value | ||
| Grade | |||||||
| Well | ‒ | 1 | ‒ | ||||
| Moderate | 7 939.246 | 0‒3.338×1081 | 0.922 | ||||
| Poor | 14 304.201 | 0‒6.019×1081 | 0.916 | ||||
| T Stage | |||||||
| T1 | ‒ | ‒ | ‒ | ||||
| T2 | ‒ | 1 | ‒ | ||||
| T3 | 23 440.882 | 0‒2.765×10167 | 0.958 | ||||
| T4 | 75 016.020 | 0‒8.807×10167 | 0.953 | ||||
| N Stage | |||||||
| N0 | ‒ | 1 | ‒ | ||||
| N1 | 1.474 | 0.453‒4.793 | 0.519 | ||||
| N2 | 2.607 | 0.870‒8.192 | 0.086 | ||||
| Tumor location | |||||||
| Right | ‒ | 1 | ‒ | ||||
| Left | 0.500 | 0.204‒1.227 | 0.130 | ||||
| Rectal | 0.204 | 0.068‒0.615 | 0.005* | ||||
| Gender | |||||||
| Male | ‒ | 1 | ‒ | ‒ | 1 | ‒ | |
| Female | 0.602 | 0.402‒0.902 | 0.014* | 0.428 | 0.147‒1.246 | 0.120 | |
| Tumor size | |||||||
| <5 cm | ‒ | 1 | ‒ | ||||
| ≥5 cm | 1.846 | 0.855‒3.987 | 0.118 | ||||
| Age | |||||||
| ≤67 years | ‒ | 1 | ‒ | ‒ | 1 | ‒ | |
| >67 years | 3.092 | 1.377‒6.944 | 0.006* | 2.890 | 1.286‒6.494 | 0.010* | |
| Risk group | |||||||
| Low | ‒ | 1 | ‒ | ‒ | 1 | ‒ | |
| High | 2.483 | 1.078‒5.720 | 0.033* | 2.380 | 1.030‒5.502 | 0.042* | |
Tab 4 Univariate and multivariate COX analysis of influencing factors for overall survival of CRC (matched queue of SGH)
| Indicator | Univariate analysis | Multivariate analysis | |||||
|---|---|---|---|---|---|---|---|
| HR | 95%CI | P value | HR | 95%CI | P value | ||
| Grade | |||||||
| Well | ‒ | 1 | ‒ | ||||
| Moderate | 7 939.246 | 0‒3.338×1081 | 0.922 | ||||
| Poor | 14 304.201 | 0‒6.019×1081 | 0.916 | ||||
| T Stage | |||||||
| T1 | ‒ | ‒ | ‒ | ||||
| T2 | ‒ | 1 | ‒ | ||||
| T3 | 23 440.882 | 0‒2.765×10167 | 0.958 | ||||
| T4 | 75 016.020 | 0‒8.807×10167 | 0.953 | ||||
| N Stage | |||||||
| N0 | ‒ | 1 | ‒ | ||||
| N1 | 1.474 | 0.453‒4.793 | 0.519 | ||||
| N2 | 2.607 | 0.870‒8.192 | 0.086 | ||||
| Tumor location | |||||||
| Right | ‒ | 1 | ‒ | ||||
| Left | 0.500 | 0.204‒1.227 | 0.130 | ||||
| Rectal | 0.204 | 0.068‒0.615 | 0.005* | ||||
| Gender | |||||||
| Male | ‒ | 1 | ‒ | ‒ | 1 | ‒ | |
| Female | 0.602 | 0.402‒0.902 | 0.014* | 0.428 | 0.147‒1.246 | 0.120 | |
| Tumor size | |||||||
| <5 cm | ‒ | 1 | ‒ | ||||
| ≥5 cm | 1.846 | 0.855‒3.987 | 0.118 | ||||
| Age | |||||||
| ≤67 years | ‒ | 1 | ‒ | ‒ | 1 | ‒ | |
| >67 years | 3.092 | 1.377‒6.944 | 0.006* | 2.890 | 1.286‒6.494 | 0.010* | |
| Risk group | |||||||
| Low | ‒ | 1 | ‒ | ‒ | 1 | ‒ | |
| High | 2.483 | 1.078‒5.720 | 0.033* | 2.380 | 1.030‒5.502 | 0.042* | |
| Indicator | Univariate analysis | Multivariate analysis | |||||
|---|---|---|---|---|---|---|---|
| HR | 95%CI | P value | HR | 95%CI | P value | ||
| Grade | |||||||
| Well | ‒ | 1 | ‒ | ||||
| Moderate | 0.975 | 0.424‒2.239 | 0.952 | ||||
| Poor | 2.183 | 0.813‒5.866 | 0.122 | ||||
| T Stage | |||||||
| T1 | ‒ | 1 | ‒ | ||||
| T2 | 12 594.988 | 0‒2.436×1059 | 0.884 | ||||
| T3 | 8 970.864 | 0‒1.730×1059 | 0.889 | ||||
| T4 | 7 939.965 | 0‒1.532×1059 | 0.890 | ||||
| N Stage | |||||||
| N0 | ‒ | 1 | ‒ | ||||
| N1 | 2.137 | 1.078‒4.237 | 0.030* | ||||
| N2 | 1.379 | 0.626‒3.038 | 0.426 | ||||
| Tumor location | |||||||
| Right | ‒ | 1 | ‒ | ‒ | 1 | ‒ | |
| Left | 0.409 | 0.183‒0.916 | 0.030* | 0.475 | 0.208‒1.085 | 0.077 | |
| Rectal | 0.440 | 0.219‒0.886 | 0.021* | 0.450 | 0.223‒0.906 | 0.025* | |
| Gender | |||||||
| Male | ‒ | 1 | ‒ | ||||
| Female | 0.708 | 0.386‒1.299 | 0.265 | ||||
| Tumor size | |||||||
| <5 cm | ‒ | 1 | ‒ | ||||
| ≥5 cm | 0.990 | 0.542‒1.808 | 0.975 | ||||
| Age | |||||||
| ≤67 years | ‒ | 1 | ‒ | ||||
| >67 years | 1.729 | 0.950‒3.147 | 0.073 | ||||
| Risk group | |||||||
| Low | ‒ | 1 | ‒ | ‒ | 1 | ‒ | |
| High | 2.403 | 1.183‒4.882 | 0.015* | 2.121 | 1.024‒4.392 | 0.043* | |
Tab 5 Univariate and multivariate COX analysis of influencing factors for overall survival of CRC (TMA cohort)
| Indicator | Univariate analysis | Multivariate analysis | |||||
|---|---|---|---|---|---|---|---|
| HR | 95%CI | P value | HR | 95%CI | P value | ||
| Grade | |||||||
| Well | ‒ | 1 | ‒ | ||||
| Moderate | 0.975 | 0.424‒2.239 | 0.952 | ||||
| Poor | 2.183 | 0.813‒5.866 | 0.122 | ||||
| T Stage | |||||||
| T1 | ‒ | 1 | ‒ | ||||
| T2 | 12 594.988 | 0‒2.436×1059 | 0.884 | ||||
| T3 | 8 970.864 | 0‒1.730×1059 | 0.889 | ||||
| T4 | 7 939.965 | 0‒1.532×1059 | 0.890 | ||||
| N Stage | |||||||
| N0 | ‒ | 1 | ‒ | ||||
| N1 | 2.137 | 1.078‒4.237 | 0.030* | ||||
| N2 | 1.379 | 0.626‒3.038 | 0.426 | ||||
| Tumor location | |||||||
| Right | ‒ | 1 | ‒ | ‒ | 1 | ‒ | |
| Left | 0.409 | 0.183‒0.916 | 0.030* | 0.475 | 0.208‒1.085 | 0.077 | |
| Rectal | 0.440 | 0.219‒0.886 | 0.021* | 0.450 | 0.223‒0.906 | 0.025* | |
| Gender | |||||||
| Male | ‒ | 1 | ‒ | ||||
| Female | 0.708 | 0.386‒1.299 | 0.265 | ||||
| Tumor size | |||||||
| <5 cm | ‒ | 1 | ‒ | ||||
| ≥5 cm | 0.990 | 0.542‒1.808 | 0.975 | ||||
| Age | |||||||
| ≤67 years | ‒ | 1 | ‒ | ||||
| >67 years | 1.729 | 0.950‒3.147 | 0.073 | ||||
| Risk group | |||||||
| Low | ‒ | 1 | ‒ | ‒ | 1 | ‒ | |
| High | 2.403 | 1.183‒4.882 | 0.015* | 2.121 | 1.024‒4.392 | 0.043* | |
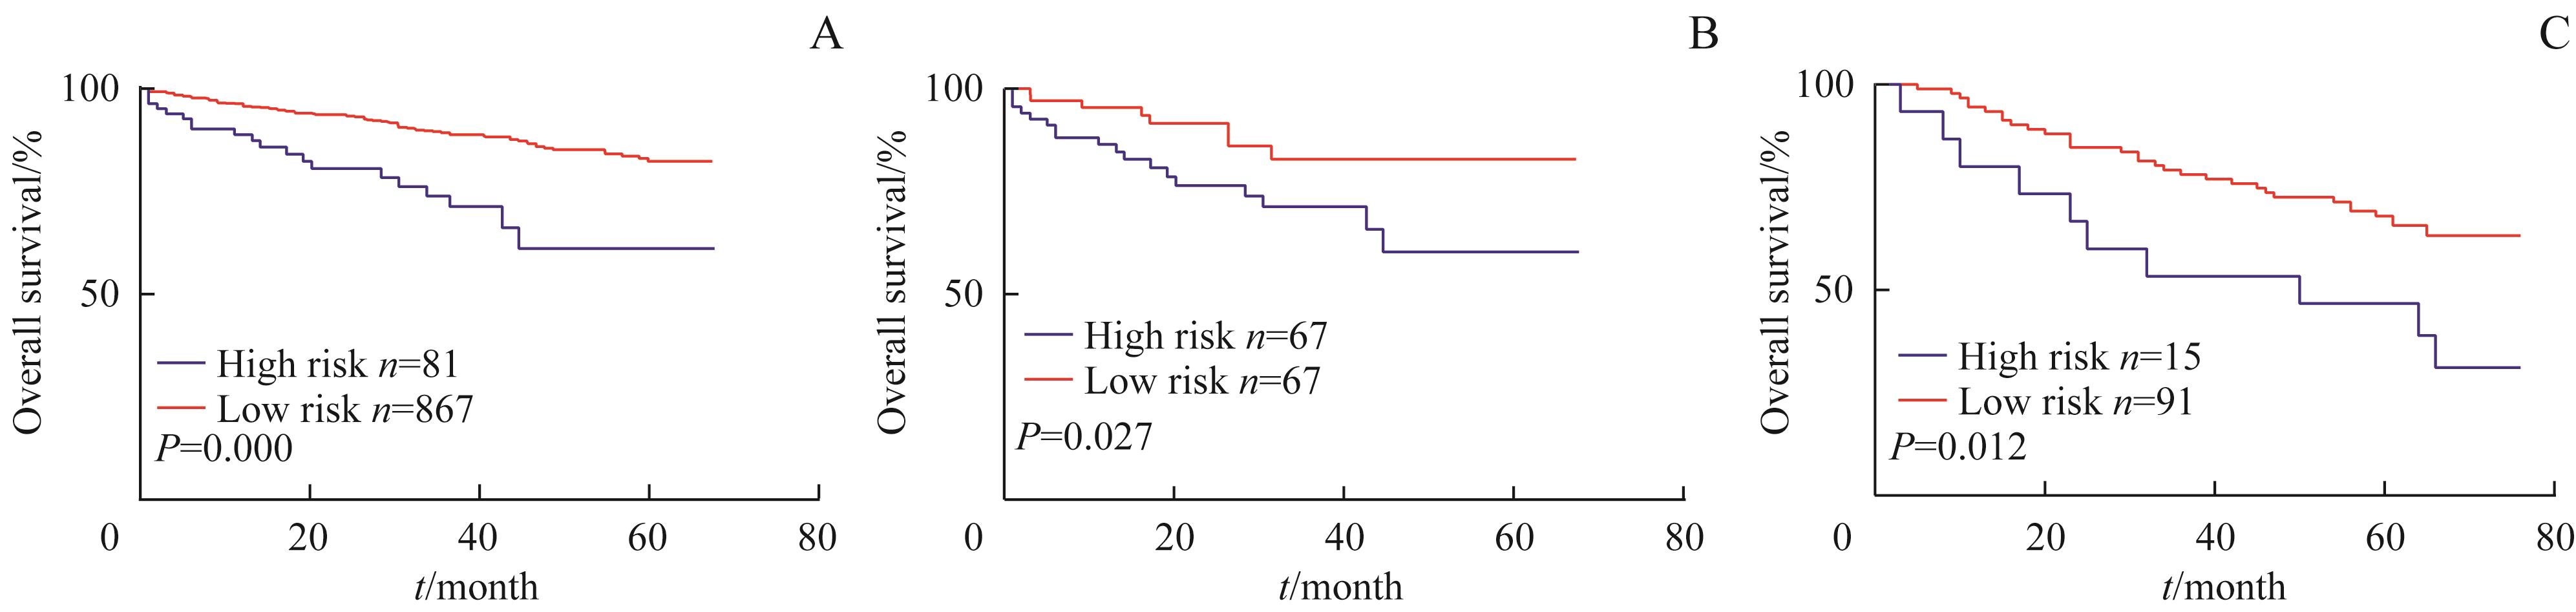
Fig 2 Kaplan-Meier survival analysis for overall survival of high-risk group and low-risk group
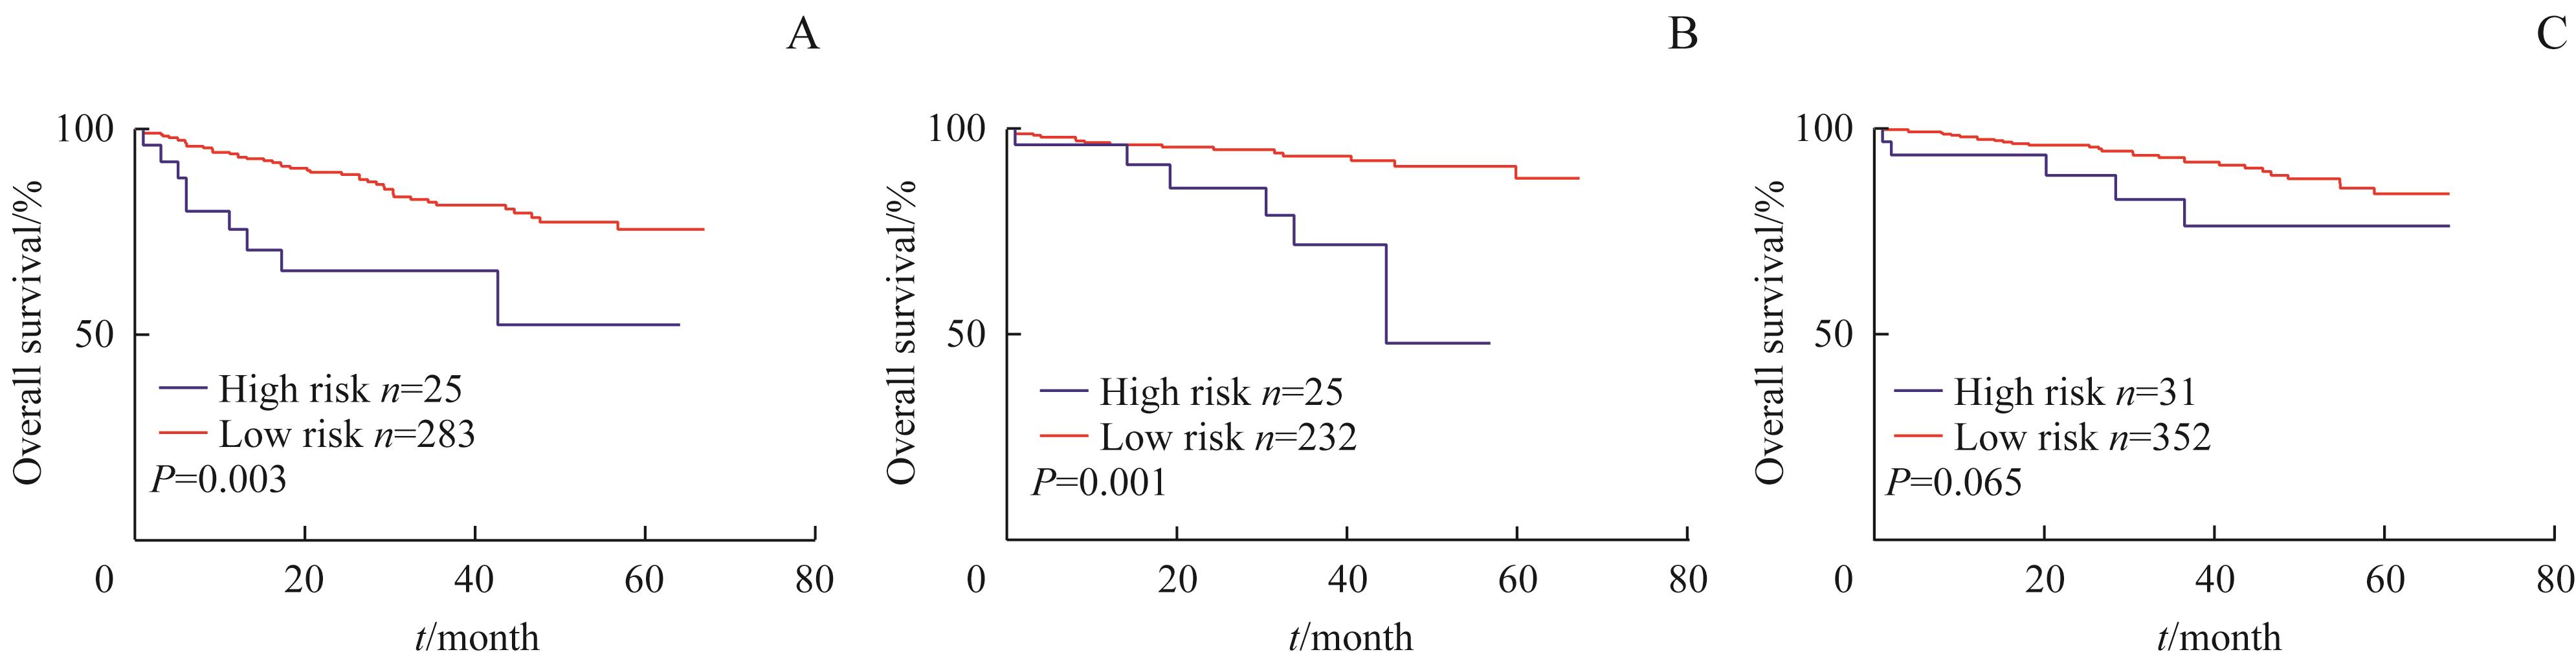
Fig 3 Kaplan-Meier survival analysis curves in tumor site between high risk group and low risk group
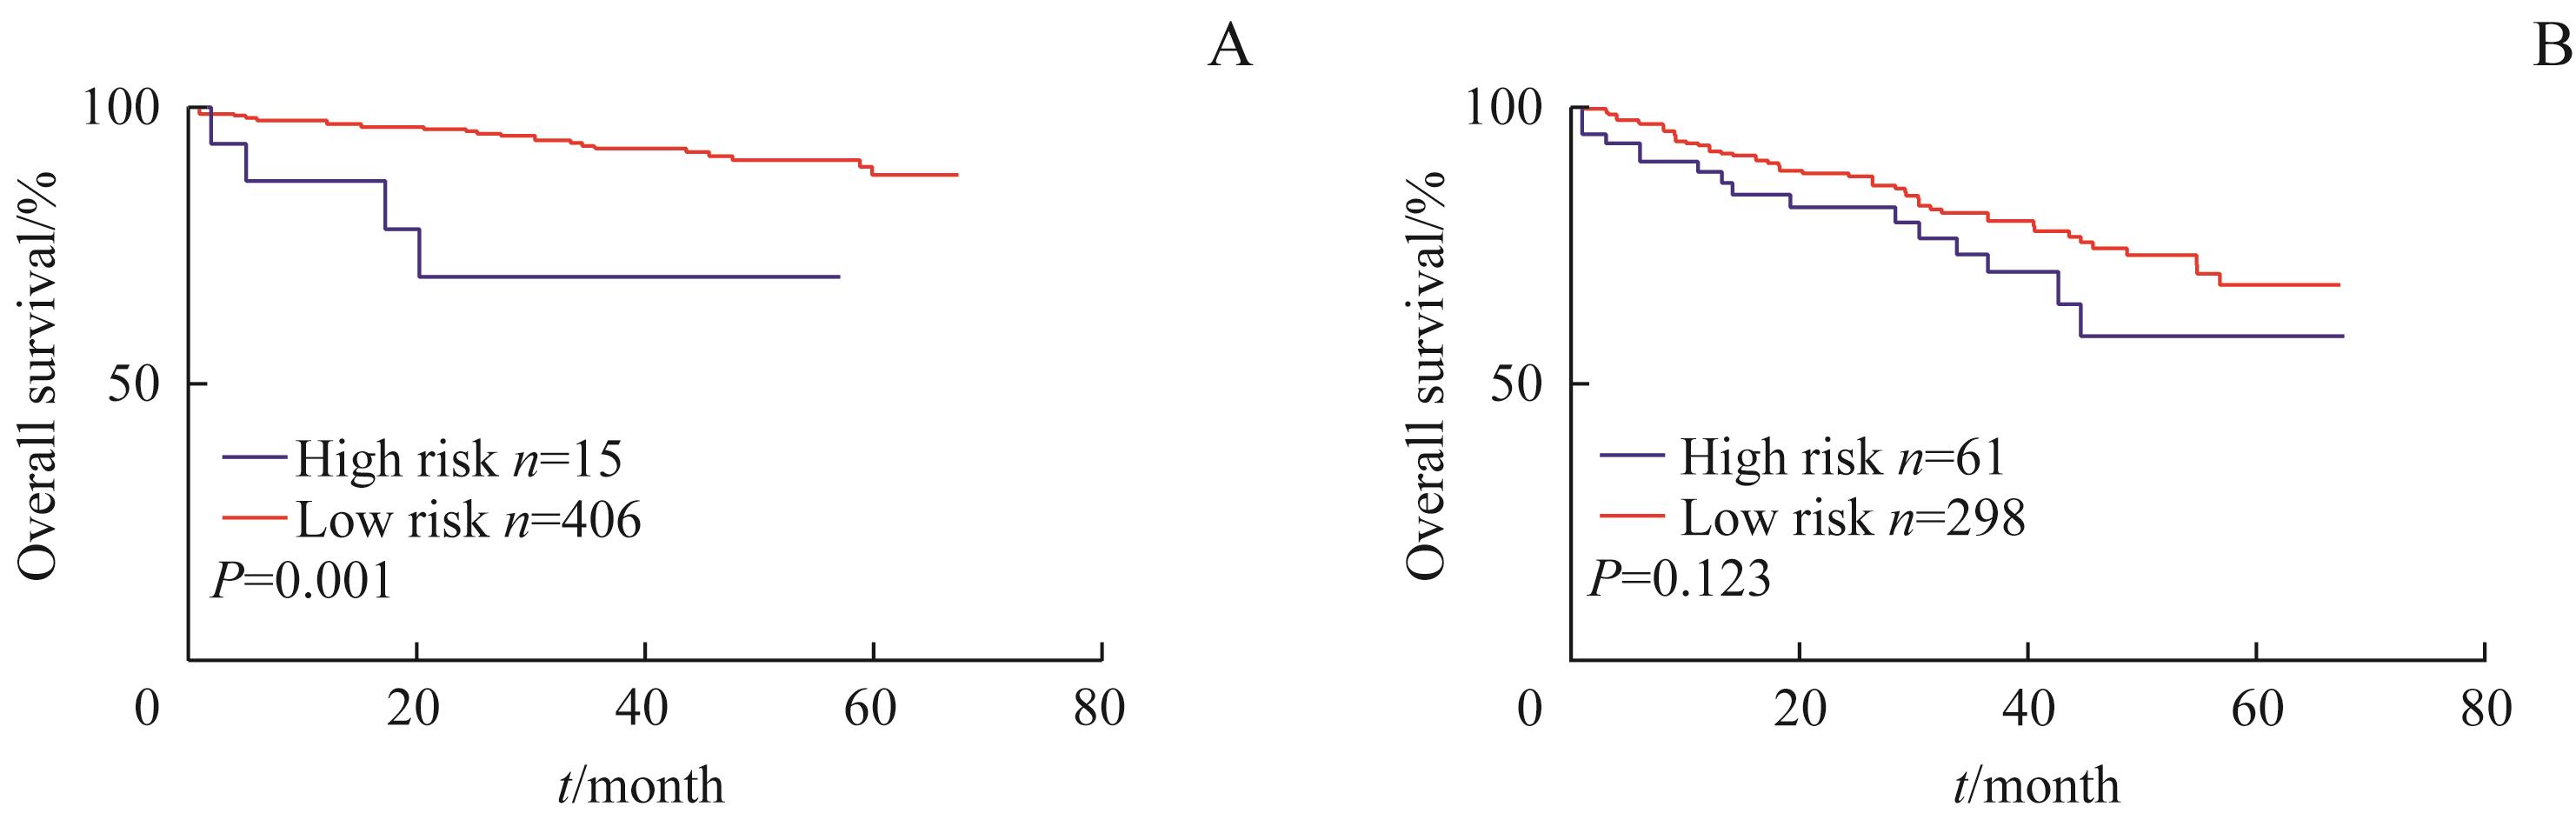
Fig 4 Kaplan-Meier survival analysis curves in TNM stage between high risk group and low risk group
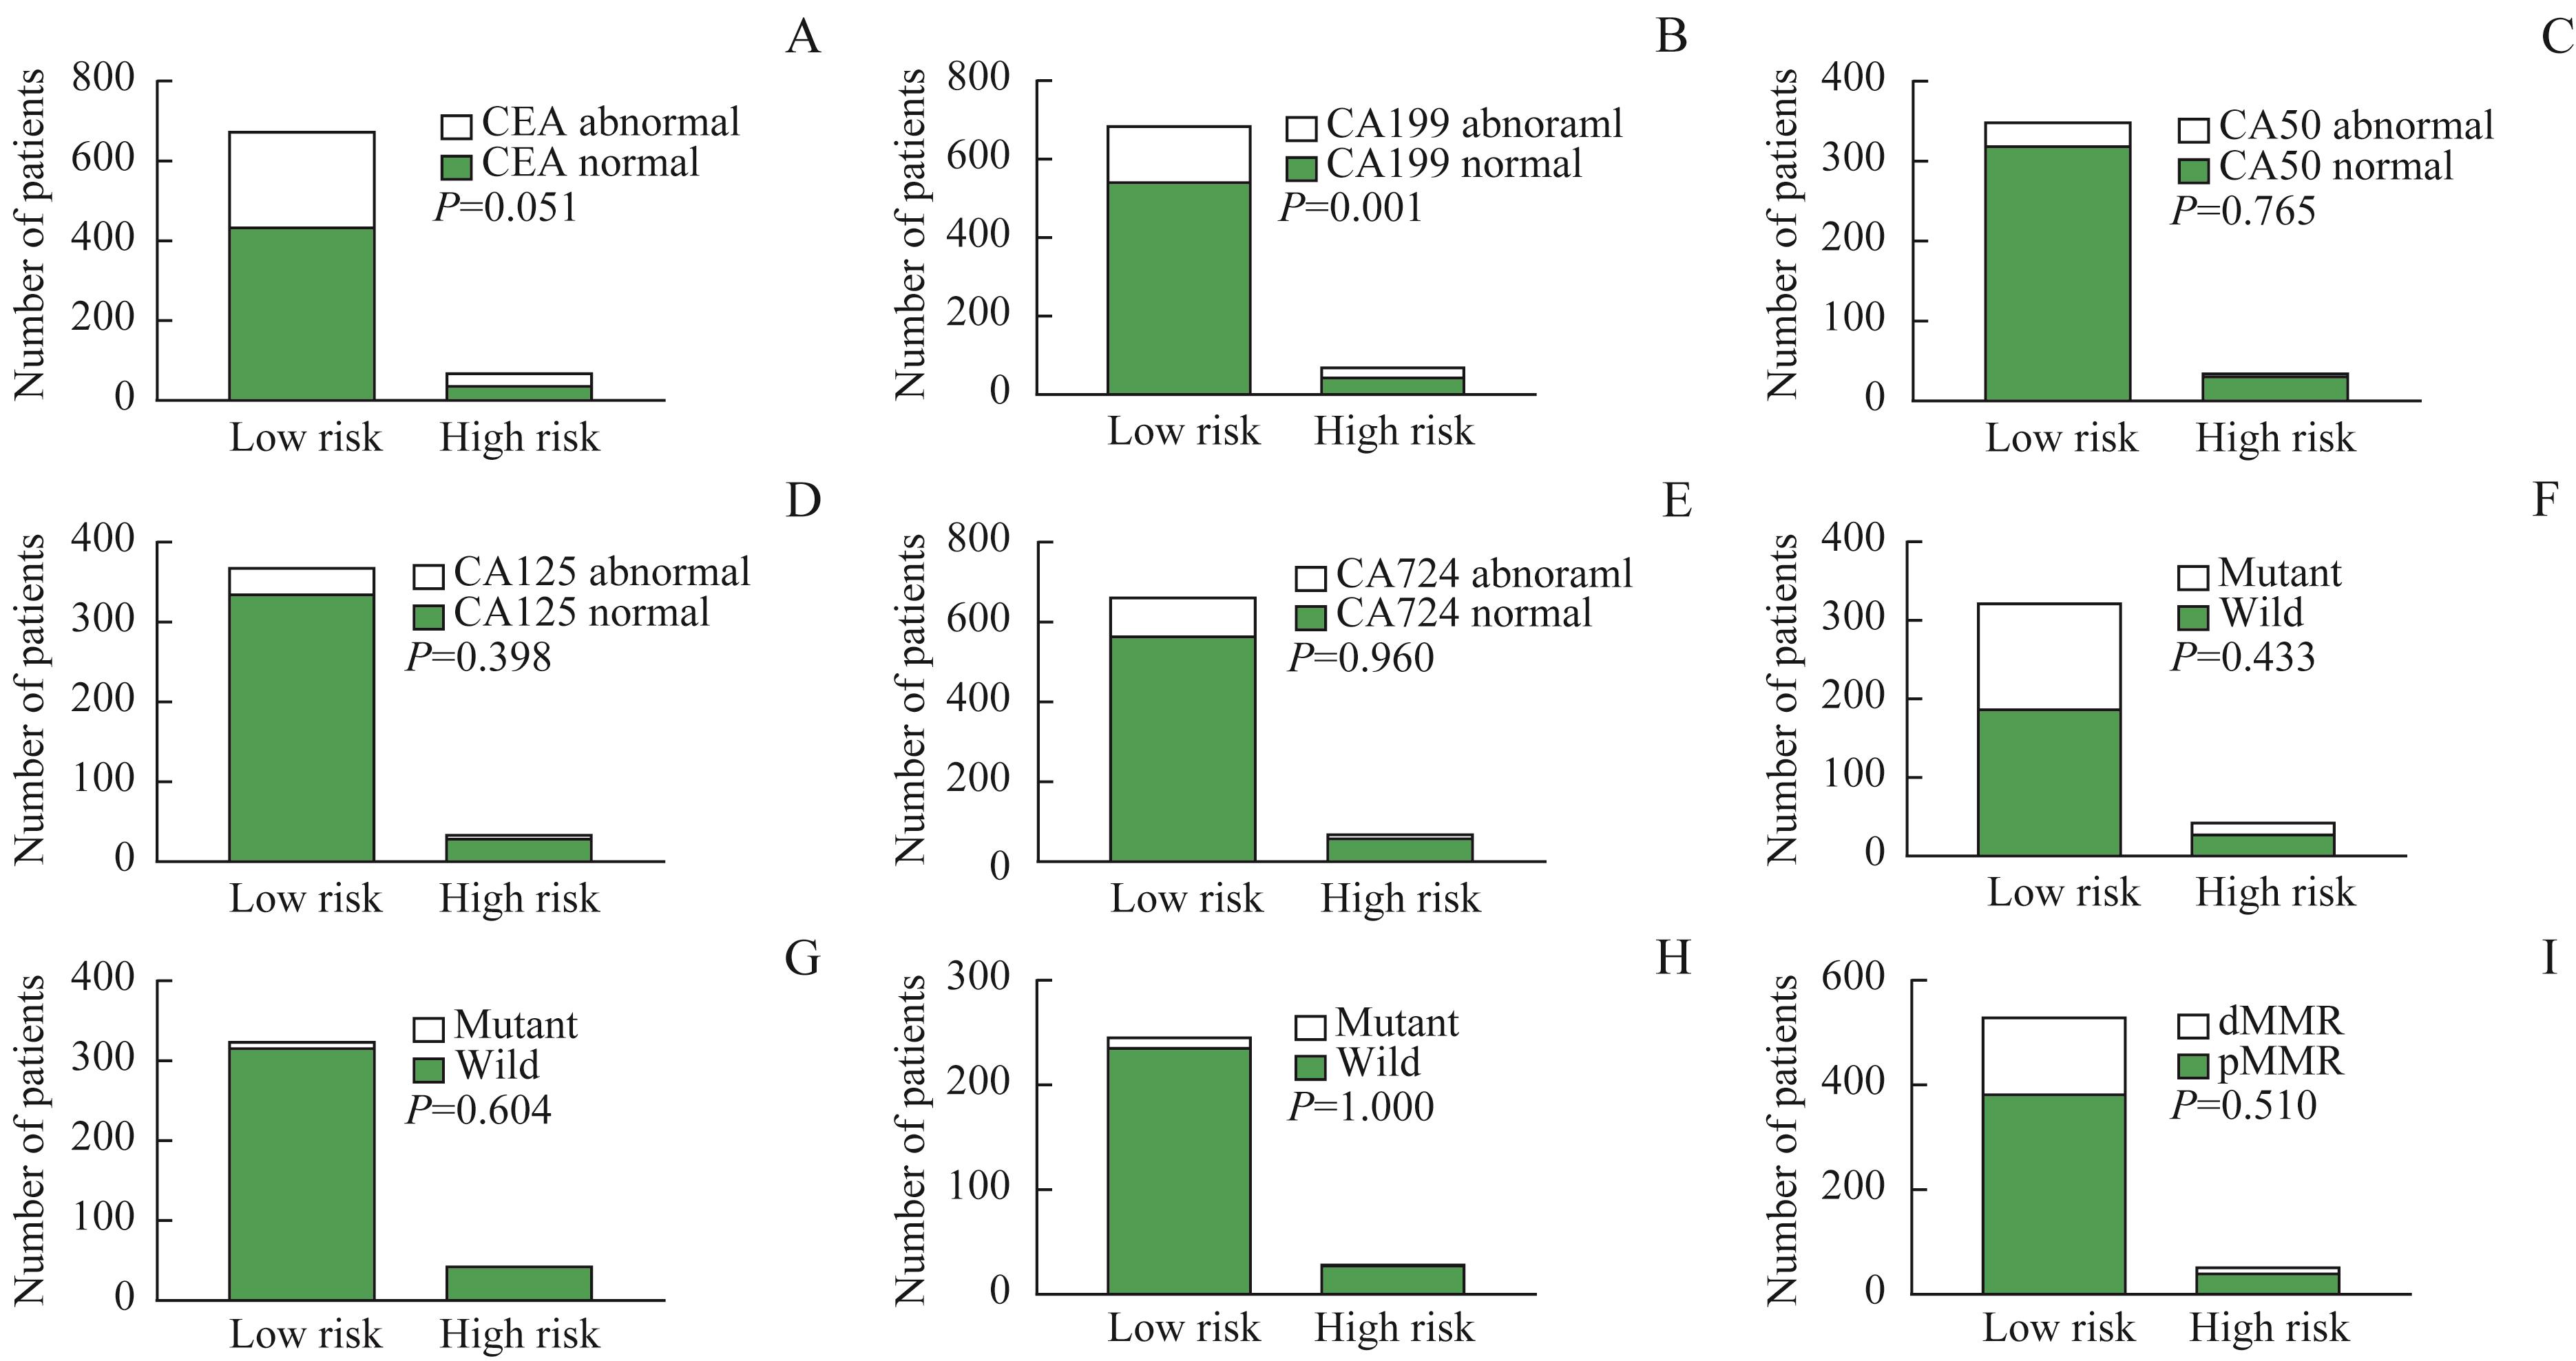
Fig 5 Distributional difference of preoperative serum tumor markers, gene mutation status and mismatch repair gene status for high-risk group and low-risk group

Fig 6 Kaplan-Meier survival analysis curves for high risk group and low risk group
| 1 | SUNG H, FERLAY J, SIEGEL R L, et al. Global cancer statistics 2020: globocan estimates of incidence and mortality worldwide for 36 cancers in 185 countries[J]. CA Cancer J Clin, 2021, 71(3): 209-249. |
| 2 | ZHENG R S, ZHANG S W, ZENG H M, et al. Cancer incidence and mortality in China, 2016[J]. J Natl Cancer Cent, 2022, 2(1): 1-9. |
| 3 | YUAN H, DONG Q J, ZHENG B A, et al. Lymphovascular invasion is a high risk factor for stage Ⅰ/Ⅱ colorectal cancer: a systematic review and meta-analysis[J]. Oncotarget, 2017, 8(28): 46565-46579. |
| 4 | JIANG H H, ZHANG Z Y, WANG X Y, et al. Prognostic significance of lymphovascular invasion in colorectal cancer and its association with genomic alterations[J]. World J Gastroenterol, 2019, 25(20): 2489-2502. |
| 5 | KNIJN N, MOGK S C, TEERENSTRA S, et al. Perineural invasion is a strong prognostic factor in colorectal cancer: a systematic review[J]. Am J Surg Pathol, 2016, 40(1): 103-112. |
| 6 | CONTE G A, QARI O, FASANO G A, et al. S100 staining adds to the prognostic significance of the combination of perineural invasion and lymphovascular invasion in colorectal cancer[J]. Appl Immunohistochem Mol Morphol, 2020, 28(5): 354-359. |
| 7 | MESKER W E, JUNGGEBURT J M C, SZUHAI K, et al. The carcinoma-stromal ratio of colon carcinoma is an independent factor for survival compared to lymph node status and tumor stage[J]. Cell Oncol, 2007, 29(5): 387-398. |
| 8 | LUO Z, FU Z M, LI T F, et al. Development and validation of the individualized prognostic nomograms in patients with right- and left-sided colon cancer[J]. Front Oncol, 2021, 11: 709835. |
| 9 | 李腾飞, 杨彦, 黄陈. 肿瘤间质比在Ⅱ、Ⅲ期结直肠癌患者预后评估中的价值[J]. 中华结直肠疾病电子杂志, 2021, 10(2): 158-163. |
| LI T F, YANG Y, HUANG C. The prognostic value of tumor stroma ratio in patients with stageⅡand Ⅲ colorevtal caner[J]. Chin J Colorec Dis ( Electronic Edition ), 2021, 10(2): 158-163. | |
| 10 | NASO J R, YANG H M, SCHAEFFER D F. Variability in synoptic reporting of colorectal cancer pT4a category and lymphovascular invasion[J]. Arch Pathol Lab Med, 2021, 145(3): 343-351. |
| 11 | ALOTAIBI A M, LEE J L, KIM J, et al. Prognostic and oncologic significance of perineural invasion in sporadic colorectal cancer[J]. Ann Surg Oncol, 2017, 24(6): 1626-1634. |
| 12 | LI T F, YU Z K, YANG Y, et al. Rapid multi-dynamic algorithm for gray image analysis of the stroma percentage on colorectal cancer[J]. J Cancer, 2021, 12(15): 4561-4573. |
| 13 | LIZARDO D Y, KUANG C Y, HAO S S, et al. Immunotherapy efficacy on mismatch repair-deficient colorectal cancer: from bench to bedside[J]. Biochim Biophys Acta Rev Cancer, 2020, 1874(2): 188447. |
| 14 | 蔡建, 王磊. 回眸2018: 聚焦结直肠癌研究领域[J]. 中华胃肠外科杂志, 2019, 22(1): 9-16. |
| CAI J, WANG L. Focus on colorectal cancer research, 2018[J]. Chin J Gastrointest Surg, 2019, 22(1): 9-16. | |
| 15 | DIENSTMANN R, MASON M J, SINICROPE F A, et al. Prediction of overall survival in stage Ⅱ and Ⅲ colon cancer beyond TNM system: a retrospective, pooled biomarker study[J]. Ann Oncol, 2017, 28(5): 1023-1031. |
| 16 | ZHANG C C, WANG Z, YANG Z, et al. Phase Ⅰ escalating-dose trial of CAR-T therapy targeting CEA+ metastatic colorectal cancers[J]. Mol Ther, 2017, 25(5): 1248-1258. |
| 17 | THOMSEN M, SKOVLUND E, SORBYE H, et al. Prognostic role of carcinoembryonic antigen and carbohydrate antigen 19-9 in metastatic colorectal cancer: a BRAF-mutant subset with high CA 19-9 level and poor outcome[J]. Br J Cancer, 2018, 118(12): 1609-1616. |
| 18 | ZHU G M, PEI L J, XIA H W, et al. Role of oncogenic KRAS in the prognosis, diagnosis and treatment of colorectal cancer[J]. Mol Cancer, 2021, 20(1): 143. |
| 19 | YOTHERS G, O'CONNELL M J, ALLEGRA C J, et al. Oxaliplatin as adjuvant therapy for colon cancer: updated results of NSABP C-07 trial, including survival and subset analyses[J]. J Clin Oncol, 2011, 29(28): 3768-3774. |
| 20 | BENSON A B, VENOOK A P, AL-HAWARY M M, et al. NCCN guidelines insights: colon cancer, version 2.2018[J]. J Natl Compr Canc Netw, 2018, 16(4): 359-369. |
| 21 | LABIANCA R, NORDLINGER B, BERETTA G D, et al. Early colon cancer: ESMO Clinical Practice Guidelines for diagnosis, treatment and follow-up[J]. Ann Oncol, 2013, 24(Suppl 6): vi64-vi72. |
| [1] | Mei Zixian, Meng Xuchen, Su Wenjing, Zhong Weijie, Tang Dingzhong, Li Yi. Clinical-inflammatory combined model for predicting poor prognosis in male patients with anterior circulation acute ischemic stroke with large vessel occlusion after mechanical thrombectomy [J]. Journal of Shanghai Jiao Tong University (Medical Science), 2026, 46(3): 332-339. |
| [2] | CHEN Siyuan, SHI Qing, FU Di, WANG Li, CHENG Shu, XU Pengpeng, ZHAO Weili. Clinicopathologic characteristics, gene mutation profile, and prognostic analysis of diffuse large B-cell lymphoma with lung involvement [J]. Journal of Shanghai Jiao Tong University (Medical Science), 2025, 45(9): 1214-1220. |
| [3] | JIANG Yi, HUANG Chenhao, LI Zhiliang, WU Junwei, ZHAO Ren, ZHANG Tao. Effect of preoperative chemotherapy combined with immunotherapy in a colorectal cancer patient with KRAS mutation [J]. Journal of Shanghai Jiao Tong University (Medical Science), 2025, 45(9): 1256-1260. |
| [4] | YAN Zhi, WU Xingyue, YAO Weiqin, YAN Lingzhi, JIN Song, SHANG Jingjing, SHI Xiaolan, WU Depei, FU Chengcheng. Dynamic changes and prognostic significance of immunoparesis in newly diagnosed multiple myeloma patients [J]. Journal of Shanghai Jiao Tong University (Medical Science), 2025, 45(7): 807-814. |
| [5] | SUI Chengliang, SHEN Yanying, LIU Zebing. Clinicopathological features of 12 cases of epithelioid hemangioendothelioma [J]. Journal of Shanghai Jiao Tong University (Medical Science), 2025, 45(7): 892-899. |
| [6] | HUANG Runyu, ZHANG Chunye, ZHANG Ying, ZHAO Zhengyan, YANG Yang, WU Lan. Features of oral peripheral T-cell lymphoma, not otherwise specified [J]. Journal of Shanghai Jiao Tong University (Medical Science), 2025, 45(5): 653-660. |
| [7] | XU Tianyun, SHEN Yiming, JIANG Meng. Clinical management of heart failure with improved ejection fraction: treatment and maintenance [J]. Journal of Shanghai Jiao Tong University (Medical Science), 2025, 45(4): 493-499. |
| [8] | CHEN Jiaying, CHU Yimin, PENG Haixia. Study on prediction model and influencing factors of progression-free survival in colorectal cancer [J]. Journal of Shanghai Jiao Tong University (Medical Science), 2025, 45(3): 324-334. |
| [9] | SUN Ruizhuang, QIAO Kunpeng, LI Pu, XU Xiaolian, MENG Jun. Clinical value and transcriptional regulatory mechanism of ABCA7 in colorectal cancer [J]. Journal of Shanghai Jiao Tong University (Medical Science), 2025, 45(11): 1490-1501. |
| [10] | LIANG Lebin, CHEN Huifang, LAI Shujing, GU liang, SU Bing. Analysis of epigenetic characteristics in colonic tumors of Apcmin/+via spatial ATAC-seq technology [J]. Journal of Shanghai Jiao Tong University (Medical Science), 2025, 45(10): 1261-1270. |
| [11] | QIAN Liheng, WEN Kailing, LIAO Yingna, LI Shuxin, NIE Huizhen. Study on the effect and mechanism of sorting nexin 1 on inhibiting the proliferation and migration of colorectal cancer cells [J]. Journal of Shanghai Jiao Tong University (Medical Science), 2024, 44(9): 1124-1135. |
| [12] | WANG Boen, CHEN Siyuan, SHI Qing, ZHANG Muchen, YI Hongmei, DONG Lei, WANG Li, CHENG Shu, XU Pengpeng, ZHAO Weili. Clinicopathologic characteristics of patients with kidney-involved diffuse large B-cell lymphoma [J]. Journal of Shanghai Jiao Tong University (Medical Science), 2024, 44(9): 1162-1168. |
| [13] | FENG Xujiao, LIU Jianyue, QI Yangyang, SUN Jing, SHEN Lei. Phenotype and function of NK cell in colorectal cancer [J]. Journal of Shanghai Jiao Tong University (Medical Science), 2024, 44(6): 713-722. |
| [14] | YU Yang, MENG Dan, QIU Yiwen, YUAN Jian, ZHU Yingjie. Analysis of impact of type 1 diabetes on colorectal cancer by using two-sample Mendelian randomization [J]. Journal of Shanghai Jiao Tong University (Medical Science), 2024, 44(6): 755-761. |
| [15] | SONG Chenlu, XIANG Jun, YANG Huizhong. Early alarming effect of serum heparin-binding protein on prognosis and occurrence of sepsis in severely burned patients [J]. Journal of Shanghai Jiao Tong University (Medical Science), 2024, 44(4): 474-481. |
| Viewed | ||||||
|
Full text |
|
|||||
|
Abstract |
|
|||||