
Journal of Shanghai Jiao Tong University (Medical Science) ›› 2025, Vol. 45 ›› Issue (3): 292-300.doi: 10.3969/j.issn.1674-8115.2025.03.005
• Clinical research • Previous Articles Next Articles
YANG Chendie1( ), HU Changqing2(), YUAN He3, TAY Guan Poh3, AMUTI Abulikemu3, ZHANG Ruiyan1, WANG Xiaoqun1,3()
Received:2024-08-26
Accepted:2024-11-04
Online:2025-03-28
Published:2025-03-18
Contact:
WANG Xiaoqun
E-mail:yangcd1029@163.com;690068686@qq.com;wangxq@shsmu.edu.cn
Supported by:CLC Number:
YANG Chendie, HU Changqing, YUAN He, TAY Guan Poh, AMUTI Abulikemu, ZHANG Ruiyan, WANG Xiaoqun. Association between insulin resistance and left ventricular remodeling after STEMI in patients without a history of diabetes mellitus[J]. Journal of Shanghai Jiao Tong University (Medical Science), 2025,(3): 292-300.
Add to citation manager EndNote|Ris|BibTeX
URL: https://xuebao.shsmu.edu.cn/EN/10.3969/j.issn.1674-8115.2025.03.005
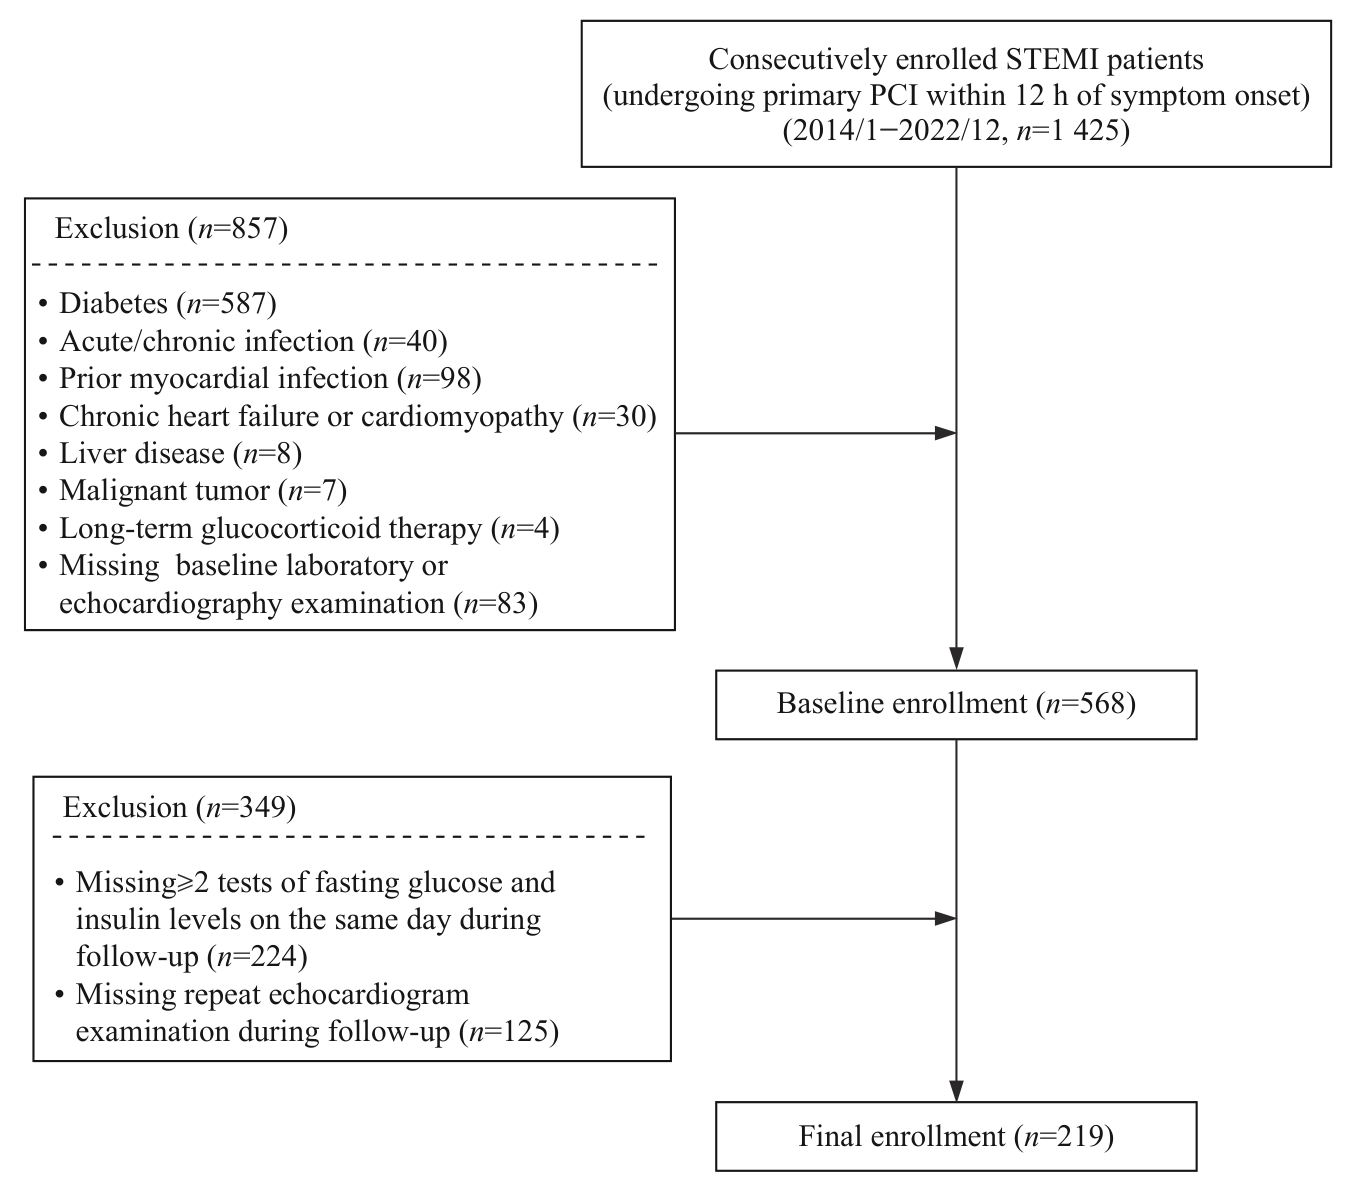
Fig 1 Flow chart of patient enrollment
| Item | Mean HOMA-IR level | P value | |||
|---|---|---|---|---|---|
Low (≤1.58) (n=55) | Low-medium (>1.58 and ≤2.41) (n=56) | Medium-high (>2.41 and ≤3.98) (n=54) | High (>3.98) (n=54) | ||
Demographic characteristics and clinical assessment | |||||
| Gender (male)/n (%) | 48 (87.3) | 46 (82.1) | 47 (87.0) | 46 (85.2) | 0.862 |
| Age/year | 63.40±12.28 | 66.04±10.56 | 60.39±10.45 | 60.70±13.47 | 0.042 |
| Hypertension/% | 27 (49.1) | 25 (44.6) | 28 (51.9) | 39 (72.2) | 0.020 |
| Current smoker/% | 27 (49.1) | 22 (39.3) | 27 (50.0) | 30 (55.6) | 0.386 |
| BMI/(kg·m-2) | 23.24±3.48 | 23.67±3.27 | 25.80±2.74 | 27.27±6.61 | <0.001 |
| Systolic blood pressure/mmHg | 121.89±22.83 | 121.36±16.63 | 121.72±20.59 | 127.48±17.38 | 0.305 |
| Diastolic blood pressure/mmHg | 73.78±13.63 | 76.68±12.50 | 74.61±14.66 | 77.39±13.11 | 0.460 |
| Laboratory measurement | |||||
| HbA1c/% | 5.61±0.32 | 5.66±0.38 | 5.87±0.84 | 6.19±1.22 | 0.001 |
| Fasting glucose/(mmol·L-1) | 5.60 (4.96‒7.53) | 6.68 (5.34‒8.48) | 5.84 (4.78‒7.50) | 6.54 (5.62‒9.00) | 0.073 |
| 2 h Postprandial blood glucose/(mmol·L-1) | 8.61 (7.46‒12.40) | 8.72 (7.37‒10.40) | 8.30 (7.01‒10.59) | 8.61 (7.46‒12.40) | 0.587 |
| Fasting insulin/(μIU·mL-1) | 6.69(5.02‒9.12) | 9.27 (7.22‒12.45) | 14.29 (11.31‒17.47) | 16.67 (12.83‒21.80) | <0.001 |
| Alanine transaminase/(IU·L-1) | 34.80±26.54 | 42.71±39.29 | 37.28±22.18 | 46.44±31.00 | 0.188 |
| Triglyceride/(mmol·L-1) | 1.08 (0.77‒1.60) | 1.43 (1.00‒1.80) | 1.82 (1.31‒2.41) | 1.90 (1.35‒2.45) | <0.001 |
| Total cholesterol/(mmol·L-1) | 4.68±1.39 | 4.60±1.29 | 4.77±1.05 | 4.86±1.05 | 0.700 |
| LDL-C/(mmol·L-1) | 3.04±1.36 | 2.91±1.01 | 3.01±1.00 | 3.01±0.85 | 0.928 |
| HDL-C/(mmol·L-1) | 1.14±0.28 | 1.09±0.24 | 1.03±0.20 | 1.02±0.20 | 0.030 |
| Serum creatine/(μmol·L-1) | 79.42±17.26 | 82.36±16.11 | 84.83±22.32 | 84.24±25.95 | 0.521 |
| Blood urea nitrogen/(mmol·L-1) | 5.81±1.58 | 5.74±1.52 | 5.52±1.63 | 5.61±1.60 | 0.775 |
| eGFR/[mL·min-1·(1.732 m)-2] | 97.50±21.38 | 91.00±12.33 | 98.45±25.65 | 97.94±22.95 | 0.208 |
| NT-proBNP/(pg·mL-1) | 355.50 (148.40‒1 525.00) | 493.25 (192.78‒1 364.50) | 602.15 (135.18‒1 861.00) | 253.20 (110.62‒1 069.00) | 0.285 |
| Peak cTnI level/(ng·mL-1) | 41.20 (5.47‒87.67) | 54.70 (15.42‒104.85) | 44.64 (9.69‒110.19) | 31.40 (25.61‒95.52) | 0.389 |
| Medication use | |||||
| Aspirin/n (%) | 50 (90.9) | 56 (100.0) | 54 (100.0) | 51 (94.4) | 0.025 |
| P2Y12 inhibitor/n (%) | 55 (100.0) | 52 (92.9) | 54 (100.0) | 50 (92.6) | 0.041 |
| β blocker/n (%) | 53 (96.4) | 40 (71.4) | 47 (87.0) | 50 (92.6) | 0.001 |
| ACEI/ARB/n (%) | 36 (65.5) | 39 (69.6) | 39 (72.2) | 47 (87.0) | 0.061 |
| ARNI/n (%) | 15 (27.3) | 12 (21.4) | 16 (29.6) | 17 (31.5) | 0.661 |
| SGLT2 inhibitor/n (%) | 2 (3.6) | 2 (3.6) | 2 (3.7) | 7 (13.0) | 0.096 |
| MRA/n (%) | 4 (7.3) | 6 (10.7) | 7 (13.0) | 6 (11.1) | 0.806 |
| Diuretics/n (%) | 1 (1.8) | 6 (10.7) | 7 (13.0) | 4 (7.4) | 0.164 |
Tab 1 Baseline characteristics of patients with different HOMA-IR levels
| Item | Mean HOMA-IR level | P value | |||
|---|---|---|---|---|---|
Low (≤1.58) (n=55) | Low-medium (>1.58 and ≤2.41) (n=56) | Medium-high (>2.41 and ≤3.98) (n=54) | High (>3.98) (n=54) | ||
Demographic characteristics and clinical assessment | |||||
| Gender (male)/n (%) | 48 (87.3) | 46 (82.1) | 47 (87.0) | 46 (85.2) | 0.862 |
| Age/year | 63.40±12.28 | 66.04±10.56 | 60.39±10.45 | 60.70±13.47 | 0.042 |
| Hypertension/% | 27 (49.1) | 25 (44.6) | 28 (51.9) | 39 (72.2) | 0.020 |
| Current smoker/% | 27 (49.1) | 22 (39.3) | 27 (50.0) | 30 (55.6) | 0.386 |
| BMI/(kg·m-2) | 23.24±3.48 | 23.67±3.27 | 25.80±2.74 | 27.27±6.61 | <0.001 |
| Systolic blood pressure/mmHg | 121.89±22.83 | 121.36±16.63 | 121.72±20.59 | 127.48±17.38 | 0.305 |
| Diastolic blood pressure/mmHg | 73.78±13.63 | 76.68±12.50 | 74.61±14.66 | 77.39±13.11 | 0.460 |
| Laboratory measurement | |||||
| HbA1c/% | 5.61±0.32 | 5.66±0.38 | 5.87±0.84 | 6.19±1.22 | 0.001 |
| Fasting glucose/(mmol·L-1) | 5.60 (4.96‒7.53) | 6.68 (5.34‒8.48) | 5.84 (4.78‒7.50) | 6.54 (5.62‒9.00) | 0.073 |
| 2 h Postprandial blood glucose/(mmol·L-1) | 8.61 (7.46‒12.40) | 8.72 (7.37‒10.40) | 8.30 (7.01‒10.59) | 8.61 (7.46‒12.40) | 0.587 |
| Fasting insulin/(μIU·mL-1) | 6.69(5.02‒9.12) | 9.27 (7.22‒12.45) | 14.29 (11.31‒17.47) | 16.67 (12.83‒21.80) | <0.001 |
| Alanine transaminase/(IU·L-1) | 34.80±26.54 | 42.71±39.29 | 37.28±22.18 | 46.44±31.00 | 0.188 |
| Triglyceride/(mmol·L-1) | 1.08 (0.77‒1.60) | 1.43 (1.00‒1.80) | 1.82 (1.31‒2.41) | 1.90 (1.35‒2.45) | <0.001 |
| Total cholesterol/(mmol·L-1) | 4.68±1.39 | 4.60±1.29 | 4.77±1.05 | 4.86±1.05 | 0.700 |
| LDL-C/(mmol·L-1) | 3.04±1.36 | 2.91±1.01 | 3.01±1.00 | 3.01±0.85 | 0.928 |
| HDL-C/(mmol·L-1) | 1.14±0.28 | 1.09±0.24 | 1.03±0.20 | 1.02±0.20 | 0.030 |
| Serum creatine/(μmol·L-1) | 79.42±17.26 | 82.36±16.11 | 84.83±22.32 | 84.24±25.95 | 0.521 |
| Blood urea nitrogen/(mmol·L-1) | 5.81±1.58 | 5.74±1.52 | 5.52±1.63 | 5.61±1.60 | 0.775 |
| eGFR/[mL·min-1·(1.732 m)-2] | 97.50±21.38 | 91.00±12.33 | 98.45±25.65 | 97.94±22.95 | 0.208 |
| NT-proBNP/(pg·mL-1) | 355.50 (148.40‒1 525.00) | 493.25 (192.78‒1 364.50) | 602.15 (135.18‒1 861.00) | 253.20 (110.62‒1 069.00) | 0.285 |
| Peak cTnI level/(ng·mL-1) | 41.20 (5.47‒87.67) | 54.70 (15.42‒104.85) | 44.64 (9.69‒110.19) | 31.40 (25.61‒95.52) | 0.389 |
| Medication use | |||||
| Aspirin/n (%) | 50 (90.9) | 56 (100.0) | 54 (100.0) | 51 (94.4) | 0.025 |
| P2Y12 inhibitor/n (%) | 55 (100.0) | 52 (92.9) | 54 (100.0) | 50 (92.6) | 0.041 |
| β blocker/n (%) | 53 (96.4) | 40 (71.4) | 47 (87.0) | 50 (92.6) | 0.001 |
| ACEI/ARB/n (%) | 36 (65.5) | 39 (69.6) | 39 (72.2) | 47 (87.0) | 0.061 |
| ARNI/n (%) | 15 (27.3) | 12 (21.4) | 16 (29.6) | 17 (31.5) | 0.661 |
| SGLT2 inhibitor/n (%) | 2 (3.6) | 2 (3.6) | 2 (3.7) | 7 (13.0) | 0.096 |
| MRA/n (%) | 4 (7.3) | 6 (10.7) | 7 (13.0) | 6 (11.1) | 0.806 |
| Diuretics/n (%) | 1 (1.8) | 6 (10.7) | 7 (13.0) | 4 (7.4) | 0.164 |
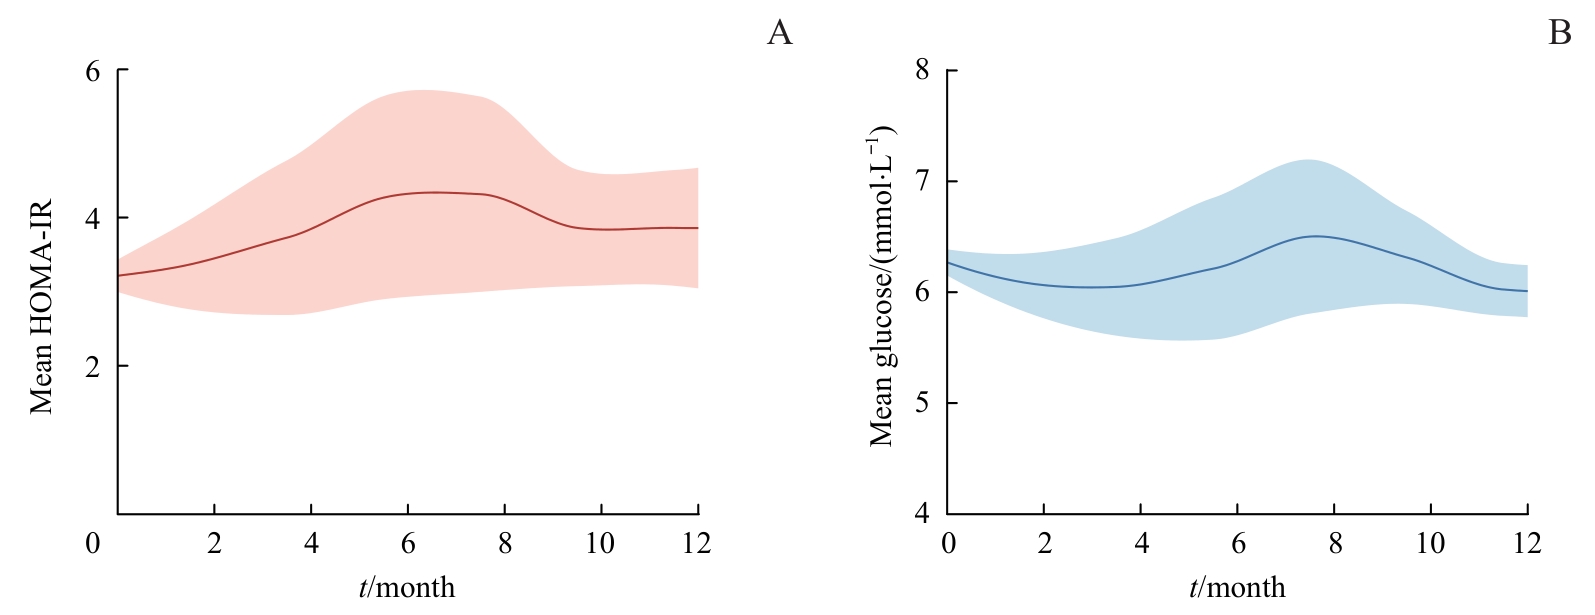
Fig 2 Mean levels of visit-to-visit HOMA-IR and fasting glucose during follow-up
| Item | Mean HOMA-IR level | P value | |||
|---|---|---|---|---|---|
| Low(≤1.58) | Low-medium (>1.58 and ≤2.41) | Medium-high (>2.41 and ≤3.98) | High (>3.98) | ||
| LVEDV index/(mL·m-2) | |||||
| Baseline | 71.41±20.42 | 68.22±15.72 | 73.52±18.68 | 63.09±11.13 | 0.009 |
| Follow-up | 68.69±21.54 | 69.11±16.91 | 71.99±14.54 | 66.85±12.42 | 0.455 |
| Δ | -2.73±12.30 | 0.88±9.58 | -1.52±12.01 | 3.77±9.93 | 0.013 |
| LVESV index/(mL·m-2) | |||||
| Baseline | 30.01±15.62 | 27.96±12.03 | 31.20±14.04 | 24.48±6.23 | 0.032 |
| Follow-up | 28.45±16.11 | 28.33±12.47 | 28.74±10.16 | 25.67±8.75 | 0.528 |
| Δ | -1.56±6.22 | 0.37±5.87 | -2.46±9.57 | 1.19±8.10 | 0.047 |
| LVEDD/mm | |||||
| Baseline | 50.56±6.50 | 49.84±6.06 | 52.46±5.45 | 49.87±4.01 | 0.051 |
| Follow-up | 49.76±6.99 | 50.00±5.93 | 52.07±4.41 | 50.91±4.13 | 0.118 |
| Δ | -0.80±3.46 | 0.16±3.03 | -0.39±3.49 | 1.04±3.31 | 0.027 |
| LVESD/mm | |||||
| Baseline | 34.44±7.14 | 33.88±6.55 | 35.91±6.33 | 33.39±4.15 | 0.168 |
| Follow-up | 33.64±7.40 | 33.91±6.31 | 35.00±4.67 | 33.72±4.64 | 0.599 |
| Δ | -0.80±2.59 | 0.04±2.91 | -0.91±3.67 | 0.33±4.11 | 0.147 |
| IVST/mm | |||||
| Baseline | 9.36±1.01 | 9.32±1.16 | 9.93±1.53 | 9.46±1.30 | 0.050 |
| Follow-up | 9.33±1.02 | 9.11±1.14 | 9.54±1.22 | 9.46±1.19 | 0.216 |
| Δ | -0.04±0.90 | -0.21±0.99 | -0.39±1.17 | 0±1.17 | 0.204 |
| LVPWT/mm | |||||
| Baseline | 8.93±0.63 | 8.66±0.84 | 9.33±0.95 | 9.00±1.18 | 0.002 |
| Follow-up | 8.87±0.75 | 8.79±0.85 | 9.13±0.97 | 8.91±0.96 | 0.216 |
| Δ | -0.05±0.65 | 0.12±0.72 | -0.20±0.88 | -0.09±1.15 | 0.255 |
| LVMI/(g·mm-2) | |||||
| Baseline | 96.11±24.27 | 90.16±18.38 | 103.38±28.52 | 86.74±18.06 | 0.001 |
| Follow-up | 92.94±24.73 | 90.57±21.50 | 97.43±22.24 | 89.89±20.66 | 0.288 |
| Δ | -3.17±15.22 | 0.42±12.82 | -5.95±14.79 | 3.15±15.28 | 0.008 |
| LVEF/% | |||||
| Baseline | 57.85±8.97 | 58.20±8.85 | 56.69±9.80 | 59.31±8.09 | 0.500 |
| Follow-up | 58.44±9.98 | 57.91±9.55 | 58.33±8.33 | 60.24±7.33 | 0.531 |
| Δ | 0.58±4.89 | -0.29±4.77 | 1.65±3.89 | 0.93±7.08 | 0.285 |
Tab 2 Changes in echocardiography parameters during follow-up grouped by HOMA-IR quartiles
| Item | Mean HOMA-IR level | P value | |||
|---|---|---|---|---|---|
| Low(≤1.58) | Low-medium (>1.58 and ≤2.41) | Medium-high (>2.41 and ≤3.98) | High (>3.98) | ||
| LVEDV index/(mL·m-2) | |||||
| Baseline | 71.41±20.42 | 68.22±15.72 | 73.52±18.68 | 63.09±11.13 | 0.009 |
| Follow-up | 68.69±21.54 | 69.11±16.91 | 71.99±14.54 | 66.85±12.42 | 0.455 |
| Δ | -2.73±12.30 | 0.88±9.58 | -1.52±12.01 | 3.77±9.93 | 0.013 |
| LVESV index/(mL·m-2) | |||||
| Baseline | 30.01±15.62 | 27.96±12.03 | 31.20±14.04 | 24.48±6.23 | 0.032 |
| Follow-up | 28.45±16.11 | 28.33±12.47 | 28.74±10.16 | 25.67±8.75 | 0.528 |
| Δ | -1.56±6.22 | 0.37±5.87 | -2.46±9.57 | 1.19±8.10 | 0.047 |
| LVEDD/mm | |||||
| Baseline | 50.56±6.50 | 49.84±6.06 | 52.46±5.45 | 49.87±4.01 | 0.051 |
| Follow-up | 49.76±6.99 | 50.00±5.93 | 52.07±4.41 | 50.91±4.13 | 0.118 |
| Δ | -0.80±3.46 | 0.16±3.03 | -0.39±3.49 | 1.04±3.31 | 0.027 |
| LVESD/mm | |||||
| Baseline | 34.44±7.14 | 33.88±6.55 | 35.91±6.33 | 33.39±4.15 | 0.168 |
| Follow-up | 33.64±7.40 | 33.91±6.31 | 35.00±4.67 | 33.72±4.64 | 0.599 |
| Δ | -0.80±2.59 | 0.04±2.91 | -0.91±3.67 | 0.33±4.11 | 0.147 |
| IVST/mm | |||||
| Baseline | 9.36±1.01 | 9.32±1.16 | 9.93±1.53 | 9.46±1.30 | 0.050 |
| Follow-up | 9.33±1.02 | 9.11±1.14 | 9.54±1.22 | 9.46±1.19 | 0.216 |
| Δ | -0.04±0.90 | -0.21±0.99 | -0.39±1.17 | 0±1.17 | 0.204 |
| LVPWT/mm | |||||
| Baseline | 8.93±0.63 | 8.66±0.84 | 9.33±0.95 | 9.00±1.18 | 0.002 |
| Follow-up | 8.87±0.75 | 8.79±0.85 | 9.13±0.97 | 8.91±0.96 | 0.216 |
| Δ | -0.05±0.65 | 0.12±0.72 | -0.20±0.88 | -0.09±1.15 | 0.255 |
| LVMI/(g·mm-2) | |||||
| Baseline | 96.11±24.27 | 90.16±18.38 | 103.38±28.52 | 86.74±18.06 | 0.001 |
| Follow-up | 92.94±24.73 | 90.57±21.50 | 97.43±22.24 | 89.89±20.66 | 0.288 |
| Δ | -3.17±15.22 | 0.42±12.82 | -5.95±14.79 | 3.15±15.28 | 0.008 |
| LVEF/% | |||||
| Baseline | 57.85±8.97 | 58.20±8.85 | 56.69±9.80 | 59.31±8.09 | 0.500 |
| Follow-up | 58.44±9.98 | 57.91±9.55 | 58.33±8.33 | 60.24±7.33 | 0.531 |
| Δ | 0.58±4.89 | -0.29±4.77 | 1.65±3.89 | 0.93±7.08 | 0.285 |
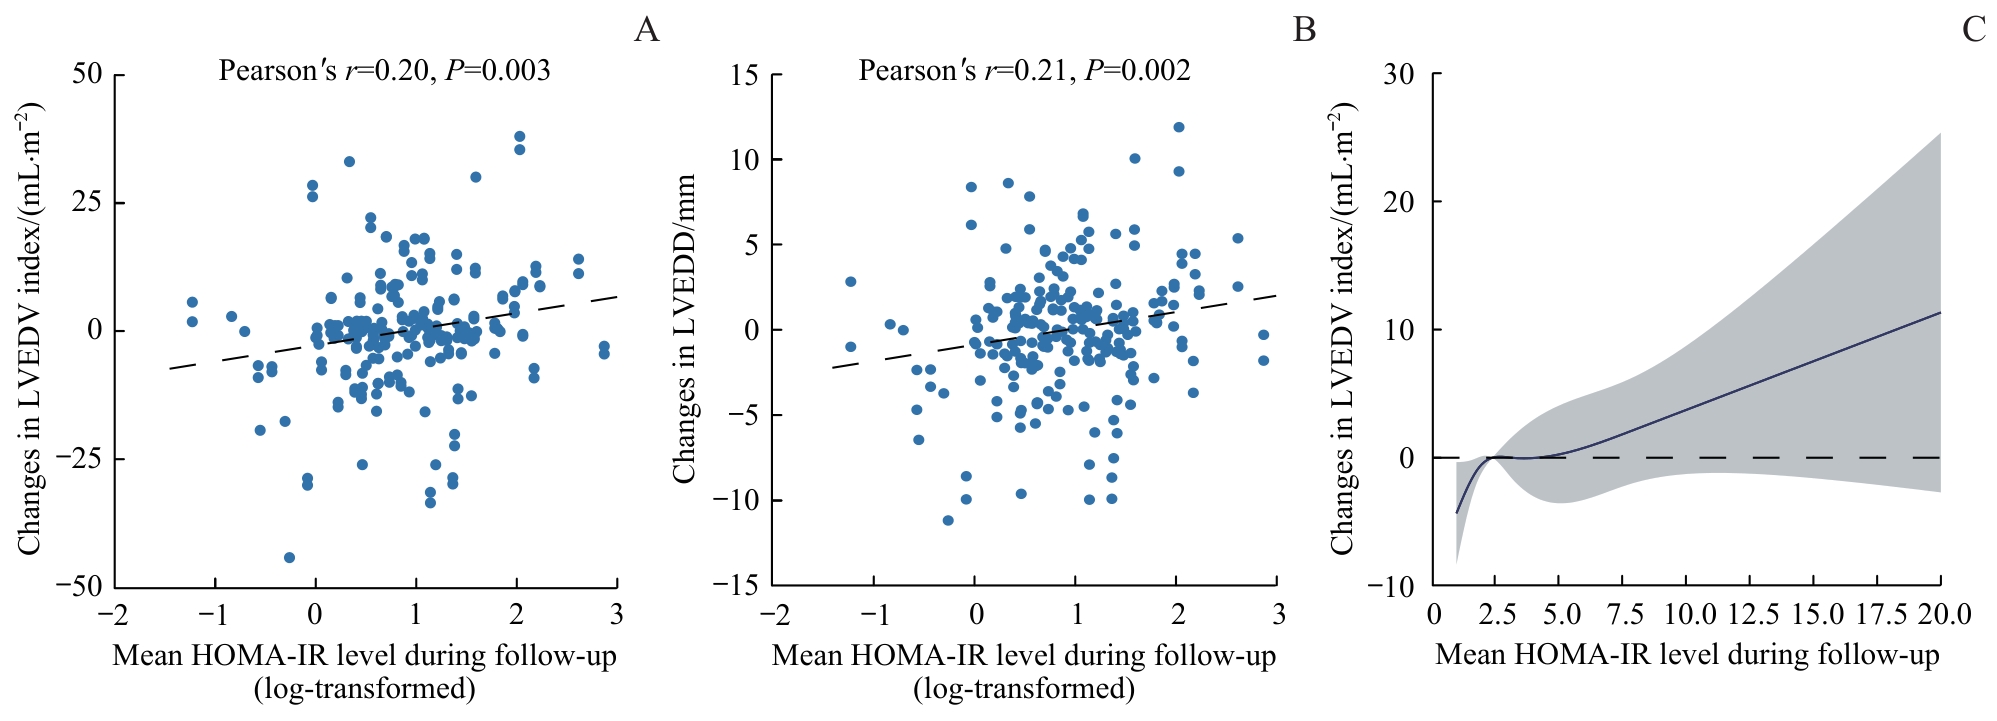
Fig 3 Correlation between mean HOMA-IR and LV remodeling
| Mean HOMA-IR level | Model 1 | Model 2 | Model 3 | Model 4 | Model 5 |
|---|---|---|---|---|---|
| Low (≤1.58) | Reference | Reference | Reference | Reference | Reference |
| Low-medium (>1.58 and ≤2.41) | |||||
| Coefficient (95%CI) | 3.608 (-0.515‒7.730) | 3.506 (-0.645‒7.657) | 4.036 (-0.206‒8.279) | 5.541 (1.169‒9.914) | 3.036 (-1.373‒7.445) |
| Standardized β | 0.141 | 0.137 | 0.157 | 0.216 | 0.118 |
| P value | 0.086 | 0.097 | 0.062 | 0.013 | 0.176 |
| Medium-high (>2.41 and ≤3.98) | |||||
| Coefficient (95%CI) | 1.201 (-2.959‒5.361) | 1.199 (-2.990‒5.388) | 1.918 (-2.434‒6.270) | 2.386 (-1.915‒6.688) | 2.674 (-1.492‒6.839) |
| Standardized β | 0.046 | 0.046 | 0.074 | 0.092 | 0.103 |
| P value | 0.570 | 0.573 | 0.386 | 0.275 | 0.207 |
| High (>3.98) | |||||
| Coefficient (95%CI) | 6.492 (2.332‒10.652) | 6.453 (2.266‒10.641) | 7.348 (2.786‒11.910) | 8.028 (3.530‒12.526) | 7.727 (3.317‒12.136) |
| Standardized β | 0.250 | 0.248 | 0.283 | 0.309 | 0.298 |
| P value | 0.002 | 0.003 | 0.002 | <0.001 | <0.001 |
Tab 3 Multivariate linear regression analysis for ∆LVEDV index and HOMA-IR levels after STEMI
| Mean HOMA-IR level | Model 1 | Model 2 | Model 3 | Model 4 | Model 5 |
|---|---|---|---|---|---|
| Low (≤1.58) | Reference | Reference | Reference | Reference | Reference |
| Low-medium (>1.58 and ≤2.41) | |||||
| Coefficient (95%CI) | 3.608 (-0.515‒7.730) | 3.506 (-0.645‒7.657) | 4.036 (-0.206‒8.279) | 5.541 (1.169‒9.914) | 3.036 (-1.373‒7.445) |
| Standardized β | 0.141 | 0.137 | 0.157 | 0.216 | 0.118 |
| P value | 0.086 | 0.097 | 0.062 | 0.013 | 0.176 |
| Medium-high (>2.41 and ≤3.98) | |||||
| Coefficient (95%CI) | 1.201 (-2.959‒5.361) | 1.199 (-2.990‒5.388) | 1.918 (-2.434‒6.270) | 2.386 (-1.915‒6.688) | 2.674 (-1.492‒6.839) |
| Standardized β | 0.046 | 0.046 | 0.074 | 0.092 | 0.103 |
| P value | 0.570 | 0.573 | 0.386 | 0.275 | 0.207 |
| High (>3.98) | |||||
| Coefficient (95%CI) | 6.492 (2.332‒10.652) | 6.453 (2.266‒10.641) | 7.348 (2.786‒11.910) | 8.028 (3.530‒12.526) | 7.727 (3.317‒12.136) |
| Standardized β | 0.250 | 0.248 | 0.283 | 0.309 | 0.298 |
| P value | 0.002 | 0.003 | 0.002 | <0.001 | <0.001 |
| 1 | JENČA D, MELENOVSKÝ V, STEHLIK J, et al. Heart failure after myocardial infarction: incidence and predictors[J]. ESC Heart Fail, 2021, 8(1): 222-237. |
| 2 | FRANTZ S, HUNDERTMARK M J, SCHULZ-MENGER J, et al. Left ventricular remodelling post-myocardial infarction: pathophysiology, imaging, and novel therapies[J]. Eur Heart J, 2022, 43(27): 2549-2561. |
| 3 | YAP J, IREI J, LOZANO-GERONA J, et al. Macrophages in cardiac remodelling after myocardial infarction[J]. Nat Rev Cardiol, 2023, 20(6): 373-385. |
| 4 | QUIJADA P, PARK S, ZHAO P, et al. Cardiac pericytes mediate the remodeling response to myocardial infarction[J]. J Clin Invest, 2023, 133(10): e162188. |
| 5 | BULLUCK H, CARBERRY J, CARRICK D, et al. Redefining adverse and reverse left ventricular remodeling by cardiovascular magnetic resonance following ST-segment-elevation myocardial infarction and their implications on long-term prognosis[J]. Circ Cardiovasc Imaging, 2020, 13(7): e009937. |
| 6 | BOSTAN M M, STĂTESCU C, ANGHEL L, et al. Post-myocardial infarction ventricular remodeling biomarkers-the key link between pathophysiology and clinic[J]. Biomolecules, 2020, 10(11): 1587. |
| 7 | YANG C D, SHEN Y, DING F H, et al. Visit-to-visit fasting plasma glucose variability is associated with left ventricular adverse remodeling in diabetic patients with STEMI[J]. Cardiovasc Diabetol, 2020, 19(1): 131. |
| 8 | LEE S H, PARK S Y, CHOI C S. Insulin resistance: from mechanisms to therapeutic strategies[J]. Diabetes Metab J, 2022, 46(1): 15-37. |
| 9 | DI PINO A, DEFRONZO R A. Insulin resistance and atherosclerosis: implications for insulin-sensitizing agents[J]. Endocr Rev, 2019, 40(6): 1447-1467. |
| 10 | ROKICKA D, HUDZIK B, WRÓBEL M, et al. The prognostic impact of insulin resistance surrogates in patients with acute myocardial infarction with and without type 2 diabetes[J]. Cardiovasc Diabetol, 2024, 23(1): 147. |
| 11 | JIANG H D, LIU Y T, GUO H Y, et al. The association between the triglyceride-glucose index and in-stent restenosis in patients undergoing percutaneous coronary intervention: a systematic review and meta-analysis[J]. BMC Cardiovasc Disord, 2024, 24(1): 234. |
| 12 | SUNDSTRÖM J, LIND L, NYSTRÖM N, et al. Left ventricular concentric remodeling rather than left ventricular hypertrophy is related to the insulin resistance syndrome in elderly men[J]. Circulation, 2000, 101(22): 2595-2600. |
| 13 | PARIZO J, MAHAFFEY K W. Diabetes and heart failure post-acute myocardial infarction: important associations and need for evidence-based interventions[J]. Eur J Prev Cardiol, 2020, 27(17): 1887-1889. |
| 14 | INGELSSON E, SUNDSTRÖM J, ARNLÖV J, et al. Insulin resistance and risk of congestive heart failure[J]. JAMA, 2005, 294(3): 334-341. |
| 15 | SHAH R V, ABBASI S A, HEYDARI B, et al. Insulin resistance, subclinical left ventricular remodeling, and the obesity paradox: MESA (Multi-Ethnic Study of Atherosclerosis)[J]. J Am Coll Cardiol, 2013, 61(16): 1698-1706. |
| 16 | QIAO T T, LUO T, PEI H L, et al. Association between abdominal obesity indices and risk of cardiovascular events in Chinese populations with type 2 diabetes: a prospective cohort study[J]. Cardiovasc Diabetol, 2022, 21(1): 225. |
| 17 | LIU Y K, LING S S, LUI L M W, et al. Prevalence of type 2 diabetes mellitus, impaired fasting glucose, general obesity, and abdominal obesity in patients with bipolar disorder: a systematic review and meta-analysis[J]. J Affect Disord, 2022, 300: 449-461. |
| 18 | WAN H, WANG Y Y, XIANG Q, et al. Associations between abdominal obesity indices and diabetic complications: Chinese visceral adiposity index and neck circumference[J]. Cardiovasc Diabetol, 2020, 19(1): 118. |
| 19 | MOHAMMADI H, OHM J, DISCACCIATI A, et al. Abdominal obesity and the risk of recurrent atherosclerotic cardiovascular disease after myocardial infarction[J]. Eur J Prev Cardiol, 2020, 27(18): 1944-1952. |
| 20 | POWELL-WILEY T M, POIRIER P, BURKE L E, et al. Obesity and cardiovascular disease: a scientific statement from the American heart association[J]. Circulation, 2021, 143(21): e984-e1010. |
| 21 | DALE ABEL E. Insulin signaling in the heart[J]. Am J Physiol Endocrinol Metab, 2021, 321(1): E130-E145. |
| 22 | TRIFUNOVIC D, STANKOVIC S, SOBIC-SARANOVIC D, et al. Acute insulin resistance in ST-segment elevation myocardial infarction in non-diabetic patients is associated with incomplete myocardial reperfusion and impaired coronary microcirculatory function[J]. Cardiovasc Diabetol, 2014, 13: 73. |
| 23 | THAKKER G D, FRANGOGIANNIS N G, BUJAK M, et al. Effects of diet-induced obesity on inflammation and remodeling after myocardial infarction[J]. Am J Physiol Heart Circ Physiol, 2006, 291(5): H2504-H2514. |
| 24 | MENG Z J, ZHANG Z, ZHAO J L, et al. Nitrative modification of caveolin-3: a novel mechanism of cardiac insulin resistance and a potential therapeutic target against ischemic heart failure in prediabetic animals[J]. Circulation, 2023, 147(15): 1162-1179. |
| [1] | Xu Zhoulin, Yin Gaosheng, Li Yuancong, Yang Yunheng, Zheng Qi, Yang Ping. Study on the role of gastrodin-mediated autophagy in skeletal muscle atrophy after myocardial infarction [J]. Journal of Shanghai Jiao Tong University (Medical Science), 2026, 46(3): 301-311. |
| [2] | Xu Rui, Guo Jiacheng, Xie Shiyao, Han Deheng, Yue Xiuqin. Research advances in nanomaterials in cardiac fibrosis repair: from precision therapy to tissue remodeling [J]. Journal of Shanghai Jiao Tong University (Medical Science), 2026, 46(3): 377-384. |
| [3] | LI Wenli, JIN Lixing, ZHAO Yichao, ZHONG Fangyuan, SHI Yao, LEI Jie, PU Jun, GE Heng. Impact of left ventricular myocardial strain injury on secondary tricuspid regurgitation in acute STEMI assessed by cardiac magnetic resonance [J]. Journal of Shanghai Jiao Tong University (Medical Science), 2025, 45(12): 1578-1588. |
| [4] | RUAN Qingqing, SU Shuzhi, LI Yanting, REN Yuan, DAI Yong, QIAO Zengyong. Intraoperative complications in percutaneous coronary intervention for acute myocardial infarction: development of a risk prediction model [J]. Journal of Shanghai Jiao Tong University (Medical Science), 2025, 45(12): 1589-1597. |
| [5] | JIANG Kai, XU Yue, YANG Xingbo, WANG Dandan, XIANG Yaozu. Hematopoietic imbalance-mediated ventricular remodeling after myocardial infarction: roles of immune cell subsets and emerging therapeutic strategies [J]. Journal of Shanghai Jiao Tong University (Medical Science), 2025, 45(12): 1644-1653. |
| [6] | FAN Bingbin, HE Yuhu. Research progress on the role of mitophagy in pulmonary arterial hypertension [J]. Journal of Shanghai Jiao Tong University (Medical Science), 2025, 45(12): 1654-1661. |
| [7] | HUANG Mingwang, JIA Kangni, YAN Xiaoxiang. Mechanism and therapeutic strategies of myocardial infarction based on circadian rhythm genes [J]. Journal of Shanghai Jiao Tong University (Medical Science), 2025, 45(12): 1671-1678. |
| [8] | LI Lulu, WU Jianyong. A cone-beam computed tomographic study comparing characteristics of maxillary anterior regional alveolar bone remodeling under two reference systems [J]. Journal of Shanghai Jiao Tong University (Medical Science), 2025, 45(11): 1507-1514. |
| [9] | LIU Jingyi, XU Hongyuan, DAI Qinggang, JIANG Lingyong. Progress in the regulatory mechanisms of mandibular condylar development and deformity [J]. Journal of Shanghai Jiao Tong University (Medical Science), 2024, 44(8): 951-958. |
| [10] | LIU Yuting, YU Wanqi, HONG Wen, KANG Sang, LI Xinni, DANZENG Quyang, XIAO Huoyuan, PAN Jingwei. Predictive value of Clinical Frailty Scale in long term prognosis of patients with acute myocardial infarction after in-hospital cardiac rehabilitation [J]. Journal of Shanghai Jiao Tong University (Medical Science), 2024, 44(5): 599-605. |
| [11] | ZHENG Mengyi, MAO Jialiang, ZOU Zhiguo, ZHANG Ruilei, ZHANG Hou, LI Shiguang. Predictive value of systemic immune inflammation index and somatic symptom scale-China in the occurrence of in-hospital major adverse cardiovascular events after first-episode of acute myocardial infarction undergoing PCI [J]. Journal of Shanghai Jiao Tong University (Medical Science), 2024, 44(3): 334-341. |
| [12] | ZHU Siyu, DONG Xiaoyan. New insights in small airway dysfunction of childhood asthma [J]. Journal of Shanghai Jiao Tong University (Medical Science), 2023, 43(4): 500-506. |
| [13] | SHI Cuicui, ZHANG Jie, HUANG Heming, SANG Yuer, LI Guangming. Clinical analysis of insulin resistance in liver cirrhosis patients [J]. Journal of Shanghai Jiao Tong University (Medical Science), 2023, 43(2): 188-193. |
| [14] | GUO Liqiang, ZHAO Shitian, SHU Bing. Research progress in the roles of Notch signaling pathway during fracture healing [J]. Journal of Shanghai Jiao Tong University (Medical Science), 2023, 43(2): 222-229. |
| [15] | LIU Weiwei, WANG Long. Research progress in the correlation and treatment of menopause and non-alcoholic fatty liver disease in women [J]. Journal of Shanghai Jiao Tong University (Medical Science), 2023, 43(1): 125-131. |
| Viewed | ||||||
|
Full text |
|
|||||
|
Abstract |
|
|||||
