根据美国国立综合癌症网络(The National Comprehensive Cancer Network,NCCN)指南[3]的推荐:Ⅰ期直肠癌患者一般行根治性切除;Ⅱ期和Ⅲ期的患者是新辅助放化疗后进行全直肠系膜切除,这种治疗模式可减少局部复发风险;Ⅳ期可切除的直肠癌建议化学治疗(化疗)或放射治疗(放疗),或者手术。所谓新辅助放化疗是指在手术之前进行的放疗或化疗,而辅助放化疗是在手术之后进行的放疗或化疗。尽管放化疗加切除术被认为是可手术直肠癌的标准治疗方法,但它在生存率、术后的生活质量方面给患者带来的影响仍存在争议[4]。一项纳入28项随机对照试验的meta分析研究[5],比较了直肠癌手术联合新辅助放疗或辅助放疗与单纯手术的患者结局,接受手术联合放疗(包括新辅助和辅助)的患者的总生存率仅略好于单纯手术的患者(62% vs 63%,P=0.06),其中术前放疗患者和术后放疗患者相对于单纯手术患者的年死亡率减少差异无统计学意义。另外一项meta分析研究[6]纳入了80项不同的试验,包括41 121名患者,研究发现新辅助放化疗的好处还不足以改善患者的总生存率,原发性肿瘤的转移和术后不良反应是影响患者总生存率的2个主要因素。此外,一项纳入23项随机对照试验的meta分析研究[7]表明,与新辅助化疗联合手术相比,新辅助放化疗联合手术并没有改善患者的总生存率;但是与单纯手术比,新辅助放疗联合手术具有总生存率益处。然而,也有文献[8]指出,与新辅助化疗相比,新辅助放化疗可进一步降低局部晚期直肠癌患者的局部复发率。
综上所述,目前已有的证据之间存在相互矛盾之处。其中,尤为重要的是,尚未有研究比较在接受化疗和手术的直肠癌患者中,新辅助放疗和辅助放疗带来的生存获益,以及哪些人群能从中获得生存效益。故本研究的目的一方面是探索新辅助放疗和辅助放疗对接受化疗和手术治疗的直肠癌患者的生存影响,另一方面是确认直肠癌患者中的哪些亚组能从放疗中真正获益,从而达到对肿瘤患者的精准化治疗。美国癌症监测、流行病学和结果(Surveillance,Epidemiology and End Results,SEER)数据库是美国国家癌症研究所1973年建立的癌症病例数据库。本研究通过对数据库中2005—2015年期间行手术和化疗的直肠癌病例进行回顾性分析,研究新辅助放疗和辅助放疗对直肠癌患者预后的影响,为放疗在直肠癌治疗的临床应用提供参考。
1 资料与方法
1.1 研究对象及分组
本研究使用SEER*Stat软件(版本8.3.9.2,
1.2 收集的变量
本研究收集的变量信息如下:① 诊断年龄(age)。② 性别(gender)。③ 种族(race)。④ 婚姻状态(marital status)。⑤ 肿瘤病理类型(tumor histology)。⑥ 肿瘤大小(tumor size)。⑦ 肿瘤分化程度(grade)。⑧ 第6版美国癌症联合委员会分期(TNM)。⑨ 清扫的淋巴结个数(regional nodes examined)。⑩ 生存时间(survival month)。除了生存时间外,所有的协变量均作为分类变量,按临床经验和以往研究划分截断值。因长程放疗结束后,一般间隔5~12周接受根治性手术。因此,RT+S组和S+RT组排除了生存期小于4个月的患者。
1.3 统计学方法
为了减少回顾性研究中的选择偏倚,RT+S组和S组之间、S组和S+RT组之间以1∶1的比例进行倾向性评分匹配(propensity score matching,PSM),以调整年龄、性别等混杂因素的影响。PSM由“MatchIt”R程序包(卡尺为0.001)进行计算。计算分类变量的频数和百分比,采用χ2检验进行组间比较。通过对数秩检验(log-rank检验)评估Kaplan-Meier生存曲线;采用受限平均生存时间(restricted mean survival time,RMST)估计直肠癌患者5年和10年内平均生存期。使用单因素和多因素Cox比例风险模型分析各组的预后因素。亚组分析采用单因素Cox比例风险模型。总生存期(overall survival,OS)定义为从诊断日期至因任何原因死亡日期的月数。肿瘤特异性生存期(cancer specific survival,CSS)定义为从结直肠癌诊断日期至结直肠癌导致的死亡日期的月数。OS和CSS是研究的2个终点。对研究中的所有变量进行单变量Cox回归模型分析,将P<0.05的变量纳入多因素Cox回归分析。双侧P<0.05表示具有统计学意义。使用的R程序包包括“compareGroups”“survival”“survminer”“survRM2”“MatchIt”“forestplot”“cobalt”。
2 结果
2.1 纳入患者及不同组间基本临床信息的匹配
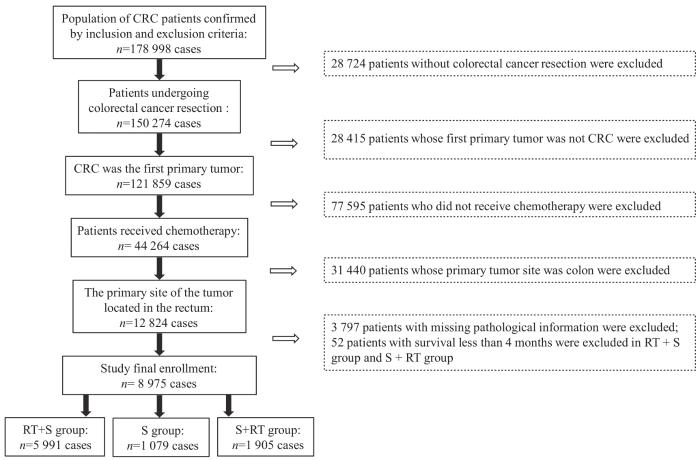
图1
图1
接受手术和化疗的直肠癌患者纳入流程图
Fig 1
Flow chart for inclusion of rectal cancer patients undergoing surgery and chemotherapy
表1 PSM前后RT+S组和S组直肠癌患者的临床基本特征
Tab 1
| Characteristic | Before PSM | After PSM | ||||||
|---|---|---|---|---|---|---|---|---|
All (n=7 070) | S group (n=1 079) | RT+S group (n=5 991) | P value | All (n=1 906) | S group (n=953) | RT+S group (n=953) | P value | |
| Age/n (%) | 0.024 | 0.999 | ||||||
| <50 years | 1 606 (22.7) | 216 (20.0) | 1 390 (23.2) | 371 (19.5) | 185 (19.4) | 186 (19.5) | ||
| ≥50 years | 5 464 (77.3) | 863 (80.0) | 4 601 (76.8) | 1 535 (80.5) | 768 (80.6) | 767 (80.5) | ||
| Gender/n (%) | 0.049 | 0.999 | ||||||
| Male | 4 412 (62.4) | 644 (59.7) | 3 768 (62.9) | 1 129 (59.2) | 564 (59.2) | 565 (59.3) | ||
| Female | 2 658 (37.6) | 435 (40.3) | 2 223 (37.1) | 777 (40.8) | 389 (40.8) | 388 (40.7) | ||
| Race/n (%) | 0.063 | 0.294 | ||||||
| White | 5 414 (76.6) | 818 (75.8) | 4 596 (76.7) | 1 416 (74.3) | 699 (73.3) | 717 (75.2) | ||
| Black | 524 (7.4) | 98 (9.1) | 426 (7.1) | 165 (8.7) | 79 (8.3) | 86 (9.0) | ||
| Others | 1 132 (16.0) | 163 (15.1) | 969 (16.2) | 325 (17.1) | 175 (18.4) | 150 (15.7) | ||
| Marital status/n (%) | 0.681 | 0.541 | ||||||
| Married | 4 183 (59.2) | 645 (59.8) | 3 538 (59.1) | 1 172 (61.5) | 593 (62.2) | 579 (60.8) | ||
| Others | 2 887 (40.8) | 434 (40.2) | 2 453 (40.9) | 734 (38.5) | 360 (37.8) | 374 (39.2) | ||
| Tumor histology/n (%) | 0.000 | 0.956 | ||||||
| Adenocarcinoma | 5 734 (81.1) | 815 (75.5) | 4 919 (82.1) | 1 472 (77.2) | 737 (77.3) | 735 (77.1) | ||
| Others | 1 336 (18.9) | 264 (24.5) | 1 072 (17.9) | 434 (22.8) | 216 (22.7) | 218 (22.9) | ||
| Tumor size/n (%) | 0.010 | 0.999 | ||||||
| ≤30 mm | 1 586 (22.4) | 228 (21.1) | 1 358 (22.7) | 410 (21.5) | 205 (21.5) | 205 (21.5) | ||
| >30‒50 mm | 3 312 (46.8) | 477 (44.2) | 2 835 (47.3) | 878 (46.1) | 439 (46.1) | 439 (46.1) | ||
| >50 mm | 2 172 (30.7) | 374 (34.7) | 1 798 (30.0) | 618 (32.4) | 309 (32.4) | 309 (32.4) | ||
| Histologic grade/n (%) | 0.000 | 0.970 | ||||||
| Well differentiated | 445 (6.3) | 43 (4.0) | 402 (6.7) | 70 (3.7) | 34 (3.6) | 36 (3.8) | ||
| Moderately differentiated | 5 549 (78.5) | 806 (74.7) | 4 743 (79.2) | 1 463 (76.8) | 732 (76.8) | 731 (76.7) | ||
| Poorly differentiated/undifferentiated | 1 076 (15.2) | 230 (21.3) | 846 (14.1) | 373 (19.6) | 187 (19.6) | 186 (19.5) | ||
| TNM stage/n (%) | 0.000 | 0.999 | ||||||
| Ⅰ | 677 (9.6) | 50 (4.6) | 627 (10.5) | 93 (4.9) | 46 (4.8) | 47 (4.9) | ||
| Ⅱ | 2 027 (28.7) | 144 (13.3) | 1 883 (31.4) | 288 (15.1) | 145 (15.2) | 143 (15.0) | ||
| Ⅲ | 3 509 (49.6) | 480 (44.5) | 3 029 (50.6) | 947 (49.7) | 473 (49.6) | 474 (49.7) | ||
| Ⅳ | 857 (12.1) | 405 (37.5) | 452 (7.5) | 578 (30.3) | 289 (30.3) | 289 (30.3) | ||
| Regional nodes examined/n (%) | 0.000 | 0.999 | ||||||
| <12 | 3 065 (43.4) | 411 (38.1) | 2 654 (44.3) | 734 (38.5) | 367 (38.5) | 367 (38.5) | ||
| ≥12 | 4 005 (56.6) | 668 (61.9) | 3 337 (55.7) | 1 172 (61.5) | 586 (61.5) | 586 (61.5) | ||
表2 PSM前后S组和S+RT组直肠癌患者的临床基本特征
Tab 2
| Characteristic | Before PSM | After PSM | ||||||
|---|---|---|---|---|---|---|---|---|
All (n=2 984) | S group (n=1 079) | S+RT group (n=1 905) | P value | All (n=1 478) | S group (n=739) | S+RT group (n=739) | P value | |
| Age/n (%) | 0.344 | 0.842 | ||||||
| <50 years | 569 (19.1) | 216 (20.0) | 353 (18.5) | 278 (18.8) | 137 (18.5) | 141 (19.1) | ||
| ≥50 years | 2 415 (80.9) | 863 (80.0) | 1 552 (81.5) | 1 200 (81.2) | 602 (81.5) | 598 (80.9) | ||
| Gender/n (%) | 0.473 | 0.874 | ||||||
| Male | 1 754 (58.8) | 644 (59.7) | 1 110 (58.3) | 862 (58.3) | 429 (58.1) | 433 (58.6) | ||
| Female | 1 230 (41.2) | 435 (40.3) | 795 (41.7) | 616 (41.7) | 310 (41.9) | 306 (41.4) | ||
| Race/n (%) | 0.531 | 0.231 | ||||||
| White | 2 274 (76.2) | 818 (75.8) | 1 456 (76.4) | 1 120 (75.8) | 550 (74.4) | 570 (77.1) | ||
| Black | 249 (8.3) | 98 (9.1) | 151 (7.9) | 122 (8.3) | 59 (8.0) | 63 (8.5) | ||
| Others | 461 (15.4) | 163 (15.1) | 298 (15.6) | 236 (16.0) | 130 (17.6) | 106 (14.3) | ||
| Marital status/n (%) | 0.655 | 0.264 | ||||||
| Married | 1 801 (60.4) | 645 (59.8) | 1 156 (60.7) | 892 (60.4) | 435 (58.9) | 457 (61.8) | ||
| Others | 1 183 (39.6) | 434 (40.2) | 749 (39.3) | 586 (39.6) | 304 (41.1) | 282 (38.2) | ||
| Tumor histology/n (%) | 0.012 | 0.859 | ||||||
| Adenocarcinoma | 2 171 (72.8) | 815 (75.5) | 1 356 (71.2) | 1 092 (73.9) | 544 (73.6) | 548 (74.2) | ||
| Others | 813 (27.2) | 264 (24.5) | 549 (28.8) | 386 (26.1) | 195 (26.4) | 191 (25.8) | ||
| Tumor size/n (%) | 0.000 | 0.970 | ||||||
| ≤30 mm | 792 (26.5) | 228 (21.1) | 564 (29.6) | 370 (25.0) | 185 (25.0) | 185 (25.0) | ||
| >30‒50 mm | 1 295 (43.4) | 477 (44.2) | 818 (42.9) | 670 (45.3) | 333 (45.1) | 337 (45.6) | ||
| >50 mm | 897 (30.1) | 374 (34.7) | 523 (27.5) | 438 (29.6) | 221 (29.9) | 217 (29.4) | ||
| Histologic grade/n (%) | 0.008 | 0.999 | ||||||
| Well differentiated | 154 (5.2) | 43 (4.0) | 111 (5.8) | 54 (3.7) | 27 (3.7) | 27 (3.7) | ||
| Moderately differentiated | 2 263 (75.8) | 806 (74.7) | 1 457 (76.5) | 1 154 (78.1) | 577 (78.1) | 577 (78.1) | ||
| Poorly differentiated/undifferentiated | 567 (19.0) | 230 (21.3) | 337 (17.7) | 270 (18.3) | 135 (18.3) | 135 (18.3) | ||
| TNM stage/n (%) | 0.000 | 0.999 | ||||||
| Ⅰ | 309 (10.4) | 50 (4.6) | 259 (13.6) | 82 (5.6) | 41 (5.6) | 41 (5.6) | ||
| Ⅱ | 618 (20.7) | 144 (13.3) | 474 (24.9) | 266 (18.0) | 133 (18.0) | 133 (18.0) | ||
| Ⅲ | 1 533 (51.4) | 480 (44.5) | 1 053 (55.3) | 922 (62.4) | 461 (62.4) | 461 (62.4) | ||
| Ⅳ | 524 (17.6) | 405 (37.5) | 119 (6.3) | 208 (14.1) | 104 (14.1) | 104 (14.1) | ||
| Regional nodes examined/n (%) | 0.799 | 0.999 | ||||||
| <12 | 1 147 (38.4) | 411 (38.1) | 736 (38.6) | 522 (35.3) | 261 (35.3) | 261 (35.3) | ||
| ≥12 | 1 837 (61.6) | 668 (61.9) | 1 169 (61.4) | 956 (64.7) | 478 (64.7) | 478 (64.7) | ||
2.2 3组患者比例在2005—2015年的变化趋势
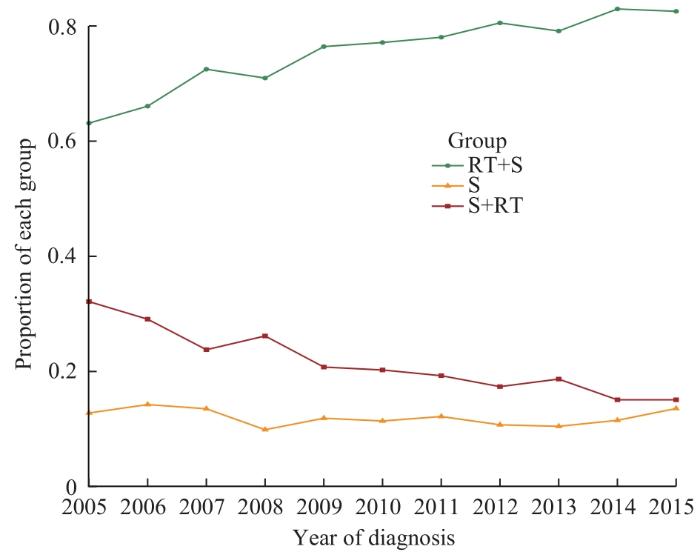
由图2可见,对于接受化疗和手术的直肠癌患者,3组患者比例随确诊年份的变化而变化。RT+S组患者的比例在2005—2015年期间上升趋势显著,而S+RT组在此期间略有下降,S组的比例基本保持平稳。
图2
图2
2005—2015年接受化疗和手术的3组直肠癌患者的比例变化趋势
Fig 2
Trends in the proportions of rectal cancer patients in three groups receiving chemotherapy from 2005 to 2015
2.3 3组患者的生存分析
2.3.1 RT+S组和S组
表3 RT+S组和S组直肠癌患者OS和CSS比较
Tab 3
| Test model | Before PSM | After PSM | ||||
|---|---|---|---|---|---|---|
RT+S group (95%CI) | S group (95%CI) | P value | RT+S group (95%CI) | S group (95%CI) | P value | |
| Log-rank | ||||||
| Median OS/month | 149 (142‒155) | 62 (55‒72) | ‒ | 104 (93‒123) | 71 (61‒86) | ‒ |
| Median CSS/month | NA | 79 (66‒107) | ‒ | NA | 107 (81‒142) | ‒ |
| RMST | ||||||
| 60 months (5 years) survival time | 52.9 (52.5‒53.3) | 44.2 (43.0‒45.3) | 0.000 | 49.8 (48.8‒50.8) | 45.4 (44.2‒46.6) | 0.000 |
| 60 months (5 years) cancer specific survival time | 54.1 (53.8‒54.5) | 45.9 (44.8‒47.0) | 0.000 | 50.8 (49.8‒51.8) | 47.3 (46.1‒48.5) | 0.000 |
| 120 months (10 years) survival time | 91.7 (90.6‒92.7) | 70.1 (67.3‒72.8) | 0.000 | 82.1 (79.4‒84.9) | 73.2 (70.2‒76.1) | 0.000 |
| 120 months (10 years) cancer specific survival time | 97.4 (96.4‒98.4) | 75.2 (72.4‒78.1) | 0.000 | 87.1 (84.4‒89.9) | 78.7 (75.7‒81.8) | 0.000 |
图3
图3
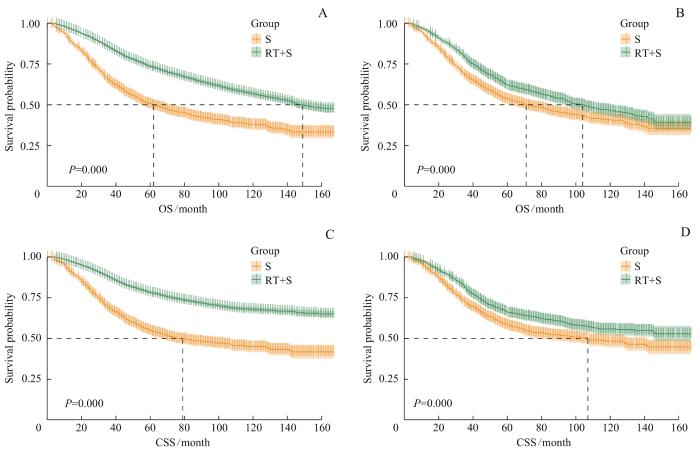
PSM前后RT+S组和S组的生存曲线
Note: A. Survival curves of OS of the RT+S group and the S group before PSM. B. Survival curves of OS of the RT+S group and the S group after PSM. C. Survival curves of CSS of the RT+S group and the S group before PSM. D. Survival curves of CSS of the RT+S group and the S group after PSM.
Fig 3
Survival curves of the RT+S group and the S group before and after PSM
经PSM后,RT+S组和S组的中位OS分别为104个月和71个月;RT+S组未达到中位CSS,S组中位CSS为107个月。图3B、D显示2组OS曲线和CSS曲线之间的差异均有统计学意义(均P=0.000)。RMST分析结果显示,5年和10年平均生存时间、平均肿瘤特异性生存时间在2组间差异均存在统计学意义(均P=0.000)。因此匹配后,RT+S组患者短期或长期的预后仍然明显好于S组。
2.3.2 S组和S+RT组
如表4所示,PSM前,S组和S+RT组的中位OS分别为62个月和142个月;S组
表4 S组和S+RT组直肠癌患者OS和CSS比较
Tab 4
| Test model | Before PSM | After PSM | ||||
|---|---|---|---|---|---|---|
S group (95%CI) | S+RT group (95%CI) | P value | S group (95%CI) | S+RT group (95%CI) | P value | |
| Log-rank | ||||||
| Median OS/month | 62 (55‒72) | 142 (129‒155) | ‒ | 106 (88‒129) | 116 (98‒132) | ‒ |
| Median CSS/month | 79 (66‒107) | NA | ‒ | NA | NA | ‒ |
| RMST | ||||||
| 60 months (5 years) survival time | 44.2 (43.0‒45.3) | 52.2 (51.5‒52.9) | 0.000 | 48.0 (46.7‒49.4) | 50.6 (49.4‒51.7) | 0.005 |
60 months (5 years) cancer specific survival time | 45.9 (44.8‒47.0) | 53.8 (53.2‒54.5) | 0.000 | 49.9 (48.7‒51.2) | 51.7 (50.6‒52.9) | 0.033 |
| 120 months (10 years) survival time | 70.1 (67.3‒72.8) | 90.3 (88.5‒92.1) | 0.000 | 80.3 (77.0‒83.6) | 84.6 (81.5‒87.6) | 0.065 |
120 months (10 years) cancer specific survival time | 75.2 (72.4‒78.1) | 96.6 (94.8‒98.3) | 0.000 | 86.3 (83.0‒89.6) | 89.6 (86.6‒92.7) | 0.147 |
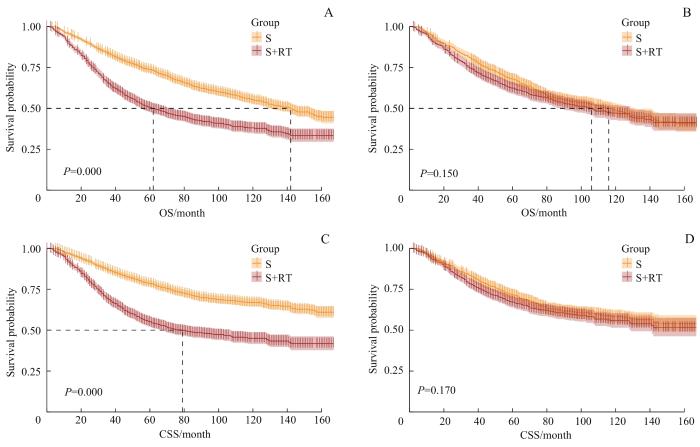
中位CSS为79个月,S+RT组在随访时间内未达到中位CSS。图4A、C显示2组OS曲线和CSS曲线之间差异均有统计学意义(均P=0.000)。RMST分析结果
图4
图4
PSM前后S组和S+RT组的生存曲线
Note: A. Survival curves of OS of the S group and the S+RT group before PSM. B. Survival curves of OS of the S group and the S+RT group after PSM. C. Survival curves of CSS of the S group and the S+RT group before PSM. D. Survival curves of CSS of the S group and the S+RT group after PSM.
Fig 4
Survival curves of the S group and the S+RT group before and after PSM
显示,5年和10年平均生存时间、平均肿瘤特异性生存时间在2组间差异均存在统计学意义(均P=0.000)。因此,匹配前S+RT组患者的短期和长期预后均明显好于S组。
经PSM后,S组和S+RT组的中位OS分别为106个月和116个月;在随访时间内,S组和S+RT组均未达到中位CSS。图4B、D显示2组OS曲线和CSS曲线之间的差异均无统计学意义(均P>0.05)。RMST分析结果显示,S组和S+RT组的5年平均生存时间和平均肿瘤特异性生存时间之间差异均有统计学意义(均P<0.05),但10年平均生存时间和平均肿瘤特异性生存时间之间的差异均无统计学意义(均P>0.05)。因此,从长远看,辅助放疗仅改善了患者短期预后,对长期预后没有显著的影响。
2.4 匹配后的预后因素分析
RT+S组和S组经PSM后,单因素Cox分析显示组别、年龄、种族、婚姻状况、肿瘤大小、肿瘤分化程度和TNM分期对OS均有显著的影响;将P<0.05的协变量纳入多因素Cox分析,其中年龄≥50岁、黑人、非结婚状态、肿瘤直径>30 mm、低分化或未分化肿瘤、分期Ⅳ期是接受手术和化疗的直肠癌患者OS的独立危险因素,而新辅助放疗则是独立保护因素。与OS不同的是,年龄并不是直肠癌患者CSS的独立危险因素。详见表5。
表5 RT+S组和S组直肠癌患者OS和CSS的单因素和多因素Cox回归分析
Tab 5
| Factor | OS | CSS | ||||||
|---|---|---|---|---|---|---|---|---|
| Univariate analysis | Multivariate analysis | Univariate analysis | Multivariate analysis | |||||
| HR (95%CI) | P value | HR (95%CI) | P value | HR (95%CI) | P value | HR (95%CI) | P value | |
| Group | ||||||||
| S | Reference | Reference | Reference | Reference | ||||
| RT+S | 0.77 (0.68‒0.88) | 0.000 | 0.73 (0.64‒0.83) | 0.000 | 0.75 (0.65‒0.87) | 0.000 | 0.71 (0.62‒0.82) | 0.000 |
| Age | ||||||||
| <50 years | Reference | Reference | Reference | |||||
| ≥50 years | 1.37 (1.15‒1.63) | 0.000 | 1.47 (1.23‒1.75) | 0.000 | 1.14 (0.95‒1.37) | 0.144 | ||
| Gender | ||||||||
| Male | Reference | Reference | ||||||
| Female | 0.90 (0.79‒1.02) | 0.107 | 0.89 (0.77‒1.03) | 0.120 | ||||
| Race | ||||||||
| White | Reference | Reference | Reference | Reference | ||||
| Black | 1.32 (1.07‒1.62) | 0.010 | 1.27 (1.03‒1.57) | 0.025 | 1.43 (1.15‒1.79) | 0.002 | 1.38 (1.10‒1.73) | 0.005 |
| Others | 0.96 (0.80‒1.14) | 0.623 | 1.03 (0.86‒1.23) | 0.733 | 0.96 (0.79‒1.16) | 0.659 | 1.02 (0.84‒1.24) | 0.858 |
| Marital status | ||||||||
| Married | Reference | Reference | Reference | Reference | ||||
| Others | 1.31 (1.15‒1.49) | 0.000 | 1.27 (1.11‒1.44) | 0.000 | 1.30 (1.13‒1.50) | 0.000 | 1.27 (1.10‒1.46) | 0.001 |
| Tumor histology | ||||||||
| Adenocarcinoma | Reference | Reference | ||||||
| Others | 0.96 (0.82‒1.12) | 0.598 | 0.95 (0.80‒1.13) | 0.572 | ||||
| Tumor size | ||||||||
| ≤30 mm | Reference | Reference | Reference | Reference | ||||
| >30‒50 mm | 1.54 (1.29‒1.85) | 0.000 | 1.30 (1.08‒1.57) | 0.007 | 1.59 (1.29‒1.95) | 0.000 | 1.26 (1.02‒1.56) | 0.035 |
| >50 mm | 1.96 (1.62‒2.37) | 0.000 | 1.60 (1.32‒1.95) | 0.000 | 2.13 (1.72‒2.63) | 0.000 | 1.56 (1.26‒1.95) | 0.000 |
| Histologic grade | ||||||||
| Well differentiated | Reference | Reference | Reference | Reference | ||||
| Moderately differentiated | 1.18 (0.81‒1.72) | 0.388 | 1.04 (0.71‒1.52) | 0.834 | 1.26 (0.82‒1.95) | 0.292 | 1.06 (0.68‒1.64) | 0.802 |
| Poorly differentiated/ undifferentiated | 2.03 (1.37‒3.00) | 0.000 | 1.81 (1.22‒2.69) | 0.003 | 2.34 (1.50‒3.67) | 0.000 | 1.98 (1.26‒3.11) | 0.003 |
| TNM stage | ||||||||
| Ⅰ | Reference | Reference | Reference | Reference | ||||
| Ⅱ | 0.86 (0.59‒1.26) | 0.443 | 0.73 (0.49‒1.08) | 0.112 | 0.96 (0.60‒1.54) | 0.881 | 0.85 (0.53‒1.37) | 0.502 |
| Ⅲ | 1.24 (0.89‒1.74) | 0.209 | 1.03 (0.73‒1.46) | 0.852 | 1.41 (0.93‒2.14) | 0.107 | 1.20 (0.79‒1.83) | 0.398 |
| Ⅳ | 3.70 (2.64‒5.19) | 0.000 | 3.05 (2.16‒4.32) | 0.000 | 4.91 (3.25‒7.43) | 0.000 | 4.17 (2.73‒6.36) | 0.000 |
| Regional nodes examined | ||||||||
| <12 | Reference | Reference | ||||||
| ≥12 | 0.90 (0.79‒1.02) | 0.099 | 0.96 (0.83‒1.10) | 0.539 | ||||
S组和S+RT组经PSM后,单因素Cox回归分析显示年龄、种族、婚姻状况、肿瘤大小、肿瘤分化程度和TNM分期对OS均有显著的影响,而种族对CSS并无影响;将P<0.05的协变量纳入多因素Cox分析,其中年龄≥50岁、非结婚状态、肿瘤直径>30 mm以及TNM分期Ⅳ期是接受手术和化疗的直肠癌患者OS和CSS的独立危险因素,黑人仅是OS的独立危险因素。不同于新辅助放疗,辅助放疗并不是直肠癌患者OS和CSS的保护因素。详见表6。
表6 S组和S+RT组直肠癌患者OS和CSS的单因素和多因素Cox回归分析
Tab 6
| Factor | OS | CSS | ||||||
|---|---|---|---|---|---|---|---|---|
| Univariate analysis | Multivariate analysis | Univariate analysis | Multivariate analysis | |||||
| HR (95%CI) | P value | HR (95%CI) | P value | HR (95%CI) | P value | HR (95%CI) | P value | |
| Group | ||||||||
| S | Reference | Reference | ||||||
| S+RT | 1.12 (0.96‒1.30) | 0.150 | 1.13 (0.95‒1.34) | 0.166 | ||||
| Age | ||||||||
| <50 years | Reference | Reference | Reference | Reference | ||||
| ≥50 years | 1.55 (1.25‒1.92) | 0.000 | 1.82 (1.46‒2.26) | 0.000 | 1.30 (1.04‒1.64) | 0.024 | 1.81 (1.45‒2.24) | 0.000 |
| Gender | ||||||||
| Male | Reference | Reference | ||||||
| Female | 0.98 (0.84‒1.14) | 0.750 | 1.00 (0.84‒1.19) | 0.992 | ||||
| Race | ||||||||
| White | Reference | Reference | Reference | |||||
| Black | 1.30 (1.01‒1.67) | 0.045 | 1.35 (1.04‒1.75) | 0.024 | 1.25 (0.94‒1.67) | 0.125 | ||
| Others | 0.81 (0.65‒1.01) | 0.065 | 0.99 (0.79‒1.24) | 0.914 | 0.81 (0.63‒1.04) | 0.101 | ||
| Marital status | ||||||||
| Married | Reference | Reference | Reference | Reference | ||||
| Others | 1.43 (1.23‒1.67) | 0.000 | 1.35 (1.16‒1.58) | 0.000 | 1.42 (1.19‒1.68) | 0.000 | 1.39 (1.19‒1.62) | 0.000 |
| Tumor histology | ||||||||
| Adenocarcinoma | Reference | Reference | ||||||
| Others | 1.07 (0.90‒1.27) | 0.426 | 1.14 (0.94‒1.38) | 0.185 | ||||
| Tumor size | ||||||||
| ≤30 mm | Reference | Reference | Reference | Reference | ||||
| >30‒50 mm | 1.78 (1.44‒2.21) | 0.000 | 1.64 (1.32‒2.05) | 0.000 | 1.90 (1.48‒2.43) | 0.000 | 1.64 (1.32‒2.05) | 0.000 |
| >50 mm | 2.15 (1.72‒2.70) | 0.000 | 2.01 (1.59‒2.54) | 0.000 | 2.41 (1.86‒3.12) | 0.000 | 2.02 (1.60‒2.56) | 0.000 |
| Histologic grade | ||||||||
| Well differentiated | Reference | Reference | Reference | Reference | ||||
| Moderately differentiated | 0.94 (0.62‒1.44) | 0.790 | 0.88 (0.58‒1.34) | 0.549 | 1.08 (0.65‒1.78) | 0.771 | 0.89 (0.58‒1.35) | 0.574 |
| Poorly differentiated/ undifferentiated | 1.58 (1.02‒2.45) | 0.041 | 1.38 (0.89‒2.16) | 0.150 | 1.86 (1.11‒3.13) | 0.019 | 1.40 (0.90‒2.17) | 0.139 |
| TNM stage | ||||||||
| Ⅰ | Reference | Reference | Reference | Reference | ||||
| Ⅱ | 1.11 (0.72‒1.70) | 0.635 | 0.78 (0.50‒1.22) | 0.280 | 1.48 (0.86‒2.55) | 0.160 | 0.76 (0.49‒1.19) | 0.232 |
| Ⅲ | 1.45 (0.98‒2.12) | 0.060 | 1.10 (0.74‒1.64) | 0.634 | 1.88 (1.14‒3.12) | 0.014 | 1.07 (0.72‒1.58) | 0.753 |
| Ⅳ | 4.67 (3.13‒6.98) | 0.000 | 3.54 (2.33‒5.38) | 0.000 | 7.30 (4.36‒12.23) | 0.000 | 3.39 (2.24‒5.15) | 0.000 |
| Regional nodes examined | ||||||||
| <12 | Reference | Reference | ||||||
| ≥12 | 0.89 (0.76‒1.04) | 0.137 | 0.99 (0.83‒1.18) | 0.894 | ||||
2.5 亚组分析
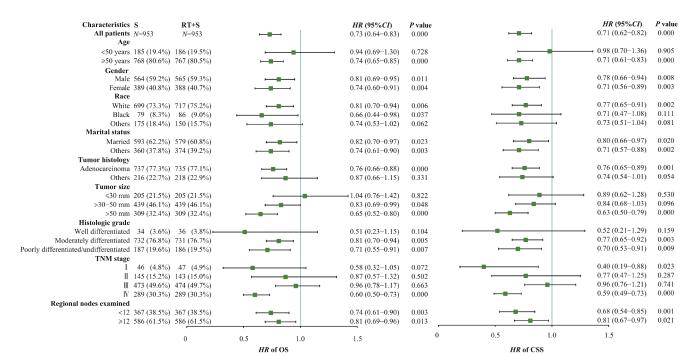
图5
图5
RT+S组和S组OS和CSS亚组分析
Fig 5
Subgroup analysis of OS and CSS between the RT+S group and the S group
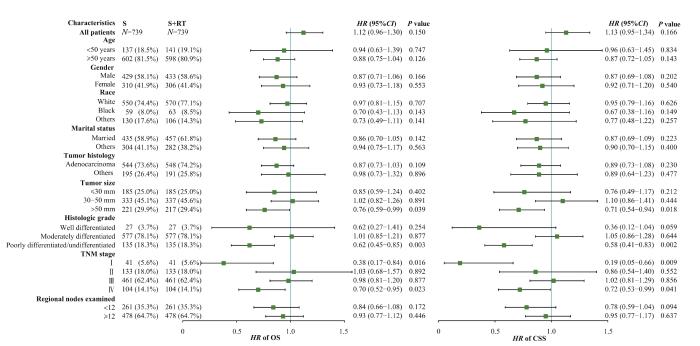
图6
图6
S组和S+RT组OS和CSS亚组分析
Fig 6
Subgroup analysis of OS and CSS between the S group and the S+RT group
3 讨论
放疗是多种恶性实体肿瘤包括结直肠癌的局部控制和治疗的手段之一,但是对直肠癌的放疗仍然在当今临床上存在争议。对接受化疗和手术的直肠癌患者是否联合放疗、放疗的顺序,以及哪部分患者可以从放疗中真正获益等问题,都是目前临床精准化治疗面临的挑战。
我们知道,log-rank检验是对总体生存情况做分析,但并不能直观地比较如5年或10年内的预后情况[9],且log-rank检验的前提要求是比例风险(proportional hazard,PH)假设成立;相对而言,RMST法不依赖于PH假设,其结果在比例风险和非比例风险的生存模型中均表现稳健[10]。因此,本研究引入了RMST的方法,其主要含义是如果时间限制为12个月,则RMST衡量的是12个月内存活的平均月数[11]。本研究发现,RMST结果显示新辅助放疗延长了患者5年和10年内的平均生存时间,这与log-rank检验结果一致。因此,我们认为行化疗和手术切除的直肠癌患者,新辅助放疗可以带来生存效益,尽管不是在所有的人群中。而本研究中,辅助放疗仅仅改善了患者的5年预后,对于长期预后如10年,并没有带来明显的生存效益。RMST的结果和log-rank结果在长期预后方面是一致的。同时,大量临床试验和meta分析研究[12-13]表明,新辅助放疗比辅助放疗对肿瘤有更好的局部控制效果,并有可能改善OS。从本研究的结果中也能看到,2005—2015年间接受新辅助放疗的患者比例逐渐上升,而接受辅助放疗的比例则不断下降。
尽管新辅助放疗是行化疗和手术的直肠癌患者OS和CSS的预后独立保护因素,但对所有患者采用新辅助放疗是不合理的。为了确定从放疗中获益更多的亚组,并避免对生存获益有限的患者进行过度治疗,我们进行了亚组分析。从OS的结果来看,肿瘤直径较小、分化良好以及TNM分期较早的患者可能并不需要新辅助放疗。有研究[14]显示原发肿瘤的转移和术后不良反应是新辅助放化疗不能改善OS的主要原因。因此,我们推测对于肿瘤直径较小、分化良好以及TNM分期早期的患者,放疗的不良反应可能抵消新辅助放疗带来的生存益处。而对于已发生转移的直肠癌,即主要是Ⅳ期的直肠癌,各治疗指南差异较大。本研究结果表明,Ⅳ期的直肠癌在手术和化疗的基础上,无论新辅助放疗还是辅助放疗,均是OS和CSS的独立保护因素。LOGAN等[15]的研究发现,对于Ⅳ期CRC患者,尤其是直肠癌患者,接受手术联合放疗相较于单纯手术或放疗可延长患者的生存期。同样,meta分析研究[16]表明在可切除的Ⅳ期患者中观察到短程放疗和巩固化疗后的良好结果。
对于早期的直肠癌,治疗方案里放化疗并没有被推荐。我们的研究结果显示,对于接受化疗和手术的Ⅰ期直肠癌患者,无论新辅助放疗还是辅助放疗均可带来一定的CSS效益。临床试验[17]表明,对于不可切除的早期直肠癌,应用短程放疗可以较好地实现器官保存和生活质量的改善;但是也有研究[18]显示,早期直肠癌患者接受新辅助放化疗并不能提高生存效益。由于Ⅰ期直肠癌病例相对少见且预后良好,病例累积过慢,其临床随机试验很难观察到终点;因此,对Ⅰ期直肠癌患者是否应用放疗仍然是个有争议性的问题。对于Ⅱ期和Ⅲ期的直肠癌患者,无论是新辅助放疗还是辅助放疗,均不能获得生存效益。然而,MCLAUGHLIN等[19]对SEER数据库的21 789名病理性T4结肠癌患者开展了回顾性研究,所有患者均接受了手术,其中1 001名患者接受了辅助放疗;结果表明,与未接受辅助放疗的患者相比,术后接受辅助放疗的T4结肠癌患者死于结肠癌的风险降低,并且显示出显著的CSS获益,但生存获益有限,癌症死亡相对风险仅降低11.51%。另一项利用SEER数据的研究[20]表明,对于病理TNM分期T4N2M0结肠癌患者,与未接受放疗的患者相比,增加放疗可以带来生存获益。我们考虑这部分差异首先在于PSM虽然平衡了混杂因素的影响,但是在匹配的同时有部分脱落,因此可能造成结果一定的偏倚。其次,本研究纳入的对象是已经行化疗和手术的患者,在此基础上比较新辅助放疗和辅助放疗的效果,不同于以往研究仅仅纳入手术和放疗的人群。最后,考虑到不同TNM分期采取的放化疗方案之间同样存在差异。
然而,我们的研究存在一些不可避免的局限性。首先,我们的研究没有包含化疗顺序的信息。尽管我们纳入的所有患者均采取了化疗,但是新辅助化疗和辅助化疗在我们的组别中可能存在一定的偏倚。其次,不同化疗药物的使用也是影响长期预后的重要因素之一。最后,我们未对放疗的方式和剂量进行区分,这也是影响预后的重要混杂因素。
总之,我们的研究表明,针对行化疗和手术的直肠癌患者,新辅助放疗可以显著改善直肠癌患者的OS,但是在早发性、肿瘤直径≤30 mm以及TNM分期早期的患者中,新辅助放疗可能并不合适。而辅助放疗在整体直肠癌患者中未见预后的保护作用,但是低分化、肿瘤直径>50 mm以及TNM晚期的患者可能从辅助放疗中获益。由于SEER数据库是一个大型的、基于人群的癌症登记数据集,其中包含患者级别的数据,因此与单中心的研究相比,结果可以更好地外推到一般人群中。我们的研究结果可为临床个性化的治疗提供一定的借鉴,然而仍然需要多中心、大样本量的临床试验进一步加以验证。
作者贡献声明
王安君负责数据库检索、筛选、统计和论文写作。刘宁宁负责论文的审查及修改。所有作者均阅读并同意了最终稿件的提交。
WANG Anjun searched and screened the database, researched data for the article and wrote the manuscript. LIU Ningning reviewed and edited the manuscript before submission. Both the authors have read the last version of paper and consented for submission.
利益冲突声明
所有作者声明不存在利益冲突。
Both authors disclose no relevant conflict of interest.
参考文献


