上海交通大学学报(医学版) ›› 2025, Vol. 45 ›› Issue (3): 324-334.doi: 10.3969/j.issn.1674-8115.2025.03.009
陈佳莹1,2( ), 褚以忞1,2, 彭海霞1,2()
收稿日期:2024-05-29
接受日期:2024-09-06
出版日期:2025-03-28
发布日期:2025-03-28
通讯作者:
彭海霞,主任医师,博士;电子信箱:phx1101@shtrhospital.com。作者简介:陈佳莹(1996—),女,硕士生;电子信箱:cjy811976991@163.com。
基金资助:
CHEN Jiaying1,2(), CHU Yimin1,2, PENG Haixia1,2()
Received:2024-05-29
Accepted:2024-09-06
Online:2025-03-28
Published:2025-03-28
Contact:
PENG Haixia, E-mail: phx1101@shtrhospital.com.Supported by:摘要:
目的·探究影响结直肠癌(colorectal cancer,CRC)患者无进展生存时间(progression-free survival,PFS)的风险因素,建立相应的预后预测模型。方法·采用回顾性队列研究,纳入上海交通大学医学院附属同仁医院的533例经手术切除并病理确诊为结直肠腺癌的患者,按照7∶3的比例随机拆分为训练集(373例)和验证集(160例)。采用单因素和多因素Cox比例风险回归模型分析纳入的临床资料,分析CRC患者术后PFS的独立影响因素,并建立关于结直肠癌的临床预后预测模型。使用一致性指数(concordance index,C-index)、受试者操作特征曲线(receiver operator characteristic curve,ROC曲线)下面积(area under the curve,AUC)、校准曲线、生存曲线评估预测模型的区分度和校准度。进一步通过多因素Cox回归分析确定不同年龄、性别以及美国癌症联合委员会(American Joint Committee on Cancer,AJCC)癌症分期人群预后的独立影响因素。结果·多因素Cox回归分析发现,年龄、吸烟史、肝脏疾病、糖类抗原724(carbohydrate antigen 724,CA724)、AJCC分期是PFS的独立影响因素。在训练集中,该PFS模型的C-index为0.69,3年和5年的AUC分别为0.744和0.713。在验证集中,该PFS模型的C-index为0.64,3年和5年的AUC分别为0.706和0.683。校准曲线图可见训练集和验证集的PFS预测校准曲线均趋近标准曲线。生存曲线提示低风险组患者的进展率显著低于高风险组。分层分析结果表明:对年龄≥65岁患者,年龄、肝脏疾病、AJCC临床分期是术后PFS的独立影响因素;对年龄<65岁的患者,吸烟史、CA724、AJCC临床分期是术后PFS的独立影响因素。对男性患者,年龄、吸烟史、CA724、AJCC临床分期是术后PFS的独立影响因素;对女性患者,肝脏疾病、CA724、AJCC临床分期是术后PFS的独立影响因素。对AJCC分期Ⅰ~Ⅱ期的患者,年龄和吸烟史是术后PFS的独立影响因素;对AJCC分期Ⅲ~Ⅳ期的患者,年龄、肝脏疾病和CA724是术后PFS的独立影响因素。结论·针对CRC患者建立的PFS预后模型具有较好区分能力,为临床医师提供了有效的风险评估工具。
中图分类号:
陈佳莹, 褚以忞, 彭海霞. 结直肠癌无进展生存时间预测模型及影响因素研究[J]. 上海交通大学学报(医学版), 2025, 45(3): 324-334.
CHEN Jiaying, CHU Yimin, PENG Haixia. Study on prediction model and influencing factors of progression-free survival in colorectal cancer[J]. Journal of Shanghai Jiao Tong University (Medical Science), 2025, 45(3): 324-334.
| Item | Total population (n=533) | Training set (n=373) | Validation set (n=160) | P value | |
|---|---|---|---|---|---|
| Outcome/n(%) | 0.573 | ||||
| Survival | 412 (77.3) | 291 (78.0) | 121 (75.6) | ||
| Death | 121 (22.7) | 82 (22.0) | 39 (24.4) | ||
| Progression/n(%) | 0.491 | ||||
| Yes | 191 (35.8) | 130 (34.9) | 61 (38.1) | ||
| No | 342 (64.2) | 243 (65.1) | 99 (61.9) | ||
| Gender/n(%) | 0.528 | ||||
| Male | 324 (60.8) | 230 (61.7) | 94 (58.8) | ||
| Female | 209 (39.2) | 143 (38.3) | 66 (41.3) | ||
| Age/year | 68.00 (62.00, 77.00) | 68.00 (62.00, 77.00) | 67.00 (62.00, 76.00) | 0.707 | |
| Family history of CRC/n(%) | >0.999 | ||||
| No | 528 (99.1) | 369 (98.9) | 159 (99.4) | ||
| Yes | 5 (0.9) | 4 (1.1) | 1 (0.6) | ||
| Smoking history/n(%) | 0.182 | ||||
| No | 502 (94.2) | 348 (93.3) | 154 (96.3) | ||
| Yes | 31 (5.8) | 25 (6.7) | 6 (3.8) | ||
| Alcohol consumption history/n(%) | 0.639 | ||||
| No | 528 (99.1) | 370 (99.2) | 158 (98.8) | ||
| Yes | 5 (0.9) | 3 (0.8) | 2 (1.3) | ||
| Hypertension/n(%) | 0.275 | ||||
| No | 294 (55.2) | 200 (53.6) | 94 (58.8) | ||
| Yes | 239 (44.8) | 173 (46.4) | 66 (41.3) | ||
| Diabetes/n(%) | 0.304 | ||||
| No | 437 (82.0) | 310 (83.1) | 127 (79.4) | ||
| Yes | 96 (18.0) | 63 (16.9) | 33 (20.6) | ||
| Cardiovascular disease/n(%) | 0.024 | ||||
| No | 384 (72.0) | 258 (69.2) | 126 (78.8) | ||
| Yes | 149 (28.0) | 115 (30.8) | 34 (21.3) | ||
| Kidney disease/n(%) | 0.018 | ||||
| No | 509 (95.5) | 351 (94.1) | 158 (98.8) | ||
| Yes | 24 (4.5) | 22 (5.9) | 2 (1.3) | ||
| Liver disease/n(%) | 0.507 | ||||
| No | 511 (95.9) | 359 (96.2) | 152 (95.0) | ||
| Yes | 22 (4.1) | 14 (3.8) | 8 (5.0) | ||
| Inflammatory bowel disease/n(%) | >0.999 | ||||
| No | 532 (99.8) | 372 (99.7) | 160 (100.0) | ||
| Yes | 1 (0.2) | 1 (0.3) | 0 (0) | ||
| Hyperlipidemia/n(%) | 0.639 | ||||
| No | 478 (89.7) | 333 (89.3) | 145 (90.6) | ||
| Yes | 55 (10.3) | 40 (10.7) | 15 (9.4) | ||
| Neutrophil percentage/% | 67.61±9.91 | 66.82±10.07 | 69.45±9.30 | 0.004 | |
| Lymphocyte percentage/% | 23.01±8.53 | 23.61±8.44 | 21.61±8.59 | 0.014 | |
| Absolute neutrophil count/n | 4.15 (3.11, 5.37) | 4.01 (3.01, 5.24) | 4.33 (3.59, 5.60) | 0.003 | |
| Absolute lymphocyte count/n | 1.40 (1.10, 1.80) | 1.40 (1.10, 1.80) | 1.40 (1.04, 1.70) | 0.263 | |
| Monocyte percentage/% | 6.60 (5.20, 8.20) | 1.40 (1.10, 1.80) | 6.50 (5.20, 7.98) | 0.298 | |
| NLR | 3.00 (2.14, 4.42) | 2.90 (2.07, 4.05) | 3.34 (2.41, 4.95) | 0.002 | |
| PLR | 600.00 (438.5, 823.49) | 584.76 (437.96, 834.08) | 626.19 (438.76, 786.53) | 0.977 | |
| LMR | 3.41 (2.44, 4.58) | 3.45 (2.49, 4.57) | 3.33 (2.21, 4.66) | 0.338 | |
| Hemoglobin/(g·L-1) | 119.00 (96.00, 134.00) | 120.00 (98.00, 134.00) | 118.00 (93.00, 132.00) | 0.188 | |
| Platelet/(×109·L-1) | 245.00 (198.00, 308.00) | 245.00 (196.00, 304.00) | 245.50 (200.50, 317.50) | 0.609 | |
| Fasting blood glucose/(mmol·L-1) | 5.80 (5.10, 7.30) | 5.70 (5.00, 7.20) | 6.00 (5.40, 7.60) | 0.005 | |
| Creatinine/(μmol·L-1) | 69.10 (59.70, 80.00) | 69.30 (60.00, 79.60) | 68.90 (58.35, 81.12) | 0.571 | |
| GFR/[mL·(min·1.73 m2)-1] | 116.69 (99.34, 137.51) | 118.80 (99.55, 136.77) | 118.31 (99.23, 139.27) | 0.646 | |
| Urea/(mmol·L-1) | 5.00 (4.07, 6.15) | 5.00 (4.07, 6.10) | 5.04 (4.08, 6.15) | 0.910 | |
| Total protein/(g·L-1) | 70.00 (64.70, 74.90) | 69.90 (64.60, 74.50) | 71.00 (64.85, 75.32) | 0.226 | |
| Albumin/(g·L-1) | 40.30 (36.90, 43.30) | 40.40 (37.00, 43.00) | 40.15 (36.22, 43.62) | 0.665 | |
| Total bilirubin/(μmol·L-1) | 10.10 (7.40, 14.10) | 10.10 (7.30, 14.10) | 10.05 (7.40, 13.72) | 0.678 | |
| GPT/(U·L-1) | 20.00 (13.00, 29.00) | 20.00 (13.00, 29.00) | 21.00 (13.00, 30.00) | 0.539 | |
| GGT/(U·L-1) | 19.00 (14.00, 28.00) | 19.00 (14.00, 29.00) | 18.00 (13.00, 26.00) | 0.135 | |
| GOT/(U·L-1) | 21.00 (17.00, 25.00) | 21.00 (17.00, 25.00) | 20.00 (16.75, 26.00) | 0.987 | |
| AFP/(ng·L-1) | 2.37 (1.56, 3.53) | 2.36 (1.59, 3.50) | 2.40 (1.52, 3.57) | 0.796 | |
| CEA/(ng·L-1) | 3.43 (1.67, 8.98) | 3.43 (1.63, 9.05) | 3.38 (1.76, 8.39) | 0.812 | |
| CA199/(U·mL-1) | 14.08 (8.47, 28.17) | 13.39 (8.19, 27.76) | 16.41 (9.31, 28.47) | 0.320 | |
| CA125/(U·mL-1) | 11.65 (8.37, 18.47) | 11.29 (7.90, 17.24) | 13.36 (9.24, 24.01) | 0.004 | |
| CA153/(U·mL-1) | 7.20 (4.82, 10.61) | 7.09 (4.80, 10.86) | 7.70 (4.91, 10.59) | 0.998 | |
| CA724/(U·mL-1) | 2.42 (1.50, 5.74) | 2.21 (1.50, 5.20) | 3.14 (1.50, 6.69) | 0.029 | |
| D-D/(mg·L-1) | 0.47 (0.25, 0.98) | 0.45 (0.25, 0.95) | 0.57 (0.27, 1.14) | 0.100 | |
| INR | 0.99 (0.94, 1.04) | 0.99 (0.94, 1.04) | 0.98 (0.92, 1.05) | 0.298 | |
| C-reactive protein/(mg·L-1) | 5.90 (1.80, 19.28) | 5.90 (1.80, 19.28) | 5.95 (1.64, 19.66) | 0.879 | |
| AJCC clinical stage/n(%) | 0.577 | ||||
| StageⅠ‒Ⅱ | 263 (49.3) | 187 (50.1) | 76 (47.5) | ||
| Stage Ⅲ‒Ⅳ | 270 (50.7) | 186 (49.9) | 84 (52.5) | ||
| LCR | 0.24 (0.07, 0.90) | 0.24 (0.07, 0.91) | 0.24 (0.06, 0.90) | 0.775 | |
| CAR | 154.88 (42.62, 493.89) | 154.93 (42.36, 502.48) | 152.82 (43.00, 492.59) | 0.830 | |
表1 训练集与验证集的人群基线特征
Tab 1 Baseline characteristics of the population in the training and validation sets
| Item | Total population (n=533) | Training set (n=373) | Validation set (n=160) | P value | |
|---|---|---|---|---|---|
| Outcome/n(%) | 0.573 | ||||
| Survival | 412 (77.3) | 291 (78.0) | 121 (75.6) | ||
| Death | 121 (22.7) | 82 (22.0) | 39 (24.4) | ||
| Progression/n(%) | 0.491 | ||||
| Yes | 191 (35.8) | 130 (34.9) | 61 (38.1) | ||
| No | 342 (64.2) | 243 (65.1) | 99 (61.9) | ||
| Gender/n(%) | 0.528 | ||||
| Male | 324 (60.8) | 230 (61.7) | 94 (58.8) | ||
| Female | 209 (39.2) | 143 (38.3) | 66 (41.3) | ||
| Age/year | 68.00 (62.00, 77.00) | 68.00 (62.00, 77.00) | 67.00 (62.00, 76.00) | 0.707 | |
| Family history of CRC/n(%) | >0.999 | ||||
| No | 528 (99.1) | 369 (98.9) | 159 (99.4) | ||
| Yes | 5 (0.9) | 4 (1.1) | 1 (0.6) | ||
| Smoking history/n(%) | 0.182 | ||||
| No | 502 (94.2) | 348 (93.3) | 154 (96.3) | ||
| Yes | 31 (5.8) | 25 (6.7) | 6 (3.8) | ||
| Alcohol consumption history/n(%) | 0.639 | ||||
| No | 528 (99.1) | 370 (99.2) | 158 (98.8) | ||
| Yes | 5 (0.9) | 3 (0.8) | 2 (1.3) | ||
| Hypertension/n(%) | 0.275 | ||||
| No | 294 (55.2) | 200 (53.6) | 94 (58.8) | ||
| Yes | 239 (44.8) | 173 (46.4) | 66 (41.3) | ||
| Diabetes/n(%) | 0.304 | ||||
| No | 437 (82.0) | 310 (83.1) | 127 (79.4) | ||
| Yes | 96 (18.0) | 63 (16.9) | 33 (20.6) | ||
| Cardiovascular disease/n(%) | 0.024 | ||||
| No | 384 (72.0) | 258 (69.2) | 126 (78.8) | ||
| Yes | 149 (28.0) | 115 (30.8) | 34 (21.3) | ||
| Kidney disease/n(%) | 0.018 | ||||
| No | 509 (95.5) | 351 (94.1) | 158 (98.8) | ||
| Yes | 24 (4.5) | 22 (5.9) | 2 (1.3) | ||
| Liver disease/n(%) | 0.507 | ||||
| No | 511 (95.9) | 359 (96.2) | 152 (95.0) | ||
| Yes | 22 (4.1) | 14 (3.8) | 8 (5.0) | ||
| Inflammatory bowel disease/n(%) | >0.999 | ||||
| No | 532 (99.8) | 372 (99.7) | 160 (100.0) | ||
| Yes | 1 (0.2) | 1 (0.3) | 0 (0) | ||
| Hyperlipidemia/n(%) | 0.639 | ||||
| No | 478 (89.7) | 333 (89.3) | 145 (90.6) | ||
| Yes | 55 (10.3) | 40 (10.7) | 15 (9.4) | ||
| Neutrophil percentage/% | 67.61±9.91 | 66.82±10.07 | 69.45±9.30 | 0.004 | |
| Lymphocyte percentage/% | 23.01±8.53 | 23.61±8.44 | 21.61±8.59 | 0.014 | |
| Absolute neutrophil count/n | 4.15 (3.11, 5.37) | 4.01 (3.01, 5.24) | 4.33 (3.59, 5.60) | 0.003 | |
| Absolute lymphocyte count/n | 1.40 (1.10, 1.80) | 1.40 (1.10, 1.80) | 1.40 (1.04, 1.70) | 0.263 | |
| Monocyte percentage/% | 6.60 (5.20, 8.20) | 1.40 (1.10, 1.80) | 6.50 (5.20, 7.98) | 0.298 | |
| NLR | 3.00 (2.14, 4.42) | 2.90 (2.07, 4.05) | 3.34 (2.41, 4.95) | 0.002 | |
| PLR | 600.00 (438.5, 823.49) | 584.76 (437.96, 834.08) | 626.19 (438.76, 786.53) | 0.977 | |
| LMR | 3.41 (2.44, 4.58) | 3.45 (2.49, 4.57) | 3.33 (2.21, 4.66) | 0.338 | |
| Hemoglobin/(g·L-1) | 119.00 (96.00, 134.00) | 120.00 (98.00, 134.00) | 118.00 (93.00, 132.00) | 0.188 | |
| Platelet/(×109·L-1) | 245.00 (198.00, 308.00) | 245.00 (196.00, 304.00) | 245.50 (200.50, 317.50) | 0.609 | |
| Fasting blood glucose/(mmol·L-1) | 5.80 (5.10, 7.30) | 5.70 (5.00, 7.20) | 6.00 (5.40, 7.60) | 0.005 | |
| Creatinine/(μmol·L-1) | 69.10 (59.70, 80.00) | 69.30 (60.00, 79.60) | 68.90 (58.35, 81.12) | 0.571 | |
| GFR/[mL·(min·1.73 m2)-1] | 116.69 (99.34, 137.51) | 118.80 (99.55, 136.77) | 118.31 (99.23, 139.27) | 0.646 | |
| Urea/(mmol·L-1) | 5.00 (4.07, 6.15) | 5.00 (4.07, 6.10) | 5.04 (4.08, 6.15) | 0.910 | |
| Total protein/(g·L-1) | 70.00 (64.70, 74.90) | 69.90 (64.60, 74.50) | 71.00 (64.85, 75.32) | 0.226 | |
| Albumin/(g·L-1) | 40.30 (36.90, 43.30) | 40.40 (37.00, 43.00) | 40.15 (36.22, 43.62) | 0.665 | |
| Total bilirubin/(μmol·L-1) | 10.10 (7.40, 14.10) | 10.10 (7.30, 14.10) | 10.05 (7.40, 13.72) | 0.678 | |
| GPT/(U·L-1) | 20.00 (13.00, 29.00) | 20.00 (13.00, 29.00) | 21.00 (13.00, 30.00) | 0.539 | |
| GGT/(U·L-1) | 19.00 (14.00, 28.00) | 19.00 (14.00, 29.00) | 18.00 (13.00, 26.00) | 0.135 | |
| GOT/(U·L-1) | 21.00 (17.00, 25.00) | 21.00 (17.00, 25.00) | 20.00 (16.75, 26.00) | 0.987 | |
| AFP/(ng·L-1) | 2.37 (1.56, 3.53) | 2.36 (1.59, 3.50) | 2.40 (1.52, 3.57) | 0.796 | |
| CEA/(ng·L-1) | 3.43 (1.67, 8.98) | 3.43 (1.63, 9.05) | 3.38 (1.76, 8.39) | 0.812 | |
| CA199/(U·mL-1) | 14.08 (8.47, 28.17) | 13.39 (8.19, 27.76) | 16.41 (9.31, 28.47) | 0.320 | |
| CA125/(U·mL-1) | 11.65 (8.37, 18.47) | 11.29 (7.90, 17.24) | 13.36 (9.24, 24.01) | 0.004 | |
| CA153/(U·mL-1) | 7.20 (4.82, 10.61) | 7.09 (4.80, 10.86) | 7.70 (4.91, 10.59) | 0.998 | |
| CA724/(U·mL-1) | 2.42 (1.50, 5.74) | 2.21 (1.50, 5.20) | 3.14 (1.50, 6.69) | 0.029 | |
| D-D/(mg·L-1) | 0.47 (0.25, 0.98) | 0.45 (0.25, 0.95) | 0.57 (0.27, 1.14) | 0.100 | |
| INR | 0.99 (0.94, 1.04) | 0.99 (0.94, 1.04) | 0.98 (0.92, 1.05) | 0.298 | |
| C-reactive protein/(mg·L-1) | 5.90 (1.80, 19.28) | 5.90 (1.80, 19.28) | 5.95 (1.64, 19.66) | 0.879 | |
| AJCC clinical stage/n(%) | 0.577 | ||||
| StageⅠ‒Ⅱ | 263 (49.3) | 187 (50.1) | 76 (47.5) | ||
| Stage Ⅲ‒Ⅳ | 270 (50.7) | 186 (49.9) | 84 (52.5) | ||
| LCR | 0.24 (0.07, 0.90) | 0.24 (0.07, 0.91) | 0.24 (0.06, 0.90) | 0.775 | |
| CAR | 154.88 (42.62, 493.89) | 154.93 (42.36, 502.48) | 152.82 (43.00, 492.59) | 0.830 | |
| Characteristic | Univariate Cox regression | Multivariate Cox regression | ||
|---|---|---|---|---|
| HR (95%CI) | P value | HR (95%CI) | P value | |
| Age | 1.03 (1.01‒1.05) | <0.001 | 1.03 (1.01‒1.05) | 0.007 |
| Smoking history | 1.96 (1.08‒3.56) | 0.028 | 2.10 (1.11‒3.96) | 0.023 |
| Liver disease | 4.03 (2.16‒7.53) | <0.001 | 2.91 (1.50‒5.62) | 0.001 |
| Hyperlipidemia | 0.40 (0.19‒0.86) | 0.018 | 0.51 (0.23‒1.11) | 0.088 |
| Hemoglobin | 0.99 (0.98‒1.00) | 0.002 | 1.00 (0.99‒1.01) | 0.793 |
| Total protein | 0.96 (0.94‒0.99) | 0.002 | 0.97 (0.94‒1.03) | 0.161 |
| Albumin | 0.94 (0.91‒0.97) | <0.001 | 1.01 (0.94‒1.08) | 0.769 |
| GPT | 0.98 (0.97‒1.00) | 0.046 | 0.99 (0.97‒1.01) | 0.172 |
| CEA | 1.01 (1.00‒1.01) | <0.001 | 1.00 (1.00‒1.01) | 0.096 |
| CA724 | 1.09 (1.06‒1.13) | <0.001 | 1.08 (1.04‒1.12) | <0.001 |
| D-D | 1.06 (1.00‒1.11) | 0.034 | 1.01 (0.94‒1.10) | 0.747 |
| AJCC clinical stage | 2.03 (1.42‒2.91) | <0.001 | 1.87 (1.29‒2.72) | <0.001 |
表2 训练集患者PFS的单因素及多因素Cox回归分析
Tab 2 Univariate and multivariate Cox regression analysis on the training set of PFS
| Characteristic | Univariate Cox regression | Multivariate Cox regression | ||
|---|---|---|---|---|
| HR (95%CI) | P value | HR (95%CI) | P value | |
| Age | 1.03 (1.01‒1.05) | <0.001 | 1.03 (1.01‒1.05) | 0.007 |
| Smoking history | 1.96 (1.08‒3.56) | 0.028 | 2.10 (1.11‒3.96) | 0.023 |
| Liver disease | 4.03 (2.16‒7.53) | <0.001 | 2.91 (1.50‒5.62) | 0.001 |
| Hyperlipidemia | 0.40 (0.19‒0.86) | 0.018 | 0.51 (0.23‒1.11) | 0.088 |
| Hemoglobin | 0.99 (0.98‒1.00) | 0.002 | 1.00 (0.99‒1.01) | 0.793 |
| Total protein | 0.96 (0.94‒0.99) | 0.002 | 0.97 (0.94‒1.03) | 0.161 |
| Albumin | 0.94 (0.91‒0.97) | <0.001 | 1.01 (0.94‒1.08) | 0.769 |
| GPT | 0.98 (0.97‒1.00) | 0.046 | 0.99 (0.97‒1.01) | 0.172 |
| CEA | 1.01 (1.00‒1.01) | <0.001 | 1.00 (1.00‒1.01) | 0.096 |
| CA724 | 1.09 (1.06‒1.13) | <0.001 | 1.08 (1.04‒1.12) | <0.001 |
| D-D | 1.06 (1.00‒1.11) | 0.034 | 1.01 (0.94‒1.10) | 0.747 |
| AJCC clinical stage | 2.03 (1.42‒2.91) | <0.001 | 1.87 (1.29‒2.72) | <0.001 |
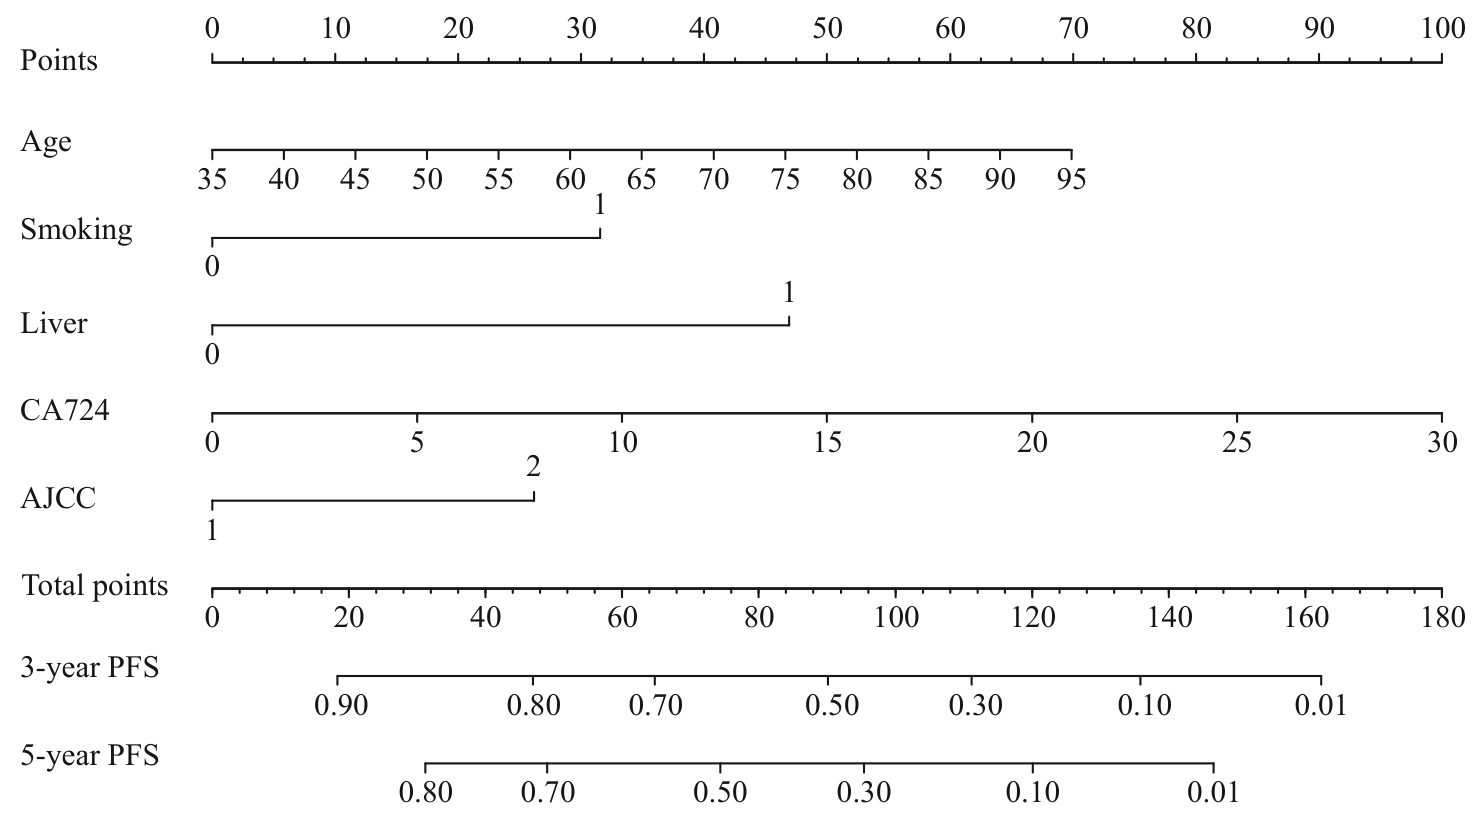
图1 CRC患者3、5年的PFS列线图可视化显示
Fig 1 Nomogram for predicting 3- and 5-year PFS in CRC patients
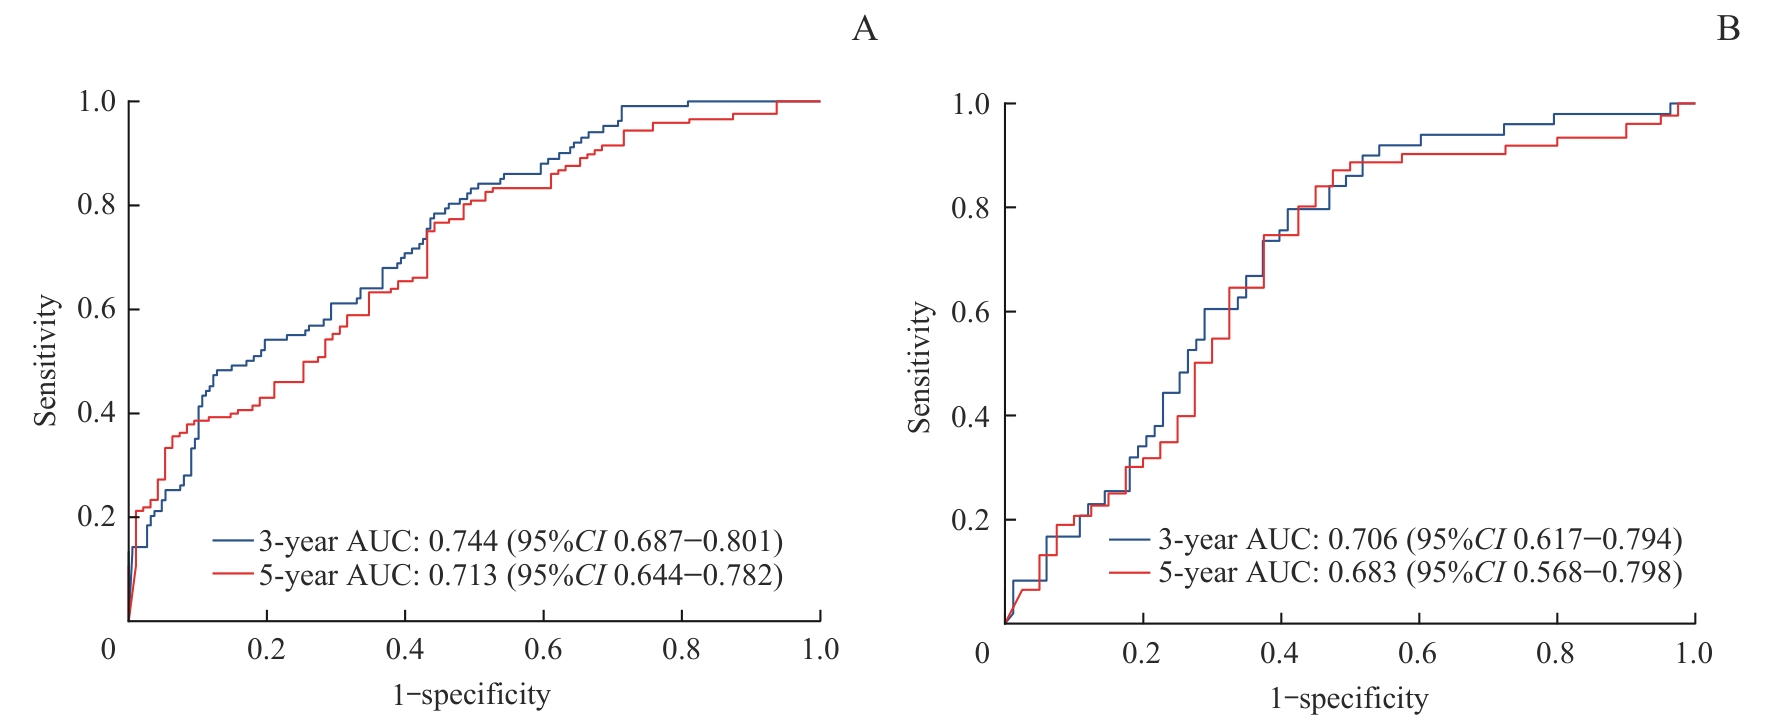
图2 PFS的ROC曲线Note: A. Training set. B. Validation set.
Fig 2 ROC curves of PFS
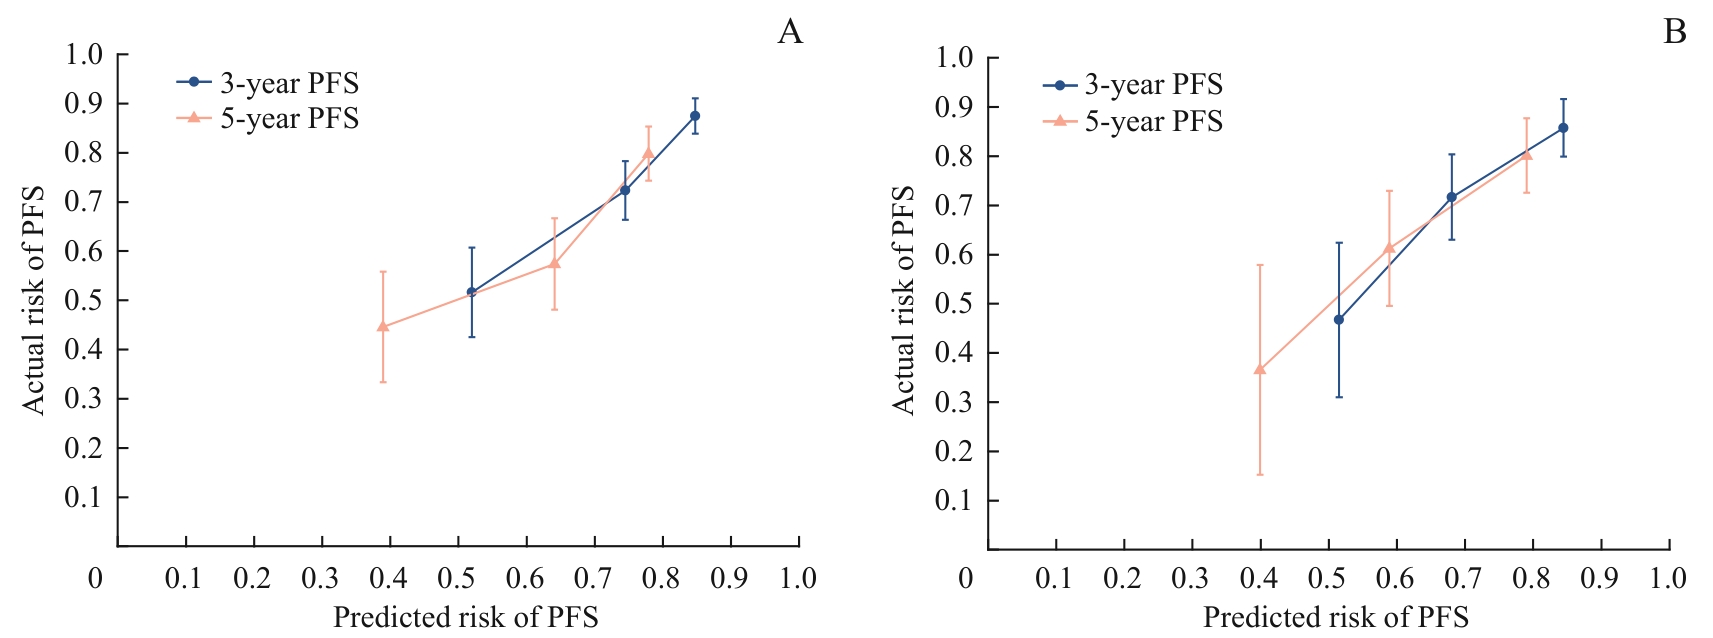
图3 PFS的校准拟合曲线Note: A. Training set. B. Validation set.
Fig 3 Calibrated curves for PFS
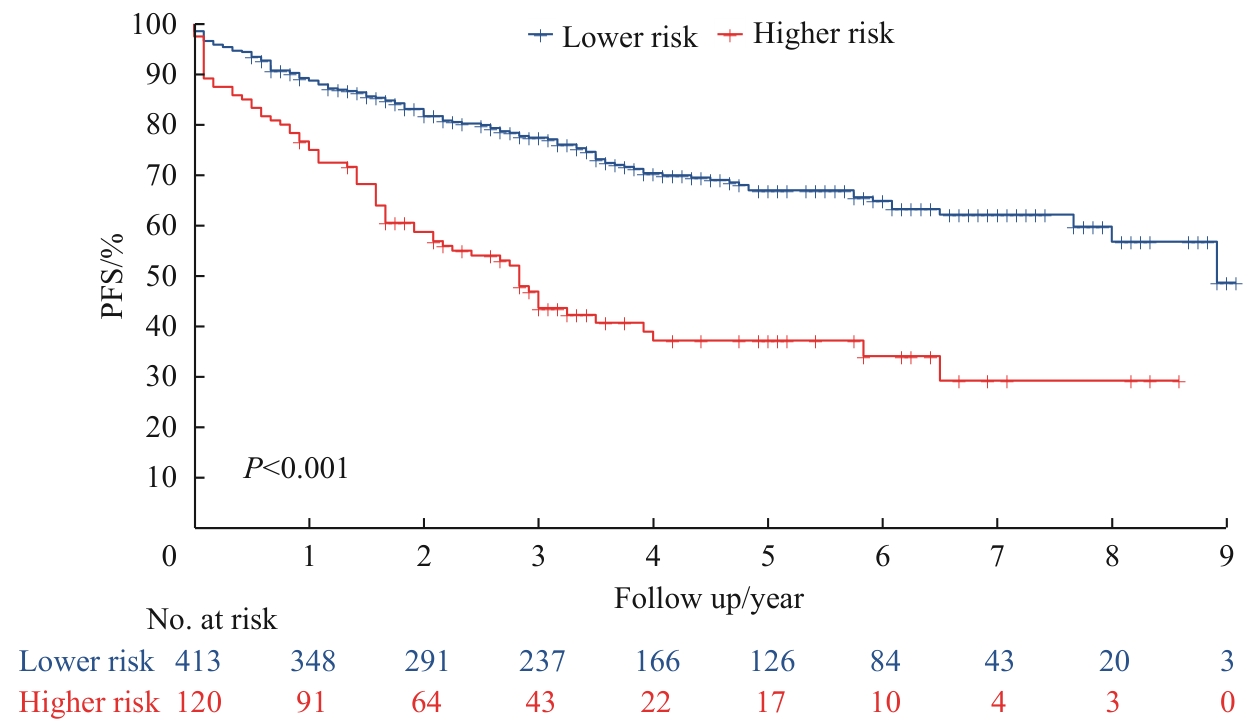
图4 PFS的生存曲线
Fig 4 Survival curves for PFS
| Item | Age≥65 years | Age<65 years | ||
|---|---|---|---|---|
| HR (95%CI) | P value | HR (95%CI) | P value | |
| Age | 1.03 (1.01‒1.05) | 0.009 | 1.01 (0.97‒1.05) | 0.649 |
| Smoking history | 1.78 (0.86‒3.72) | 0.123 | 2.40 (1.02‒5.68) | 0.046 |
| Liver disease | 2.82 (1.50‒5.28) | 0.001 | 1.80 (0.55‒5.83) | 0.330 |
| CA724 | 1.03 (0.99‒1.08) | 0.118 | 1.12 (1.07‒1.16) | <0.001 |
| AJCC clinical stage | 2.15 (1.50‒3.07) | <0.001 | 3.50 (1.89‒6.50) | <0.001 |
表3 年龄≥65岁和<65岁患者PFS的多因素Cox回归分析
Tab 3 Multivariate Cox regression analysis on PFS in patients aged≥65 years and <65 years
| Item | Age≥65 years | Age<65 years | ||
|---|---|---|---|---|
| HR (95%CI) | P value | HR (95%CI) | P value | |
| Age | 1.03 (1.01‒1.05) | 0.009 | 1.01 (0.97‒1.05) | 0.649 |
| Smoking history | 1.78 (0.86‒3.72) | 0.123 | 2.40 (1.02‒5.68) | 0.046 |
| Liver disease | 2.82 (1.50‒5.28) | 0.001 | 1.80 (0.55‒5.83) | 0.330 |
| CA724 | 1.03 (0.99‒1.08) | 0.118 | 1.12 (1.07‒1.16) | <0.001 |
| AJCC clinical stage | 2.15 (1.50‒3.07) | <0.001 | 3.50 (1.89‒6.50) | <0.001 |
| Item | Male | Female | ||
|---|---|---|---|---|
| HR (95%CI) | P value | HR (95%CI) | P value | |
| Age | 1.03 (1.01‒1.05) | <0.001 | 1.01 (1.00‒1.03) | 0.122 |
| Smoking history | 2.19 (1.23‒3.88) | 0.007 | ‒ | ‒ |
| Liver disease | 1.97 (0.90‒3.88) | 0.088 | 3.71 (1.66‒8.30) | 0.001 |
| CA724 | 1.05 (1.01‒1.09) | 0.008 | 1.10 (1.05‒1.15) | <0.001 |
| AJCC clinical stage | 2.49 (1.67‒3.73) | <0.001 | 2.83 (1.73‒4.63) | <0.001 |
表4 男性和女性患者PFS的多因素Cox回归分析
Tab 4 Multivariate Cox regression analysis on PFS in male and female patients
| Item | Male | Female | ||
|---|---|---|---|---|
| HR (95%CI) | P value | HR (95%CI) | P value | |
| Age | 1.03 (1.01‒1.05) | <0.001 | 1.01 (1.00‒1.03) | 0.122 |
| Smoking history | 2.19 (1.23‒3.88) | 0.007 | ‒ | ‒ |
| Liver disease | 1.97 (0.90‒3.88) | 0.088 | 3.71 (1.66‒8.30) | 0.001 |
| CA724 | 1.05 (1.01‒1.09) | 0.008 | 1.10 (1.05‒1.15) | <0.001 |
| AJCC clinical stage | 2.49 (1.67‒3.73) | <0.001 | 2.83 (1.73‒4.63) | <0.001 |
| Item | AJCC stage Ⅰ‒Ⅱ | AJCC stage Ⅲ‒Ⅳ | ||
|---|---|---|---|---|
| HR (95%CI) | P value | HR (95%CI) | P value | |
| Age | 1.04 (1.01‒1.06) | 0.002 | 1.02 (1.00‒1.03) | 0.028 |
| Smoking history | 2.70 (1.07‒6.83) | 0.036 | 1.65 (0.83‒3.28) | 0.157 |
| Liver disease | 1.11 (0.27‒4.64) | 0.883 | 2.75 (1.50‒5.06) | 0.001 |
| CA724 | 1.04 (0.99‒1.09) | 0.099 | 1.08 (1.04‒1.12) | <0.001 |
表5 AJCC分期Ⅰ~Ⅱ期和Ⅲ~Ⅳ期的患者PFS的多因素Cox回归分析
Tab 5 Multivariate Cox regression analysis on PFS in patients with AJCC stage Ⅰ‒Ⅱ and stage Ⅲ‒Ⅳ
| Item | AJCC stage Ⅰ‒Ⅱ | AJCC stage Ⅲ‒Ⅳ | ||
|---|---|---|---|---|
| HR (95%CI) | P value | HR (95%CI) | P value | |
| Age | 1.04 (1.01‒1.06) | 0.002 | 1.02 (1.00‒1.03) | 0.028 |
| Smoking history | 2.70 (1.07‒6.83) | 0.036 | 1.65 (0.83‒3.28) | 0.157 |
| Liver disease | 1.11 (0.27‒4.64) | 0.883 | 2.75 (1.50‒5.06) | 0.001 |
| CA724 | 1.04 (0.99‒1.09) | 0.099 | 1.08 (1.04‒1.12) | <0.001 |
| 1 | SUNG H, FERLAY J, SIEGEL R L, et al. Global cancer statistics 2020: globocan estimates of incidence and mortality worldwide for 36 cancers in 185 countries[J]. CA Cancer J Clin, 2021, 71(3): 209-249. |
| 2 | BRENNER B, GEVA R, ROTHNEY M, et al. Impact of the 12-gene colon cancer assay on clinical decision making for adjuvant therapy in stage Ⅱ colon cancer patients[J]. Value Health, 2016, 19(1): 82-87. |
| 3 | OSTERMAN E, GLIMELIUS B. Recurrence risk after up-to-date colon cancer staging, surgery, and pathology: analysis of the entire Swedish population[J]. Dis Colon Rectum, 2018, 61(9): 1016-1025. |
| 4 | VAN ZUTPHEN M, BOSHUIZEN H C, KENKHUIS M F, et al. Lifestyle after colorectal cancer diagnosis in relation to recurrence and all-cause mortality[J]. Am J Clin Nutr, 2021, 113(6): 1447-1457. |
| 5 | 史金鑫, 崔健, 李子建, 等. 不同年龄段老年结直肠癌患者术后临床特征分析[J]. 中华医学杂志, 2022, 102(8): 563-568. |
| SHI J X, CUI J, LI Z J, et al. Contrastive analysis about the postoperative clinical characteristics of elderly patients with colorectal cancer in different age groups[J]. National Medical Journal of China, 2022, 102(8): 563-568. | |
| 6 | 中华人民共和国国家卫生健康委员会. 中国结直肠癌诊疗规范(2023版)[J]. 中华消化外科杂志, 2023, 22(6): 667-698. |
| National Health Commission of the People′s Republic of China. Chinese protocol of diagnosis and treatment of colorectal cancer (2023 edition)[J]. Chinese Society of Oncology, 2023, 22(6): 667-698. | |
| 7 | STIKSMA J, GROOTENDORST D C, VAN DER LINDEN P W G. CA 19-9 as a marker in addition to CEA to monitor colorectal cancer[J]. Clin Colorectal Cancer, 2014, 13(4): 239-244. |
| 8 | AMIN M B, GREENE F L, EDGE S B, et al. The eighth edition AJCC cancer staging manual: continuing to build a bridge from a population-based to a more “personalized” approach to cancer staging[J]. CA Cancer J Clin, 2017, 67(2): 93-99. |
| 9 | KONISHI T, SHIMADA Y, HSU M, et al. Association of preoperative and postoperative serum carcinoembryonic antigen and colon cancer outcome[J]. JAMA Oncol, 2018, 4(3): 309-315. |
| 10 | KUANG J A, GONG Y Z, XIE H L, et al. The prognostic value of preoperative serum CA724 for CEA-normal colorectal cancer patients[J]. PeerJ, 2020, 8: e8936. |
| 11 | 闫超, 陕飞, 李子禹. 2020年中国与全球结直肠癌流行概况分析[J]. 中华肿瘤杂志, 2023, 45(3): 221-229. |
| YAN C, SHAN F, LI Z Y. Prevalence of colorectal cancer in 2020: a comparative analysis between China and the world[J]. Chinese Journal of Oncology, 2023, 45(3): 221-229. | |
| 12 | LIEU C H, RENFRO L A, DE GRAMONT A, et al. Association of age with survival in patients with metastatic colorectal cancer: analysis from the ARCAD Clinical Trials Program[J]. J Clin Oncol, 2014, 32(27): 2975-2984. |
| 13 | ZHOU X, XIAO Q, JIANG F Y, et al. Dissecting the pathogenic effects of smoking and its hallmarks in blood DNA methylation on colorectal cancer risk[J]. Br J Cancer, 2023, 129(8): 1306-1313. |
| 14 | BOTTERI E, BORRONI E, SLOAN E K, et al. Smoking and colorectal cancer risk, overall and by molecular subtypes: a meta-analysis[J]. Am J Gastroenterol, 2020, 115(12): 1940-1949. |
| 15 | AMITAY E L, CARR P R, JANSEN L, et al. Smoking, alcohol consumption and colorectal cancer risk by molecular pathological subtypes and pathways[J]. Br J Cancer, 2020, 122(11): 1604-1610. |
| 16 | PHIPPS A I, SHI Q, NEWCOMB P A, et al. Associations between cigarette smoking status and colon cancer prognosis among participants in North Central Cancer Treatment Group Phase Ⅲ Trial N0147[J]. J Clin Oncol, 2013, 31(16): 2016-2023. |
| 17 | LV Y, ZHANG H J. Effect of non-alcoholic fatty liver disease on the risk of synchronous liver metastasis: analysis of 451 consecutive patients of newly diagnosed colorectal cancer[J]. Front Oncol, 2020, 10: 251. |
| 18 | WU K N, ZHAI M Z, WELTZIEN E K, et al. Non-alcoholic fatty liver disease and colorectal cancer survival[J]. Cancer Causes Control, 2019, 30(2): 165-168. |
| 19 | UTSUNOMIYA T, SAITSU H, SAKU M, et al. Rare occurrence of colorectal cancer metastasis in livers infected with hepatitis B or C virus[J]. Am J Surg, 1999, 177(4): 279-281. |
| 20 | QIU H B, ZHANG L Y, ZENG Z L, et al. HBV infection decreases risk of liver metastasis in patients with colorectal cancer: a cohort study[J]. World J Gastroenterol, 2011, 17(6): 804-808. |
| 21 | HUO T T, CAO J Y, TIAN Y W, et al. Effect of concomitant positive hepatitis B surface antigen on the risk of liver metastasis: a retrospective clinical study of 4033 consecutive cases of newly diagnosed colorectal cancer[J]. Clin Infect Dis, 2018, 66(12): 1948-1952. |
| 22 | JING X L, ZHANG S C. An ancient molecule with novel function: alanine aminotransferase as a lipopolysaccharide binding protein with bacteriocidal activity[J]. Dev Comp Immunol, 2011, 35(1): 94-104. |
| 23 | HE M M, FANG Z, HANG D, et al. Circulating liver function markers and colorectal cancer risk: a prospective cohort study in the UK Biobank[J]. Int J Cancer, 2021, 148(8): 1867-1878. |
| 24 | FU J M, DU F Q, TIAN T, et al. Development and validation of prognostic nomograms based on De Ritis ratio and clinicopathological features for patients with stage Ⅱ/Ⅲ colorectal cancer[J]. BMC Cancer, 2023, 23(1): 620. |
| 25 | LEE J H, JUNG S, PARK W S, et al. Prognostic nomogram of hypoxia-related genes predicting overall survival of colorectal cancer-analysis of TCGA database[J]. Sci Rep, 2019, 9(1): 1803. |
| [1] | 彭倩倩, 宋璟涵, 徐杏怡, 肖辉. RNA结合蛋白HuR通过调控ITGB1促进非小细胞肺癌进展的生物信息学分析及验证[J]. 上海交通大学学报(医学版), 2026, 46(4): 451-466. |
| [2] | 江怡, 黄晨浩, 李祉良, 吴珺玮, 赵任, 张弢. 1例KRAS突变的结直肠癌患者术前接受化疗联合免疫治疗的效果报道[J]. 上海交通大学学报(医学版), 2025, 45(9): 1256-1260. |
| [3] | 陆晔峰, 高磊青, 倪晓筱, 富晶晶. 儿童肝移植术后早期血糖及血脂的多时间点监测与影响因素分析[J]. 上海交通大学学报(医学版), 2025, 45(4): 443-451. |
| [4] | 陈蓉, 张锰, 朱荻绮, 郭颖, 沈捷. 基于抗中性粒细胞胞质抗体的列线图模型对川崎病患儿并发冠状动脉病变风险的预测作用[J]. 上海交通大学学报(医学版), 2025, 45(4): 459-467. |
| [5] | 孙瑞状, 乔坤朋, 李璞, 徐小莲, 孟俊. ABCA7在结直肠癌中的临床价值及转录调控机制[J]. 上海交通大学学报(医学版), 2025, 45(11): 1490-1501. |
| [6] | 梁乐斌, 陈慧芳, 赖淑静, 顾靓, 苏冰. 基于空间ATAC-seq技术的Apcmin/+小鼠结肠肿瘤表观特征分析[J]. 上海交通大学学报(医学版), 2025, 45(10): 1261-1270. |
| [7] | 钱立恒, 温凯玲, 廖颖娜, 李书鑫, 聂惠贞. 分选链接蛋白1抑制结直肠癌细胞增殖和迁移的作用和机制研究[J]. 上海交通大学学报(医学版), 2024, 44(9): 1124-1135. |
| [8] | 陈丽红, 王妍, 周翔天, 郑俊克, 闫小响. 国家自然科学基金青年科学基金项目立项的影响因素分析——以上海交通大学医学院为例[J]. 上海交通大学学报(医学版), 2024, 44(9): 1205-1212. |
| [9] | 冯昫皎, 刘健悦, 戚炀炀, 孙晶, 沈蕾. 结直肠癌中自然杀伤细胞表型及功能初探[J]. 上海交通大学学报(医学版), 2024, 44(6): 713-722. |
| [10] | 俞洋, 孟丹, 仇奕文, 袁见, 朱莹杰. 两样本孟德尔随机化法分析1型糖尿病对结直肠癌的影响[J]. 上海交通大学学报(医学版), 2024, 44(6): 755-761. |
| [11] | 傅艺玲, 吴茜, 罗晓庆, 吴艾泓, 夏雪兰, 郑敏. 晚期癌症患者预立医疗照护计划参与行为影响因素的系统综述[J]. 上海交通大学学报(医学版), 2024, 44(4): 482-493. |
| [12] | 罗晨, 沈玲, 王传伟, 顾佳妮, 王瑾, 赵黎, 黄帅. 腹腔镜结直肠癌根治术后患者早期下床活动现状及影响因素[J]. 上海交通大学学报(医学版), 2023, 43(9): 1201-1210. |
| [13] | 王晓玉, 彭银辉, 马文琳, 姚博爽, 李一凡, 赵莉, 杨春霞. 新冠疫情大流行期间儿童及青少年新发焦虑症状的纵向研究[J]. 上海交通大学学报(医学版), 2023, 43(8): 963-970. |
| [14] | 田晓梵, 董怡, 楼文晖, 张琪, 邱艺杰, 左丹, 王文平. 基于超声剪切波弹性成像参数与临床风险因素的术后胰瘘改良预测模型[J]. 上海交通大学学报(医学版), 2023, 43(4): 437-444. |
| [15] | 彭恬, 徐雷鸣. 表观遗传修饰与环状RNA在结直肠癌中相互作用的研究进展[J]. 上海交通大学学报(医学版), 2023, 43(2): 237-243. |
| 阅读次数 | ||||||
|
全文 |
|
|||||
|
摘要 |
|
|||||