上海交通大学学报(医学版) ›› 2025, Vol. 45 ›› Issue (3): 292-300.doi: 10.3969/j.issn.1674-8115.2025.03.005
杨晨蝶1( ), 胡长青2(), 袁贺3, TAY Guan Poh3, 阿布力克木·阿木提3, 张瑞岩1, 王晓群1,3()
收稿日期:2024-08-26
接受日期:2024-11-04
出版日期:2025-03-28
发布日期:2025-03-18
通讯作者:
王晓群,副教授,副主任医师,副研究员,博士;电子信箱:wangxq@shsmu.edu.cn。作者简介:杨晨蝶(1989—),女,主治医师,博士;电子信箱:yangcd1029@163.com基金资助:
YANG Chendie1(), HU Changqing2(), YUAN He3, TAY Guan Poh3, AMUTI Abulikemu3, ZHANG Ruiyan1, WANG Xiaoqun1,3()
Received:2024-08-26
Accepted:2024-11-04
Online:2025-03-28
Published:2025-03-18
Contact:
WANG Xiaoqun, E-mail: wangxq@shsmu.edu.cn.Supported by:摘要:
目的·探索无糖尿病病史患者胰岛素抵抗水平与ST段抬高型心肌梗死(ST-segment elevation myocardial infarction,STEMI)后左室重构的相关性。方法·连续入组自2014年1月—2022年12月收治于上海交通大学医学院附属瑞金医院心内科因STEMI行急诊经皮冠状动脉介入治疗的无糖尿病病史患者,随访6个月。收集患者的年龄、性别、吸烟情况、体格检查(血压、体质量指数等)、生化指标(肝肾功能、血脂、血糖、心肌肌钙蛋白峰值等)、用药情况等资料。采用稳态模型评估胰岛素抵抗指数(homeostasis model assessment of insulin resistance,HOMA-IR)作为反映胰岛素抵抗水平的指标。根据随访期间测定的平均HOMA-IR的四分位数,将患者分为4组:低水平组、中低水平组、中高水平组、高水平组。分别于基线和随访结束时行超声心动图检查,分析胰岛素抵抗水平与STEMI后左室重构的相关性。结果·共纳入219例患者,平均年龄(62.7±11.9)岁,男性占85.4%(187例)。平均随访时间为(6.4±1.8)个月。随访期间平均测定HOMA-IR(4.32±2.18)次,HOMA-IR中位数为2.41(1.58,3.98),高于正常人群水平。随着HOMA-IR水平的升高,心肌梗死后的左室舒张末内径(P=0.027)及左室舒张末容积指数(P=0.013)从整体上呈扩张趋势。Pearson相关性分析显示,随访期间的平均HOMA-IR水平(log变换后)与左室舒张末容积指数变化值(r=0.20,P=0.003)和左室舒张末内径变化值(r=0.21,P=0.002)呈正相关。多元回归分析进一步表明,在校正了年龄、性别、传统危险因素(高血压病史、体质量指数、吸烟史、肾功能、血脂等)、药物治疗情况及基线左室射血分数和心肌肌钙蛋白峰值后,高水平HOMA-IR仍然是STEMI后左室重构的独立危险因素。与低水平HOMA-IR组相比,高水平组患者的左室舒张末容积指数增加7.727 mL/m2(P<0.001)。结论·无糖尿病病史的STEMI患者普遍存在胰岛素抵抗,且胰岛素抵抗水平是心肌梗死后左室不良重构的独立预测因子。
中图分类号:
杨晨蝶, 胡长青, 袁贺, TAY Guan Poh, 阿布力克木·阿木提, 张瑞岩, 王晓群. 无糖尿病病史患者胰岛素抵抗水平与急性ST段抬高型心肌梗死后左室重构的相关性[J]. 上海交通大学学报(医学版), 2025, 45(3): 292-300.
YANG Chendie, HU Changqing, YUAN He, TAY Guan Poh, AMUTI Abulikemu, ZHANG Ruiyan, WANG Xiaoqun. Association between insulin resistance and left ventricular remodeling after STEMI in patients without a history of diabetes mellitus[J]. Journal of Shanghai Jiao Tong University (Medical Science), 2025, 45(3): 292-300.
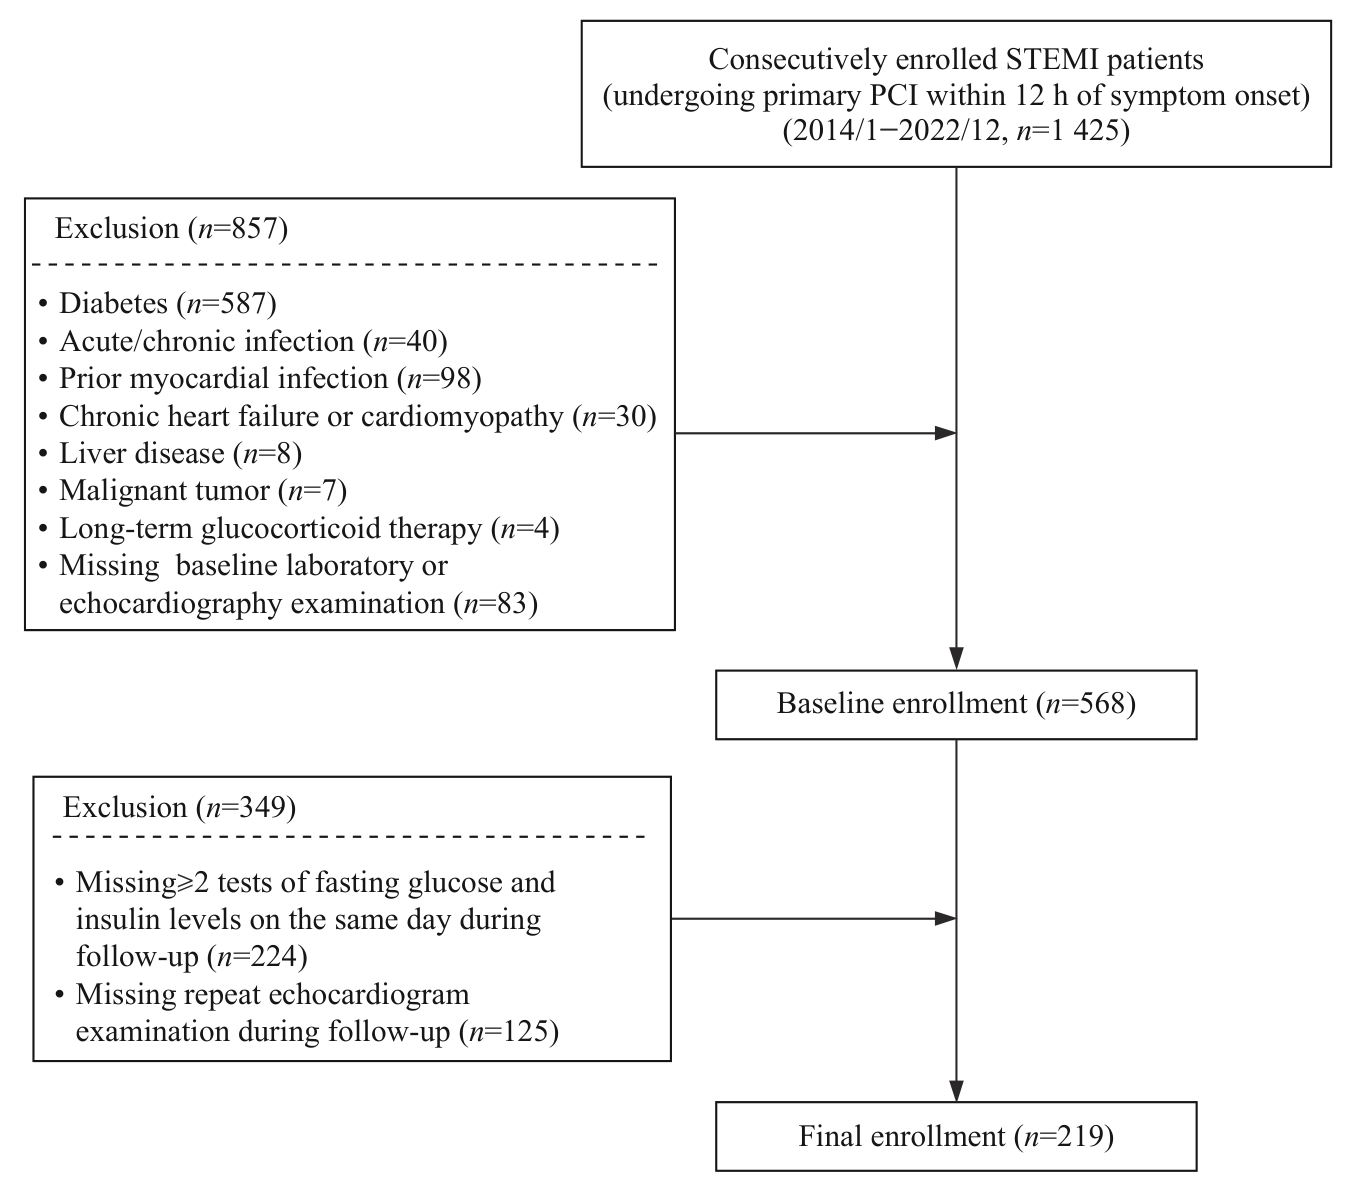
图1 患者入组流程图
Fig 1 Flow chart of patient enrollment
| Item | Mean HOMA-IR level | P value | |||
|---|---|---|---|---|---|
Low (≤1.58) (n=55) | Low-medium (>1.58 and ≤2.41) (n=56) | Medium-high (>2.41 and ≤3.98) (n=54) | High (>3.98) (n=54) | ||
Demographic characteristics and clinical assessment | |||||
| Gender (male)/n (%) | 48 (87.3) | 46 (82.1) | 47 (87.0) | 46 (85.2) | 0.862 |
| Age/year | 63.40±12.28 | 66.04±10.56 | 60.39±10.45 | 60.70±13.47 | 0.042 |
| Hypertension/% | 27 (49.1) | 25 (44.6) | 28 (51.9) | 39 (72.2) | 0.020 |
| Current smoker/% | 27 (49.1) | 22 (39.3) | 27 (50.0) | 30 (55.6) | 0.386 |
| BMI/(kg·m-2) | 23.24±3.48 | 23.67±3.27 | 25.80±2.74 | 27.27±6.61 | <0.001 |
| Systolic blood pressure/mmHg | 121.89±22.83 | 121.36±16.63 | 121.72±20.59 | 127.48±17.38 | 0.305 |
| Diastolic blood pressure/mmHg | 73.78±13.63 | 76.68±12.50 | 74.61±14.66 | 77.39±13.11 | 0.460 |
| Laboratory measurement | |||||
| HbA1c/% | 5.61±0.32 | 5.66±0.38 | 5.87±0.84 | 6.19±1.22 | 0.001 |
| Fasting glucose/(mmol·L-1) | 5.60 (4.96‒7.53) | 6.68 (5.34‒8.48) | 5.84 (4.78‒7.50) | 6.54 (5.62‒9.00) | 0.073 |
| 2 h Postprandial blood glucose/(mmol·L-1) | 8.61 (7.46‒12.40) | 8.72 (7.37‒10.40) | 8.30 (7.01‒10.59) | 8.61 (7.46‒12.40) | 0.587 |
| Fasting insulin/(μIU·mL-1) | 6.69(5.02‒9.12) | 9.27 (7.22‒12.45) | 14.29 (11.31‒17.47) | 16.67 (12.83‒21.80) | <0.001 |
| Alanine transaminase/(IU·L-1) | 34.80±26.54 | 42.71±39.29 | 37.28±22.18 | 46.44±31.00 | 0.188 |
| Triglyceride/(mmol·L-1) | 1.08 (0.77‒1.60) | 1.43 (1.00‒1.80) | 1.82 (1.31‒2.41) | 1.90 (1.35‒2.45) | <0.001 |
| Total cholesterol/(mmol·L-1) | 4.68±1.39 | 4.60±1.29 | 4.77±1.05 | 4.86±1.05 | 0.700 |
| LDL-C/(mmol·L-1) | 3.04±1.36 | 2.91±1.01 | 3.01±1.00 | 3.01±0.85 | 0.928 |
| HDL-C/(mmol·L-1) | 1.14±0.28 | 1.09±0.24 | 1.03±0.20 | 1.02±0.20 | 0.030 |
| Serum creatine/(μmol·L-1) | 79.42±17.26 | 82.36±16.11 | 84.83±22.32 | 84.24±25.95 | 0.521 |
| Blood urea nitrogen/(mmol·L-1) | 5.81±1.58 | 5.74±1.52 | 5.52±1.63 | 5.61±1.60 | 0.775 |
| eGFR/[mL·min-1·(1.732 m)-2] | 97.50±21.38 | 91.00±12.33 | 98.45±25.65 | 97.94±22.95 | 0.208 |
| NT-proBNP/(pg·mL-1) | 355.50 (148.40‒1 525.00) | 493.25 (192.78‒1 364.50) | 602.15 (135.18‒1 861.00) | 253.20 (110.62‒1 069.00) | 0.285 |
| Peak cTnI level/(ng·mL-1) | 41.20 (5.47‒87.67) | 54.70 (15.42‒104.85) | 44.64 (9.69‒110.19) | 31.40 (25.61‒95.52) | 0.389 |
| Medication use | |||||
| Aspirin/n (%) | 50 (90.9) | 56 (100.0) | 54 (100.0) | 51 (94.4) | 0.025 |
| P2Y12 inhibitor/n (%) | 55 (100.0) | 52 (92.9) | 54 (100.0) | 50 (92.6) | 0.041 |
| β blocker/n (%) | 53 (96.4) | 40 (71.4) | 47 (87.0) | 50 (92.6) | 0.001 |
| ACEI/ARB/n (%) | 36 (65.5) | 39 (69.6) | 39 (72.2) | 47 (87.0) | 0.061 |
| ARNI/n (%) | 15 (27.3) | 12 (21.4) | 16 (29.6) | 17 (31.5) | 0.661 |
| SGLT2 inhibitor/n (%) | 2 (3.6) | 2 (3.6) | 2 (3.7) | 7 (13.0) | 0.096 |
| MRA/n (%) | 4 (7.3) | 6 (10.7) | 7 (13.0) | 6 (11.1) | 0.806 |
| Diuretics/n (%) | 1 (1.8) | 6 (10.7) | 7 (13.0) | 4 (7.4) | 0.164 |
表1 不同HOMA-IR平均水平患者的基线临床特征比较
Tab 1 Baseline characteristics of patients with different HOMA-IR levels
| Item | Mean HOMA-IR level | P value | |||
|---|---|---|---|---|---|
Low (≤1.58) (n=55) | Low-medium (>1.58 and ≤2.41) (n=56) | Medium-high (>2.41 and ≤3.98) (n=54) | High (>3.98) (n=54) | ||
Demographic characteristics and clinical assessment | |||||
| Gender (male)/n (%) | 48 (87.3) | 46 (82.1) | 47 (87.0) | 46 (85.2) | 0.862 |
| Age/year | 63.40±12.28 | 66.04±10.56 | 60.39±10.45 | 60.70±13.47 | 0.042 |
| Hypertension/% | 27 (49.1) | 25 (44.6) | 28 (51.9) | 39 (72.2) | 0.020 |
| Current smoker/% | 27 (49.1) | 22 (39.3) | 27 (50.0) | 30 (55.6) | 0.386 |
| BMI/(kg·m-2) | 23.24±3.48 | 23.67±3.27 | 25.80±2.74 | 27.27±6.61 | <0.001 |
| Systolic blood pressure/mmHg | 121.89±22.83 | 121.36±16.63 | 121.72±20.59 | 127.48±17.38 | 0.305 |
| Diastolic blood pressure/mmHg | 73.78±13.63 | 76.68±12.50 | 74.61±14.66 | 77.39±13.11 | 0.460 |
| Laboratory measurement | |||||
| HbA1c/% | 5.61±0.32 | 5.66±0.38 | 5.87±0.84 | 6.19±1.22 | 0.001 |
| Fasting glucose/(mmol·L-1) | 5.60 (4.96‒7.53) | 6.68 (5.34‒8.48) | 5.84 (4.78‒7.50) | 6.54 (5.62‒9.00) | 0.073 |
| 2 h Postprandial blood glucose/(mmol·L-1) | 8.61 (7.46‒12.40) | 8.72 (7.37‒10.40) | 8.30 (7.01‒10.59) | 8.61 (7.46‒12.40) | 0.587 |
| Fasting insulin/(μIU·mL-1) | 6.69(5.02‒9.12) | 9.27 (7.22‒12.45) | 14.29 (11.31‒17.47) | 16.67 (12.83‒21.80) | <0.001 |
| Alanine transaminase/(IU·L-1) | 34.80±26.54 | 42.71±39.29 | 37.28±22.18 | 46.44±31.00 | 0.188 |
| Triglyceride/(mmol·L-1) | 1.08 (0.77‒1.60) | 1.43 (1.00‒1.80) | 1.82 (1.31‒2.41) | 1.90 (1.35‒2.45) | <0.001 |
| Total cholesterol/(mmol·L-1) | 4.68±1.39 | 4.60±1.29 | 4.77±1.05 | 4.86±1.05 | 0.700 |
| LDL-C/(mmol·L-1) | 3.04±1.36 | 2.91±1.01 | 3.01±1.00 | 3.01±0.85 | 0.928 |
| HDL-C/(mmol·L-1) | 1.14±0.28 | 1.09±0.24 | 1.03±0.20 | 1.02±0.20 | 0.030 |
| Serum creatine/(μmol·L-1) | 79.42±17.26 | 82.36±16.11 | 84.83±22.32 | 84.24±25.95 | 0.521 |
| Blood urea nitrogen/(mmol·L-1) | 5.81±1.58 | 5.74±1.52 | 5.52±1.63 | 5.61±1.60 | 0.775 |
| eGFR/[mL·min-1·(1.732 m)-2] | 97.50±21.38 | 91.00±12.33 | 98.45±25.65 | 97.94±22.95 | 0.208 |
| NT-proBNP/(pg·mL-1) | 355.50 (148.40‒1 525.00) | 493.25 (192.78‒1 364.50) | 602.15 (135.18‒1 861.00) | 253.20 (110.62‒1 069.00) | 0.285 |
| Peak cTnI level/(ng·mL-1) | 41.20 (5.47‒87.67) | 54.70 (15.42‒104.85) | 44.64 (9.69‒110.19) | 31.40 (25.61‒95.52) | 0.389 |
| Medication use | |||||
| Aspirin/n (%) | 50 (90.9) | 56 (100.0) | 54 (100.0) | 51 (94.4) | 0.025 |
| P2Y12 inhibitor/n (%) | 55 (100.0) | 52 (92.9) | 54 (100.0) | 50 (92.6) | 0.041 |
| β blocker/n (%) | 53 (96.4) | 40 (71.4) | 47 (87.0) | 50 (92.6) | 0.001 |
| ACEI/ARB/n (%) | 36 (65.5) | 39 (69.6) | 39 (72.2) | 47 (87.0) | 0.061 |
| ARNI/n (%) | 15 (27.3) | 12 (21.4) | 16 (29.6) | 17 (31.5) | 0.661 |
| SGLT2 inhibitor/n (%) | 2 (3.6) | 2 (3.6) | 2 (3.7) | 7 (13.0) | 0.096 |
| MRA/n (%) | 4 (7.3) | 6 (10.7) | 7 (13.0) | 6 (11.1) | 0.806 |
| Diuretics/n (%) | 1 (1.8) | 6 (10.7) | 7 (13.0) | 4 (7.4) | 0.164 |
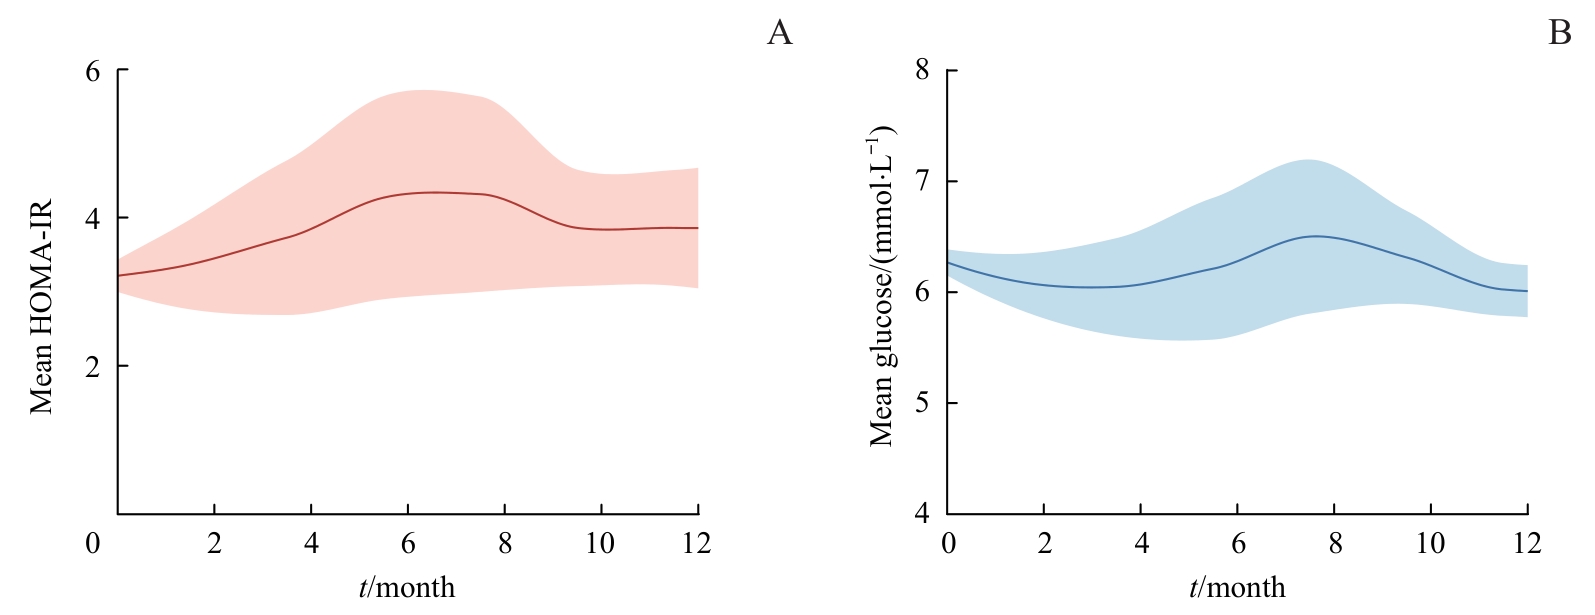
图2 随访期间HOMA-IR及空腹血糖的平均水平Note: A. Mean levels of visit-to-visit HOMA-IR during follow-up. B. Mean levels of fasting glucose during follow-up.
Fig 2 Mean levels of visit-to-visit HOMA-IR and fasting glucose during follow-up
| Item | Mean HOMA-IR level | P value | |||
|---|---|---|---|---|---|
| Low(≤1.58) | Low-medium (>1.58 and ≤2.41) | Medium-high (>2.41 and ≤3.98) | High (>3.98) | ||
| LVEDV index/(mL·m-2) | |||||
| Baseline | 71.41±20.42 | 68.22±15.72 | 73.52±18.68 | 63.09±11.13 | 0.009 |
| Follow-up | 68.69±21.54 | 69.11±16.91 | 71.99±14.54 | 66.85±12.42 | 0.455 |
| Δ | -2.73±12.30 | 0.88±9.58 | -1.52±12.01 | 3.77±9.93 | 0.013 |
| LVESV index/(mL·m-2) | |||||
| Baseline | 30.01±15.62 | 27.96±12.03 | 31.20±14.04 | 24.48±6.23 | 0.032 |
| Follow-up | 28.45±16.11 | 28.33±12.47 | 28.74±10.16 | 25.67±8.75 | 0.528 |
| Δ | -1.56±6.22 | 0.37±5.87 | -2.46±9.57 | 1.19±8.10 | 0.047 |
| LVEDD/mm | |||||
| Baseline | 50.56±6.50 | 49.84±6.06 | 52.46±5.45 | 49.87±4.01 | 0.051 |
| Follow-up | 49.76±6.99 | 50.00±5.93 | 52.07±4.41 | 50.91±4.13 | 0.118 |
| Δ | -0.80±3.46 | 0.16±3.03 | -0.39±3.49 | 1.04±3.31 | 0.027 |
| LVESD/mm | |||||
| Baseline | 34.44±7.14 | 33.88±6.55 | 35.91±6.33 | 33.39±4.15 | 0.168 |
| Follow-up | 33.64±7.40 | 33.91±6.31 | 35.00±4.67 | 33.72±4.64 | 0.599 |
| Δ | -0.80±2.59 | 0.04±2.91 | -0.91±3.67 | 0.33±4.11 | 0.147 |
| IVST/mm | |||||
| Baseline | 9.36±1.01 | 9.32±1.16 | 9.93±1.53 | 9.46±1.30 | 0.050 |
| Follow-up | 9.33±1.02 | 9.11±1.14 | 9.54±1.22 | 9.46±1.19 | 0.216 |
| Δ | -0.04±0.90 | -0.21±0.99 | -0.39±1.17 | 0±1.17 | 0.204 |
| LVPWT/mm | |||||
| Baseline | 8.93±0.63 | 8.66±0.84 | 9.33±0.95 | 9.00±1.18 | 0.002 |
| Follow-up | 8.87±0.75 | 8.79±0.85 | 9.13±0.97 | 8.91±0.96 | 0.216 |
| Δ | -0.05±0.65 | 0.12±0.72 | -0.20±0.88 | -0.09±1.15 | 0.255 |
| LVMI/(g·mm-2) | |||||
| Baseline | 96.11±24.27 | 90.16±18.38 | 103.38±28.52 | 86.74±18.06 | 0.001 |
| Follow-up | 92.94±24.73 | 90.57±21.50 | 97.43±22.24 | 89.89±20.66 | 0.288 |
| Δ | -3.17±15.22 | 0.42±12.82 | -5.95±14.79 | 3.15±15.28 | 0.008 |
| LVEF/% | |||||
| Baseline | 57.85±8.97 | 58.20±8.85 | 56.69±9.80 | 59.31±8.09 | 0.500 |
| Follow-up | 58.44±9.98 | 57.91±9.55 | 58.33±8.33 | 60.24±7.33 | 0.531 |
| Δ | 0.58±4.89 | -0.29±4.77 | 1.65±3.89 | 0.93±7.08 | 0.285 |
表2 不同HOMA-IR水平患者的随访前后超声心电图参数变化情况
Tab 2 Changes in echocardiography parameters during follow-up grouped by HOMA-IR quartiles
| Item | Mean HOMA-IR level | P value | |||
|---|---|---|---|---|---|
| Low(≤1.58) | Low-medium (>1.58 and ≤2.41) | Medium-high (>2.41 and ≤3.98) | High (>3.98) | ||
| LVEDV index/(mL·m-2) | |||||
| Baseline | 71.41±20.42 | 68.22±15.72 | 73.52±18.68 | 63.09±11.13 | 0.009 |
| Follow-up | 68.69±21.54 | 69.11±16.91 | 71.99±14.54 | 66.85±12.42 | 0.455 |
| Δ | -2.73±12.30 | 0.88±9.58 | -1.52±12.01 | 3.77±9.93 | 0.013 |
| LVESV index/(mL·m-2) | |||||
| Baseline | 30.01±15.62 | 27.96±12.03 | 31.20±14.04 | 24.48±6.23 | 0.032 |
| Follow-up | 28.45±16.11 | 28.33±12.47 | 28.74±10.16 | 25.67±8.75 | 0.528 |
| Δ | -1.56±6.22 | 0.37±5.87 | -2.46±9.57 | 1.19±8.10 | 0.047 |
| LVEDD/mm | |||||
| Baseline | 50.56±6.50 | 49.84±6.06 | 52.46±5.45 | 49.87±4.01 | 0.051 |
| Follow-up | 49.76±6.99 | 50.00±5.93 | 52.07±4.41 | 50.91±4.13 | 0.118 |
| Δ | -0.80±3.46 | 0.16±3.03 | -0.39±3.49 | 1.04±3.31 | 0.027 |
| LVESD/mm | |||||
| Baseline | 34.44±7.14 | 33.88±6.55 | 35.91±6.33 | 33.39±4.15 | 0.168 |
| Follow-up | 33.64±7.40 | 33.91±6.31 | 35.00±4.67 | 33.72±4.64 | 0.599 |
| Δ | -0.80±2.59 | 0.04±2.91 | -0.91±3.67 | 0.33±4.11 | 0.147 |
| IVST/mm | |||||
| Baseline | 9.36±1.01 | 9.32±1.16 | 9.93±1.53 | 9.46±1.30 | 0.050 |
| Follow-up | 9.33±1.02 | 9.11±1.14 | 9.54±1.22 | 9.46±1.19 | 0.216 |
| Δ | -0.04±0.90 | -0.21±0.99 | -0.39±1.17 | 0±1.17 | 0.204 |
| LVPWT/mm | |||||
| Baseline | 8.93±0.63 | 8.66±0.84 | 9.33±0.95 | 9.00±1.18 | 0.002 |
| Follow-up | 8.87±0.75 | 8.79±0.85 | 9.13±0.97 | 8.91±0.96 | 0.216 |
| Δ | -0.05±0.65 | 0.12±0.72 | -0.20±0.88 | -0.09±1.15 | 0.255 |
| LVMI/(g·mm-2) | |||||
| Baseline | 96.11±24.27 | 90.16±18.38 | 103.38±28.52 | 86.74±18.06 | 0.001 |
| Follow-up | 92.94±24.73 | 90.57±21.50 | 97.43±22.24 | 89.89±20.66 | 0.288 |
| Δ | -3.17±15.22 | 0.42±12.82 | -5.95±14.79 | 3.15±15.28 | 0.008 |
| LVEF/% | |||||
| Baseline | 57.85±8.97 | 58.20±8.85 | 56.69±9.80 | 59.31±8.09 | 0.500 |
| Follow-up | 58.44±9.98 | 57.91±9.55 | 58.33±8.33 | 60.24±7.33 | 0.531 |
| Δ | 0.58±4.89 | -0.29±4.77 | 1.65±3.89 | 0.93±7.08 | 0.285 |
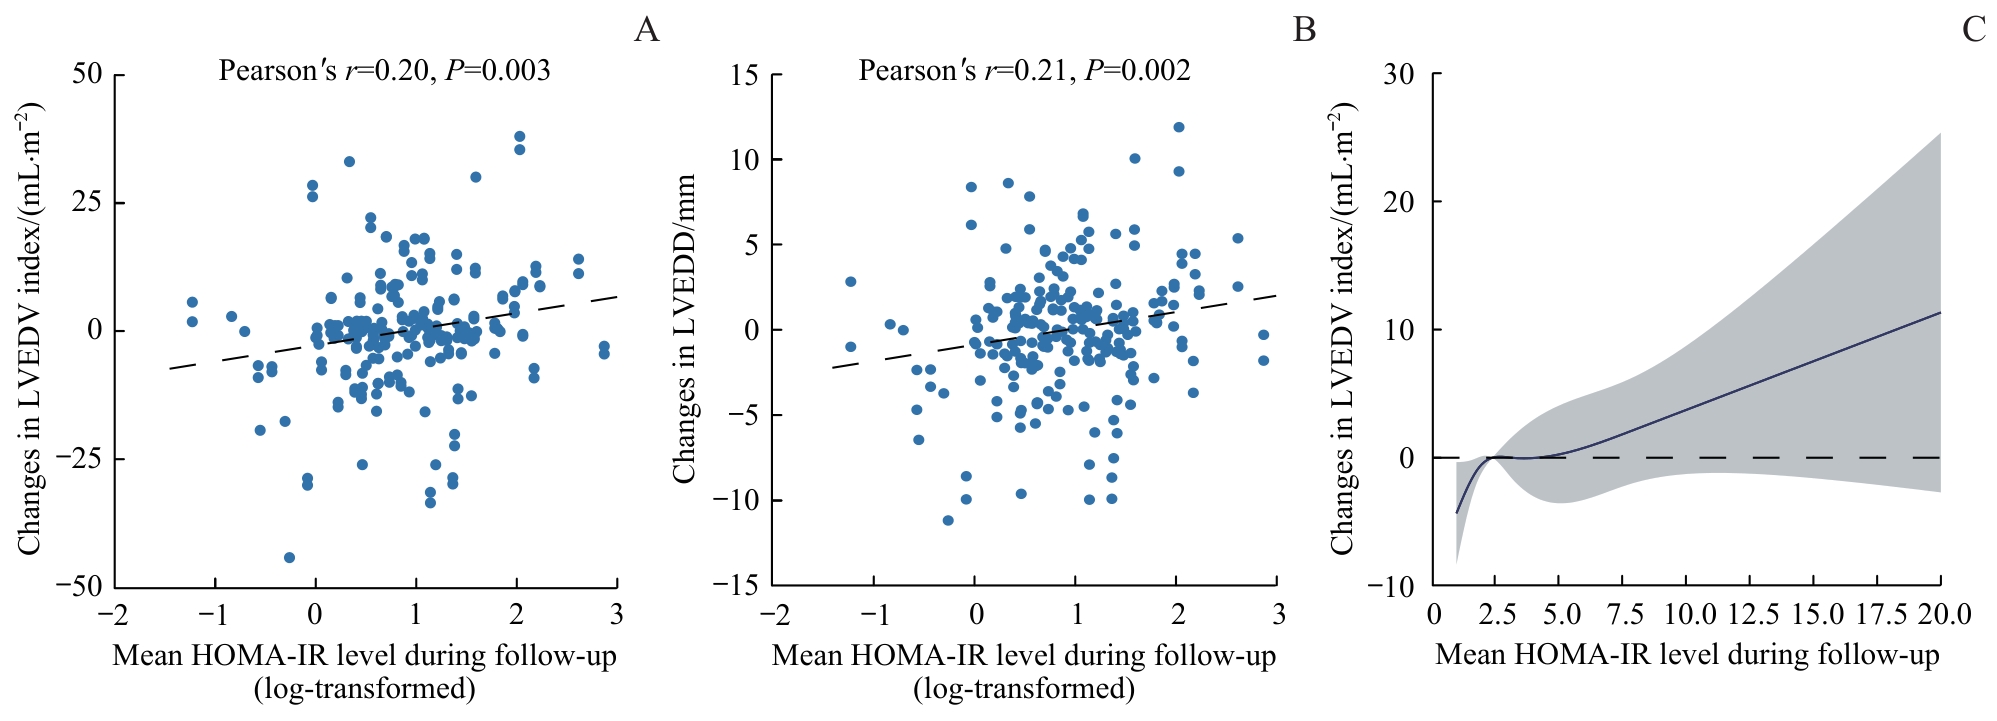
图3 随访期间平均HOMA-IR水平与左室重构的相关性Note: A/B. Correlation analysis between the mean HOMA-IR levels (log-transformed) and changes in LVEDV index (A) and LVEDD (B). C. The non-linear association between mean HOMA-IR levels and changes in LVEDV index. When the mean HOMA-IR levels were above 3.79, the changes in LVEDV index increased significantly with increasing HOMA-IR.
Fig 3 Correlation between mean HOMA-IR and LV remodeling
| Mean HOMA-IR level | Model 1 | Model 2 | Model 3 | Model 4 | Model 5 |
|---|---|---|---|---|---|
| Low (≤1.58) | Reference | Reference | Reference | Reference | Reference |
| Low-medium (>1.58 and ≤2.41) | |||||
| Coefficient (95%CI) | 3.608 (-0.515‒7.730) | 3.506 (-0.645‒7.657) | 4.036 (-0.206‒8.279) | 5.541 (1.169‒9.914) | 3.036 (-1.373‒7.445) |
| Standardized β | 0.141 | 0.137 | 0.157 | 0.216 | 0.118 |
| P value | 0.086 | 0.097 | 0.062 | 0.013 | 0.176 |
| Medium-high (>2.41 and ≤3.98) | |||||
| Coefficient (95%CI) | 1.201 (-2.959‒5.361) | 1.199 (-2.990‒5.388) | 1.918 (-2.434‒6.270) | 2.386 (-1.915‒6.688) | 2.674 (-1.492‒6.839) |
| Standardized β | 0.046 | 0.046 | 0.074 | 0.092 | 0.103 |
| P value | 0.570 | 0.573 | 0.386 | 0.275 | 0.207 |
| High (>3.98) | |||||
| Coefficient (95%CI) | 6.492 (2.332‒10.652) | 6.453 (2.266‒10.641) | 7.348 (2.786‒11.910) | 8.028 (3.530‒12.526) | 7.727 (3.317‒12.136) |
| Standardized β | 0.250 | 0.248 | 0.283 | 0.309 | 0.298 |
| P value | 0.002 | 0.003 | 0.002 | <0.001 | <0.001 |
表3 STEMI后ΔLVEDV与HOMA-IR平均水平的多元线性回归分析
Tab 3 Multivariate linear regression analysis for ∆LVEDV index and HOMA-IR levels after STEMI
| Mean HOMA-IR level | Model 1 | Model 2 | Model 3 | Model 4 | Model 5 |
|---|---|---|---|---|---|
| Low (≤1.58) | Reference | Reference | Reference | Reference | Reference |
| Low-medium (>1.58 and ≤2.41) | |||||
| Coefficient (95%CI) | 3.608 (-0.515‒7.730) | 3.506 (-0.645‒7.657) | 4.036 (-0.206‒8.279) | 5.541 (1.169‒9.914) | 3.036 (-1.373‒7.445) |
| Standardized β | 0.141 | 0.137 | 0.157 | 0.216 | 0.118 |
| P value | 0.086 | 0.097 | 0.062 | 0.013 | 0.176 |
| Medium-high (>2.41 and ≤3.98) | |||||
| Coefficient (95%CI) | 1.201 (-2.959‒5.361) | 1.199 (-2.990‒5.388) | 1.918 (-2.434‒6.270) | 2.386 (-1.915‒6.688) | 2.674 (-1.492‒6.839) |
| Standardized β | 0.046 | 0.046 | 0.074 | 0.092 | 0.103 |
| P value | 0.570 | 0.573 | 0.386 | 0.275 | 0.207 |
| High (>3.98) | |||||
| Coefficient (95%CI) | 6.492 (2.332‒10.652) | 6.453 (2.266‒10.641) | 7.348 (2.786‒11.910) | 8.028 (3.530‒12.526) | 7.727 (3.317‒12.136) |
| Standardized β | 0.250 | 0.248 | 0.283 | 0.309 | 0.298 |
| P value | 0.002 | 0.003 | 0.002 | <0.001 | <0.001 |
| 1 | JENČA D, MELENOVSKÝ V, STEHLIK J, et al. Heart failure after myocardial infarction: incidence and predictors[J]. ESC Heart Fail, 2021, 8(1): 222-237. |
| 2 | FRANTZ S, HUNDERTMARK M J, SCHULZ-MENGER J, et al. Left ventricular remodelling post-myocardial infarction: pathophysiology, imaging, and novel therapies[J]. Eur Heart J, 2022, 43(27): 2549-2561. |
| 3 | YAP J, IREI J, LOZANO-GERONA J, et al. Macrophages in cardiac remodelling after myocardial infarction[J]. Nat Rev Cardiol, 2023, 20(6): 373-385. |
| 4 | QUIJADA P, PARK S, ZHAO P, et al. Cardiac pericytes mediate the remodeling response to myocardial infarction[J]. J Clin Invest, 2023, 133(10): e162188. |
| 5 | BULLUCK H, CARBERRY J, CARRICK D, et al. Redefining adverse and reverse left ventricular remodeling by cardiovascular magnetic resonance following ST-segment-elevation myocardial infarction and their implications on long-term prognosis[J]. Circ Cardiovasc Imaging, 2020, 13(7): e009937. |
| 6 | BOSTAN M M, STĂTESCU C, ANGHEL L, et al. Post-myocardial infarction ventricular remodeling biomarkers-the key link between pathophysiology and clinic[J]. Biomolecules, 2020, 10(11): 1587. |
| 7 | YANG C D, SHEN Y, DING F H, et al. Visit-to-visit fasting plasma glucose variability is associated with left ventricular adverse remodeling in diabetic patients with STEMI[J]. Cardiovasc Diabetol, 2020, 19(1): 131. |
| 8 | LEE S H, PARK S Y, CHOI C S. Insulin resistance: from mechanisms to therapeutic strategies[J]. Diabetes Metab J, 2022, 46(1): 15-37. |
| 9 | DI PINO A, DEFRONZO R A. Insulin resistance and atherosclerosis: implications for insulin-sensitizing agents[J]. Endocr Rev, 2019, 40(6): 1447-1467. |
| 10 | ROKICKA D, HUDZIK B, WRÓBEL M, et al. The prognostic impact of insulin resistance surrogates in patients with acute myocardial infarction with and without type 2 diabetes[J]. Cardiovasc Diabetol, 2024, 23(1): 147. |
| 11 | JIANG H D, LIU Y T, GUO H Y, et al. The association between the triglyceride-glucose index and in-stent restenosis in patients undergoing percutaneous coronary intervention: a systematic review and meta-analysis[J]. BMC Cardiovasc Disord, 2024, 24(1): 234. |
| 12 | SUNDSTRÖM J, LIND L, NYSTRÖM N, et al. Left ventricular concentric remodeling rather than left ventricular hypertrophy is related to the insulin resistance syndrome in elderly men[J]. Circulation, 2000, 101(22): 2595-2600. |
| 13 | PARIZO J, MAHAFFEY K W. Diabetes and heart failure post-acute myocardial infarction: important associations and need for evidence-based interventions[J]. Eur J Prev Cardiol, 2020, 27(17): 1887-1889. |
| 14 | INGELSSON E, SUNDSTRÖM J, ARNLÖV J, et al. Insulin resistance and risk of congestive heart failure[J]. JAMA, 2005, 294(3): 334-341. |
| 15 | SHAH R V, ABBASI S A, HEYDARI B, et al. Insulin resistance, subclinical left ventricular remodeling, and the obesity paradox: MESA (Multi-Ethnic Study of Atherosclerosis)[J]. J Am Coll Cardiol, 2013, 61(16): 1698-1706. |
| 16 | QIAO T T, LUO T, PEI H L, et al. Association between abdominal obesity indices and risk of cardiovascular events in Chinese populations with type 2 diabetes: a prospective cohort study[J]. Cardiovasc Diabetol, 2022, 21(1): 225. |
| 17 | LIU Y K, LING S S, LUI L M W, et al. Prevalence of type 2 diabetes mellitus, impaired fasting glucose, general obesity, and abdominal obesity in patients with bipolar disorder: a systematic review and meta-analysis[J]. J Affect Disord, 2022, 300: 449-461. |
| 18 | WAN H, WANG Y Y, XIANG Q, et al. Associations between abdominal obesity indices and diabetic complications: Chinese visceral adiposity index and neck circumference[J]. Cardiovasc Diabetol, 2020, 19(1): 118. |
| 19 | MOHAMMADI H, OHM J, DISCACCIATI A, et al. Abdominal obesity and the risk of recurrent atherosclerotic cardiovascular disease after myocardial infarction[J]. Eur J Prev Cardiol, 2020, 27(18): 1944-1952. |
| 20 | POWELL-WILEY T M, POIRIER P, BURKE L E, et al. Obesity and cardiovascular disease: a scientific statement from the American heart association[J]. Circulation, 2021, 143(21): e984-e1010. |
| 21 | DALE ABEL E. Insulin signaling in the heart[J]. Am J Physiol Endocrinol Metab, 2021, 321(1): E130-E145. |
| 22 | TRIFUNOVIC D, STANKOVIC S, SOBIC-SARANOVIC D, et al. Acute insulin resistance in ST-segment elevation myocardial infarction in non-diabetic patients is associated with incomplete myocardial reperfusion and impaired coronary microcirculatory function[J]. Cardiovasc Diabetol, 2014, 13: 73. |
| 23 | THAKKER G D, FRANGOGIANNIS N G, BUJAK M, et al. Effects of diet-induced obesity on inflammation and remodeling after myocardial infarction[J]. Am J Physiol Heart Circ Physiol, 2006, 291(5): H2504-H2514. |
| 24 | MENG Z J, ZHANG Z, ZHAO J L, et al. Nitrative modification of caveolin-3: a novel mechanism of cardiac insulin resistance and a potential therapeutic target against ischemic heart failure in prediabetic animals[J]. Circulation, 2023, 147(15): 1162-1179. |
| [1] | 徐州琳, 尹高生, 李沅聪, 杨云恒, 郑琦, 杨萍. 天麻素调控自噬在心肌梗死后骨骼肌萎缩中的作用研究[J]. 上海交通大学学报(医学版), 2026, 46(3): 301-311. |
| [2] | 李文丽, 金力行, 赵怡超, 钟方元, 石瑶, 雷杰, 卜军, 葛恒. 基于心脏磁共振评估左心室心肌应变损伤对STEMI急性期继发性三尖瓣反流的影响[J]. 上海交通大学学报(医学版), 2025, 45(12): 1578-1588. |
| [3] | 阮青青, 苏树智, 李延婷, 任渊, 戴勇, 乔增勇. 急性心肌梗死介入治疗并发症风险预测模型构建[J]. 上海交通大学学报(医学版), 2025, 45(12): 1589-1597. |
| [4] | 姜凯, 徐越, 杨兴博, 王丹丹, 项耀祖. 心肌梗死后造血失衡介导的心室重构:免疫细胞亚群的作用与干预新策略[J]. 上海交通大学学报(医学版), 2025, 45(12): 1644-1653. |
| [5] | 范冰彬, 何玉虎. 线粒体自噬在动脉型肺动脉高压中作用的研究进展[J]. 上海交通大学学报(医学版), 2025, 45(12): 1654-1661. |
| [6] | 黄铭望, 贾康妮, 闫小响. 基于昼夜节律基因的心肌梗死机制及治疗策略[J]. 上海交通大学学报(医学版), 2025, 45(12): 1671-1678. |
| [7] | 刘雨婷, 俞莞琦, 洪雯, 康桑, 李歆旎, 旦增曲央, 肖活源, 潘静薇. 临床衰弱指数对急性心肌梗死患者在院心脏康复后远期预后的预测价值[J]. 上海交通大学学报(医学版), 2024, 44(5): 599-605. |
| [8] | 郑梦奕, 毛家亮, 邹治国, 张瑞雷, 张厚, 李世光. 全身免疫炎症指数及躯体化症状评分对首发心梗PCI术后发生院内主要不良心血管事件的预测价值[J]. 上海交通大学学报(医学版), 2024, 44(3): 334-341. |
| [9] | 石翠翠, 张洁, 黄鹤鸣, 桑玉尔, 李光明. 肝硬化患者胰岛素抵抗的临床分析[J]. 上海交通大学学报(医学版), 2023, 43(2): 188-193. |
| [10] | 刘薇薇, 王龙. 女性绝经与非酒精性脂肪性肝病的关系及相关治疗的研究进展[J]. 上海交通大学学报(医学版), 2023, 43(1): 125-131. |
| [11] | 胡晓, 张鑫, 谷阳. 体质量与C1q肿瘤坏死因子相关蛋白1在心肌梗死患者中的交互作用[J]. 上海交通大学学报(医学版), 2022, 42(6): 786-791. |
| [12] | 许莉, 杨艳, 陈菡芬, 姜萌, 卜军. 急性心肌梗死患者于心脏康复中心就诊的影响因素及效果评价[J]. 上海交通大学学报(医学版), 2022, 42(5): 646-652. |
| [13] | 胡培堃, 何杰, 吴连明, 葛恒, 许建荣, 卜军. ST段抬高型心肌梗死患者微血管阻塞对左室功能及预后的影响[J]. 上海交通大学学报(医学版), 2021, 41(2): 173-179. |
| [14] | 董建勋, 魏莱, 何杰, 孔令璁, 葛恒, 卜军. 心脏磁共振评估左心室机械不同步的研究进展[J]. 上海交通大学学报(医学版), 2021, 41(12): 1698-1702. |
| [15] | 高亚洁, 马文坤, 高程洁, 周翌, 潘静薇. 心肌应变对急性ST段抬高型心肌梗死后心室重构的预测价值探讨[J]. 上海交通大学学报(医学版), 2021, 41(11): 1478-1484. |
| 阅读次数 | ||||||
|
全文 |
|
|||||
|
摘要 |
|
|||||