上海交通大学学报(医学版) ›› 2025, Vol. 45 ›› Issue (5): 549-561.doi: 10.3969/j.issn.1674-8115.2025.05.003
汤开然( ), 冯成领, 韩邦旻()
收稿日期:2024-10-17
接受日期:2025-01-07
出版日期:2025-05-28
发布日期:2025-05-28
通讯作者:
韩邦旻,主任医师,博士;电子信箱:hanbm@163.com。作者简介:汤开然(1999—),女,博士生;电子信箱:sjtu-tkr-01005@sjtu.edu.cn基金资助:
TANG Kairan(), FENG Chengling, HAN Bangmin()
Received:2024-10-17
Accepted:2025-01-07
Online:2025-05-28
Published:2025-05-28
Contact:
HAN Bangmin, E-mail: hanbm@163.com.Supported by:摘要:
目的·探讨M2巨噬细胞相关基因在前列腺癌(prostate cancer,PCa)中的预后评估价值,以便更准确地预测患者预后并实现个性化治疗。方法·从TCGA数据库下载PCa的普通转录组测序(RNA sequencing,RNA-seq)数据,从GEO数据库获取PCa的单细胞RNA测序(single-cell RNA sequencing,scRNA-seq)数据。通过CIBERSORTx算法评估TCGA样本中的免疫浸润情况,使用FindMarkers功能识别scRNA-seq数据中的差异基因并鉴定免疫细胞亚型,通过基因集富集分析(Gene Set Enrichment Analysis,GSEA)和CellChat算法探究M2巨噬细胞参与通路以及与周围细胞的相互作用情况。最后筛选出M2巨噬细胞特征基因,通过单变量Cox回归和LASSO分析构建PCa预后模型,并基于该模型进行患者临床病理特征分析、免疫抑制与耐药性分析、药物敏感性分析。结果·分析TCGA样本发现,M2巨噬细胞高度浸润的PCa患者显著表现出更低的无进展生存期(progression-free survival,PFS)。分析scRNA-seq发现,肿瘤微环境中的细胞可以分为多个亚群,M2巨噬细胞可以与肿瘤微环境中多种免疫细胞相互作用,促进免疫抑制性微环境的形成,进而发挥促肿瘤关键作用。基于此构建了PCa风险评分模型,模型中包含TREM2、OTOA、SIGLEC1和PLXDC1 4个基因,在测试集与验证集中均表现出良好的预测性能。高风险评分患者的肿瘤微环境呈现免疫抑制特征,并伴有雄激素受体(androgen receptor,AR)信号通路活性降低,同时他们表现出更差的临床分期与病理分级水平,进而导致更差的预后结果。基于药物预测与药物敏感性分析,最终筛选出6种治疗药物对高风险评分患者疗效更佳。结论·基于PCa肿瘤微环境中M2巨噬细胞相关基因构建了一个风险预后模型,为PCa的精准治疗提供了理论基础。
中图分类号:
汤开然, 冯成领, 韩邦旻. 基于单细胞测序与转录组测序构建M2巨噬细胞基因相关的前列腺癌预后模型[J]. 上海交通大学学报(医学版), 2025, 45(5): 549-561.
TANG Kairan, FENG Chengling, HAN Bangmin. Integrated single-cell and transcriptome sequencing to construct a prognostic model of M2 macrophage-related genes in prostate cancer[J]. Journal of Shanghai Jiao Tong University (Medical Science), 2025, 45(5): 549-561.
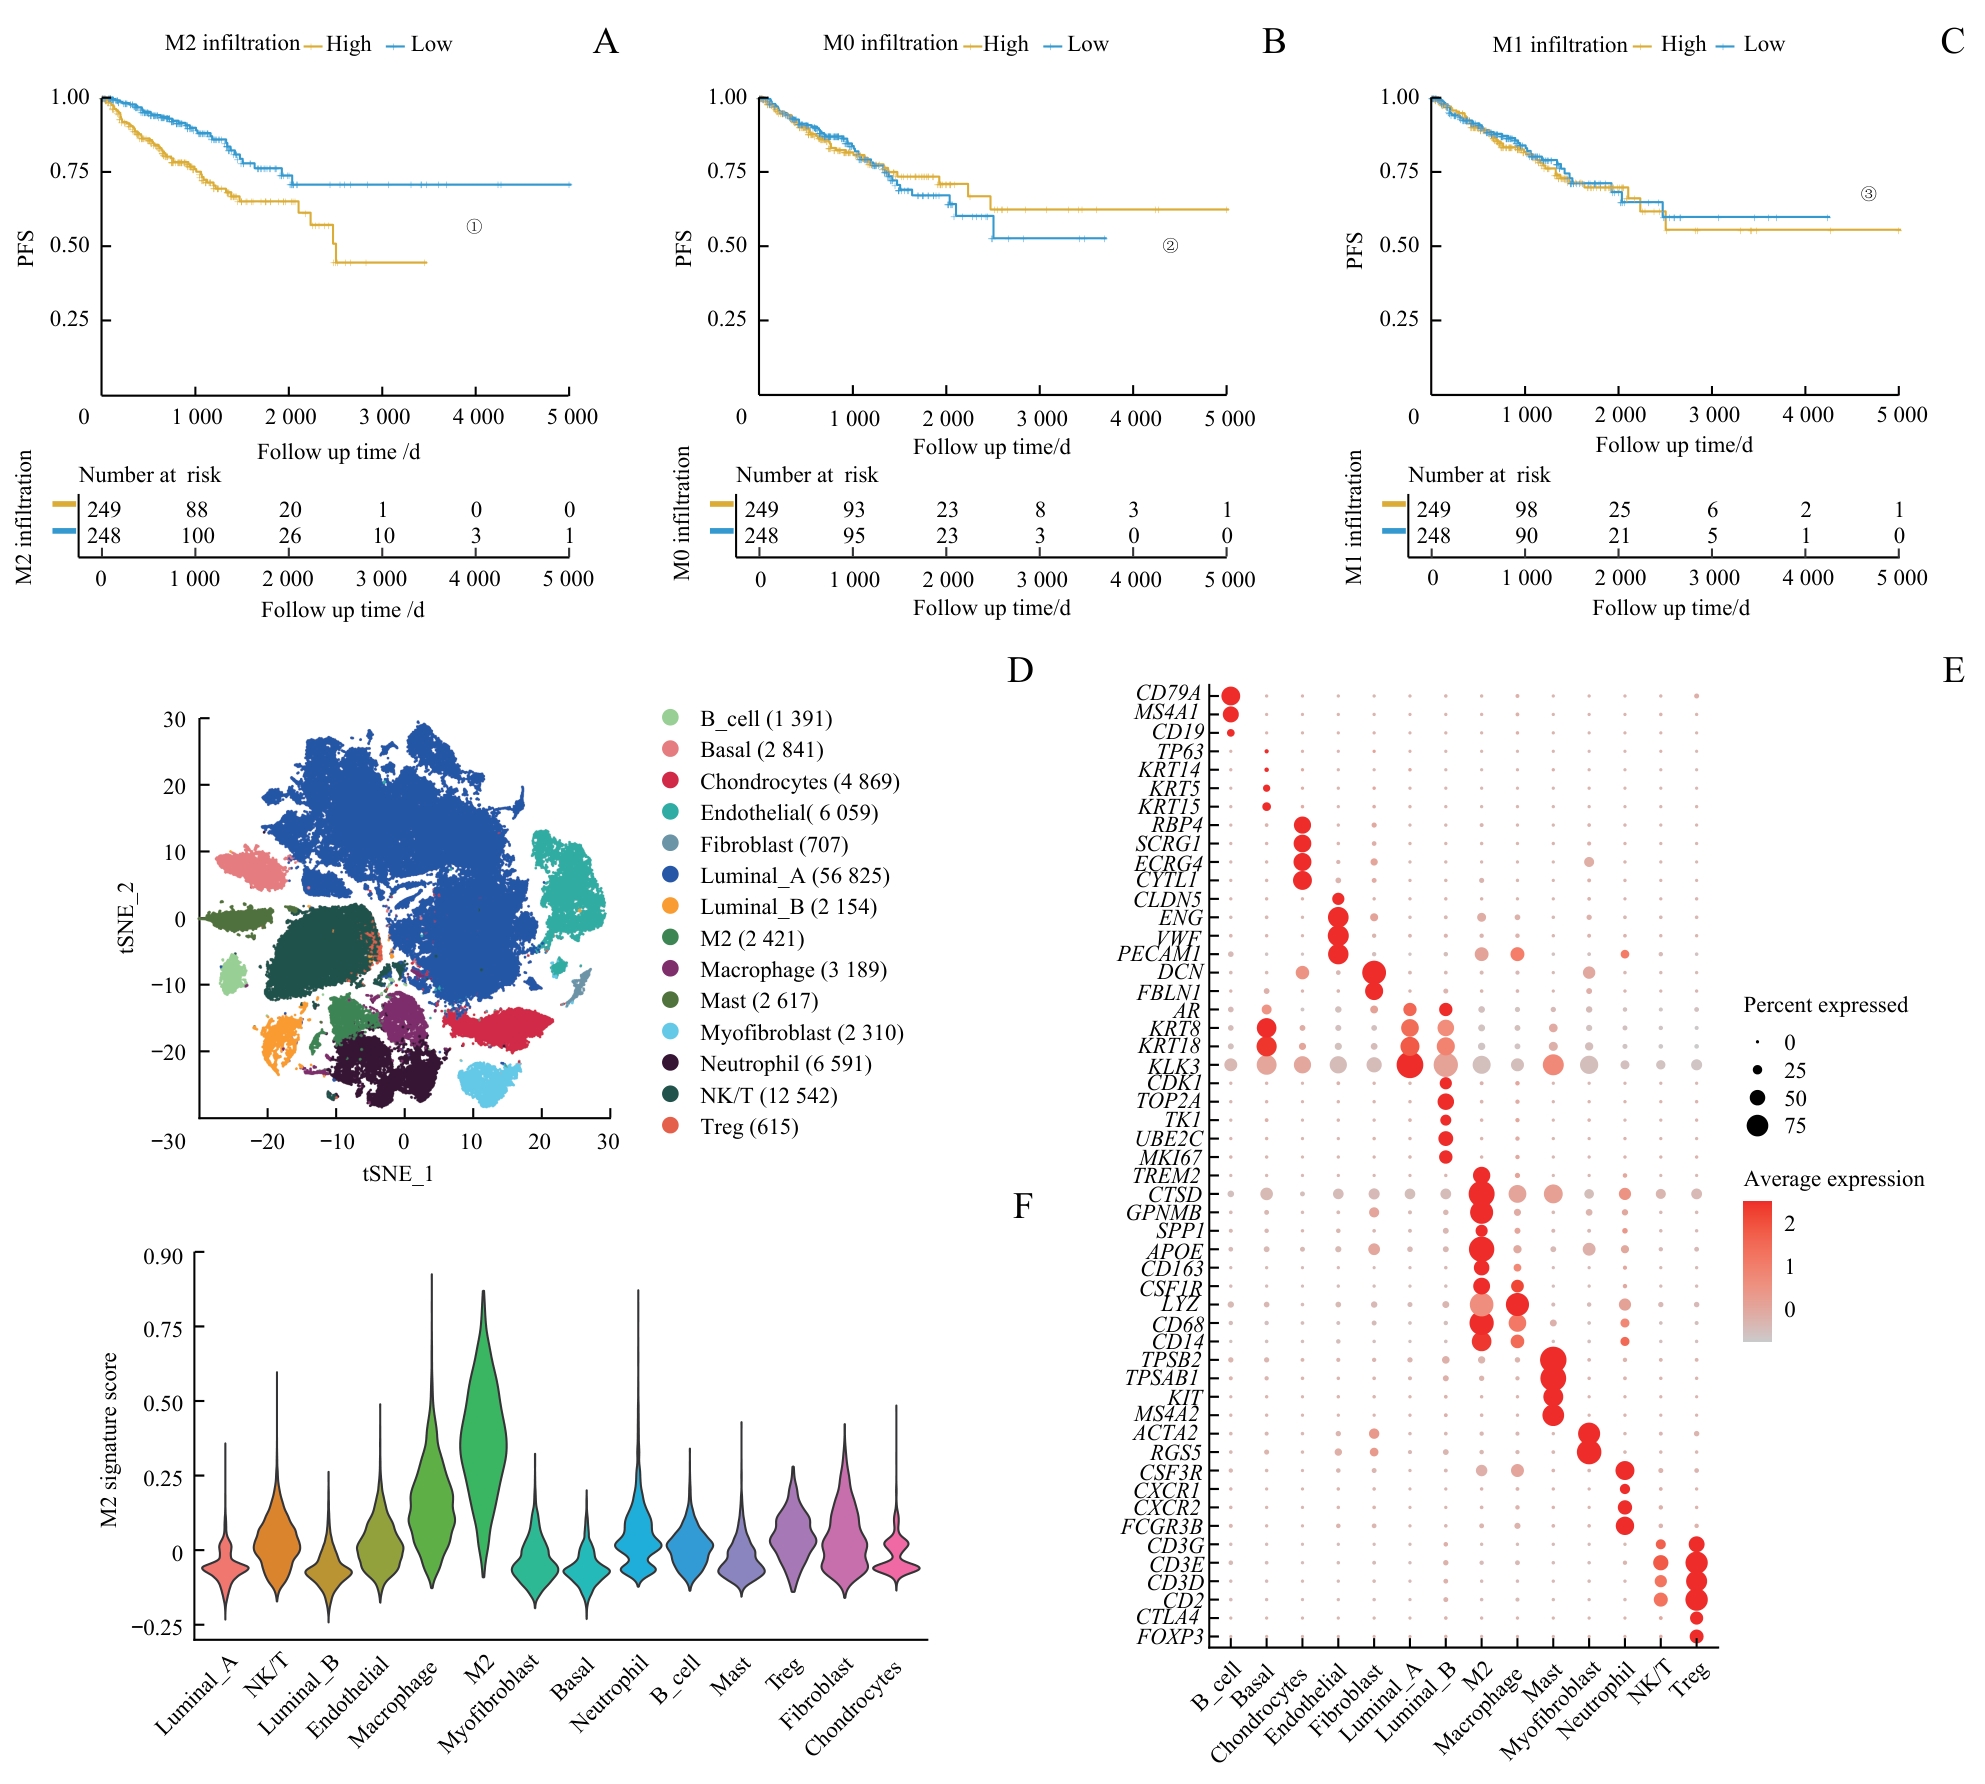
图1 PCa中M2巨噬细胞相关特征的鉴定Note: A‒C.Comparison of PFS between low and high infiltration groups for M2 (A), M0 (B) and M1 (C) macrophages. D. Dimension reduction plot displaying the composition of 14 major cell clusters derived from prostate cancer samples. E. Bubble plot showing the marker genes of each cell cluster. F. Violin plot presenting the M2 signature scores across each cell cluster. ①P<0.001, ②P=0.830, ③P=0.700.
Fig 1 Identification of M2 macrophage-related characteristics in PCa
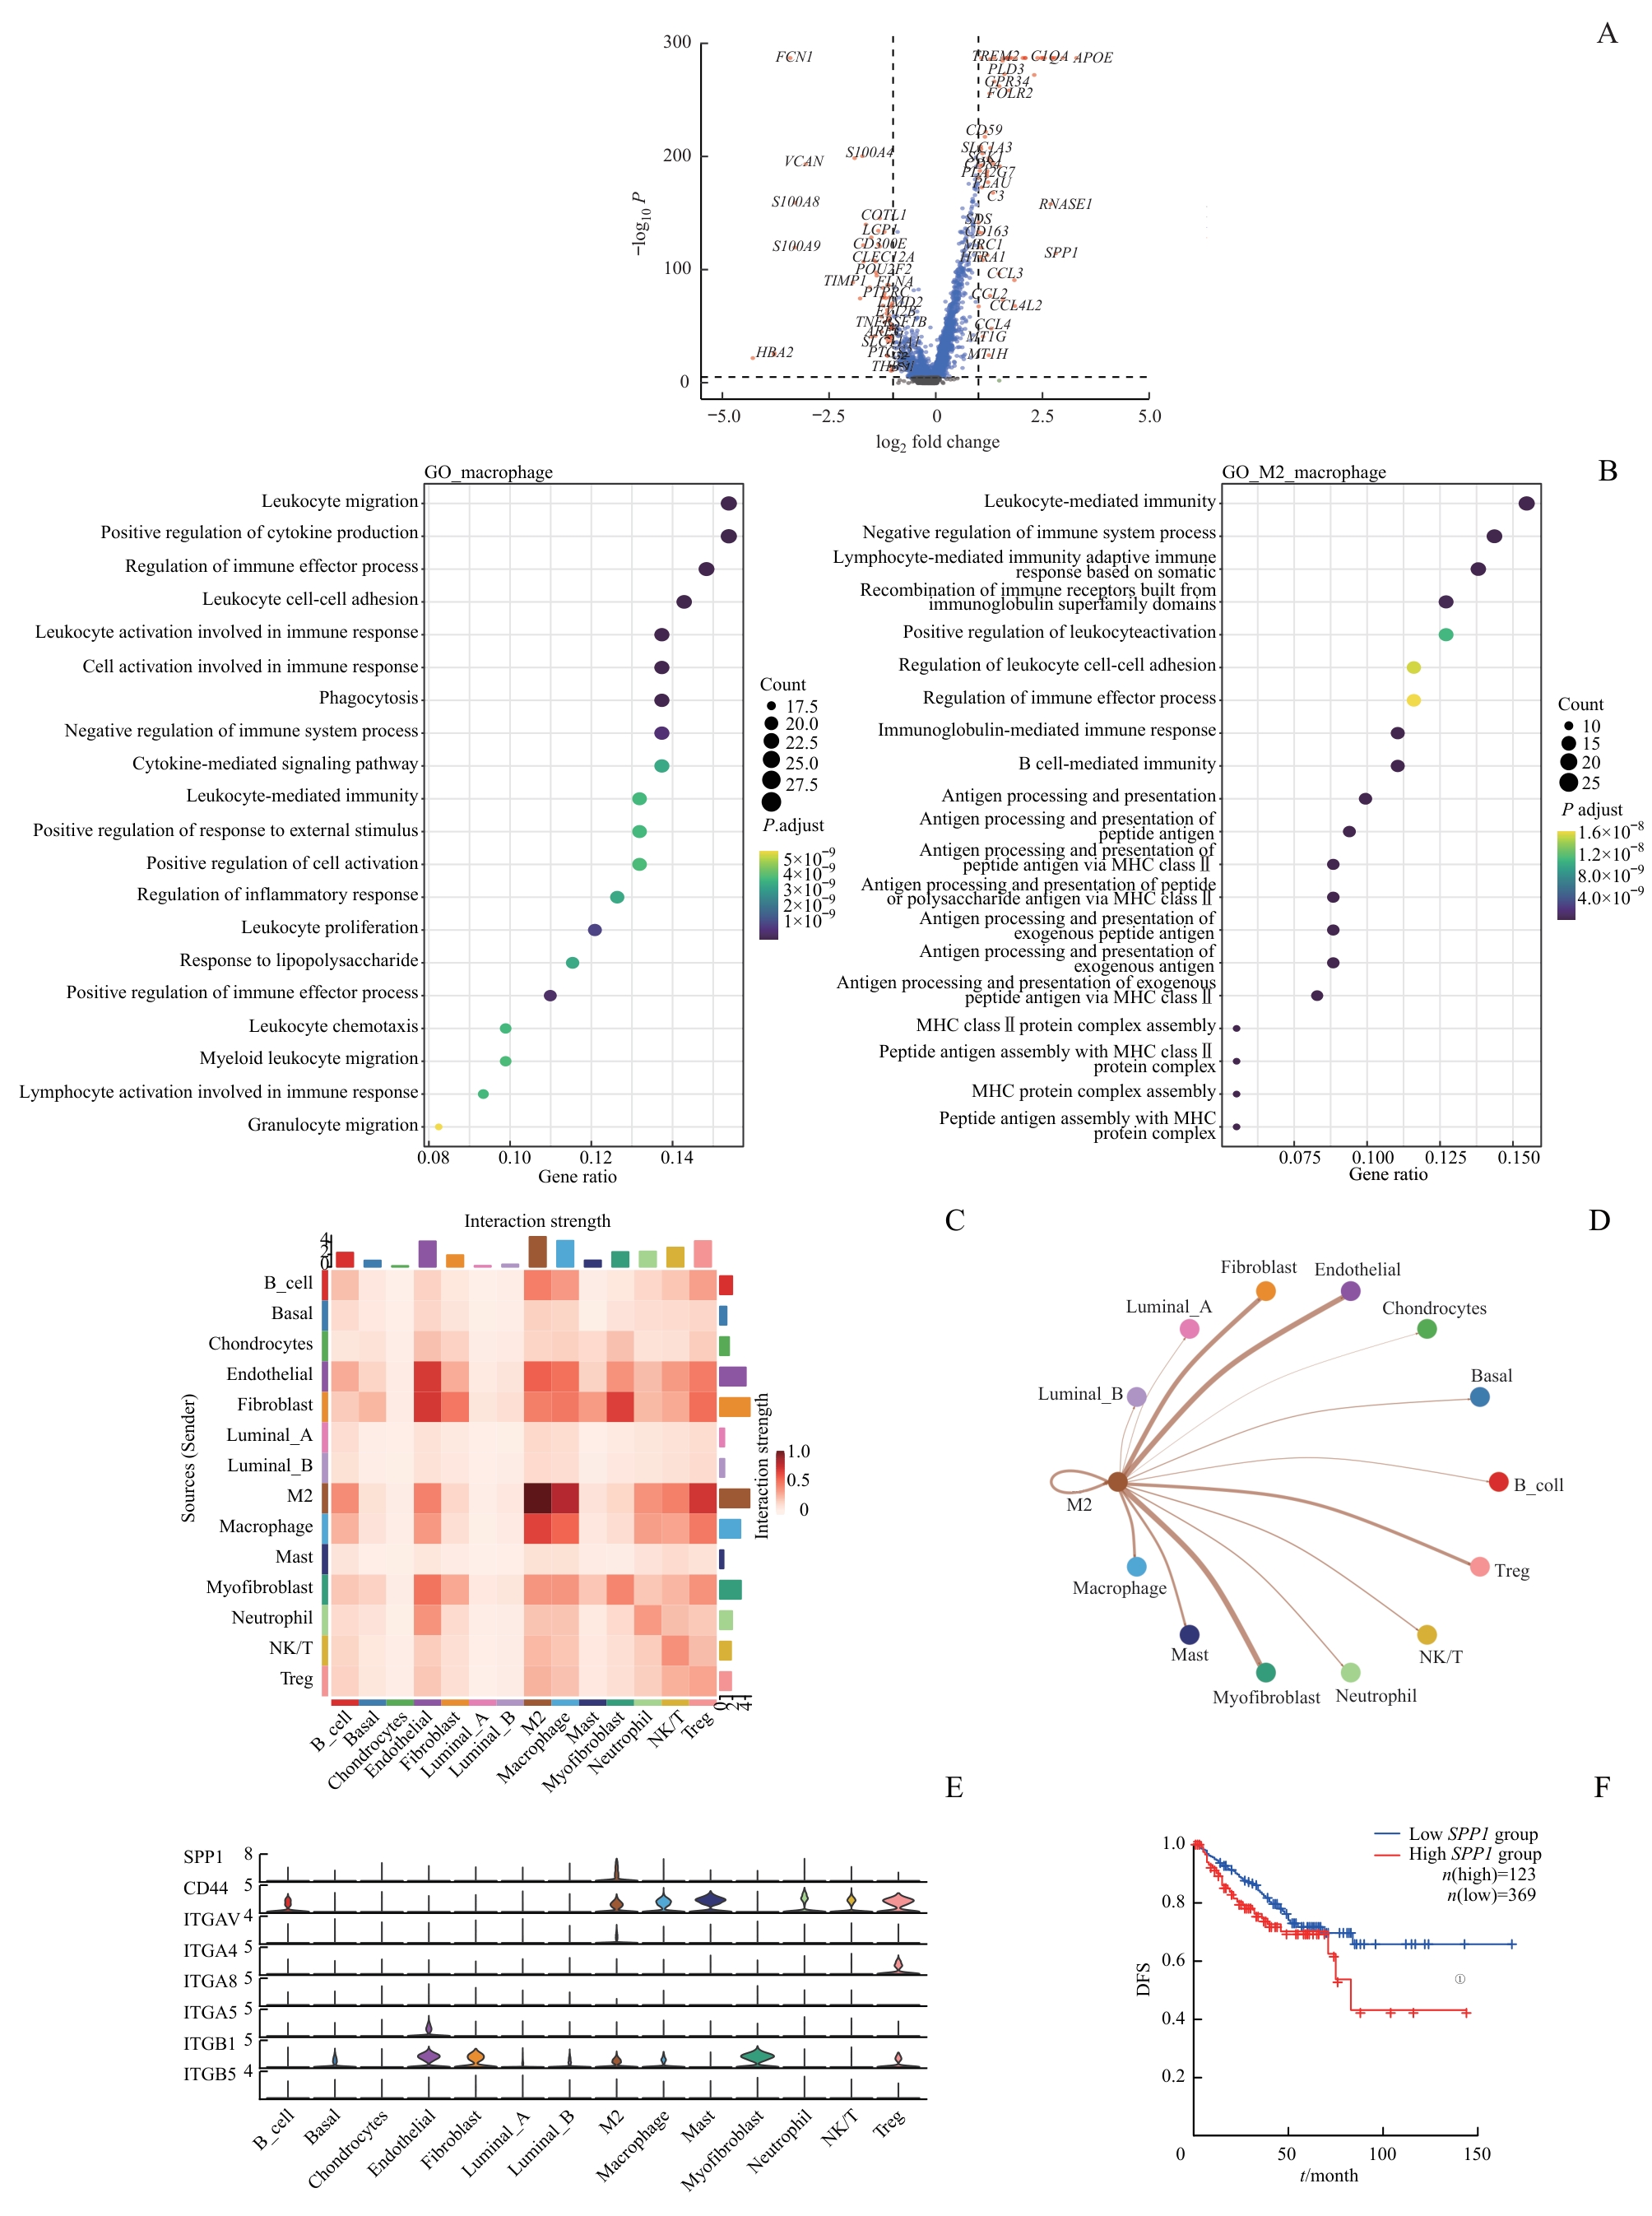
图2 TME中细胞间相互作用分析Note: A. Volcano plot illustrating the differentially expressed genes between M2 macrophages and non-M2 macrophages (genes with significant differences are highlighted in red; non-significant genes in blue). B. Gene enrichment analysis represented as a bubble diagram. C/D. Heatmap (C) and network plot (D)visualizing cell communication in sc-RNA seq. E. Violin plot indicating the predominant secretion of SPP1 by M2 macrophages. F. Kaplan-Meier survival curve showing DFS difference between high and low SPP1 expression groups in the TCGA cohort. ①P=0.034.
Fig 2 Analysis of cell-cell interactions in TME
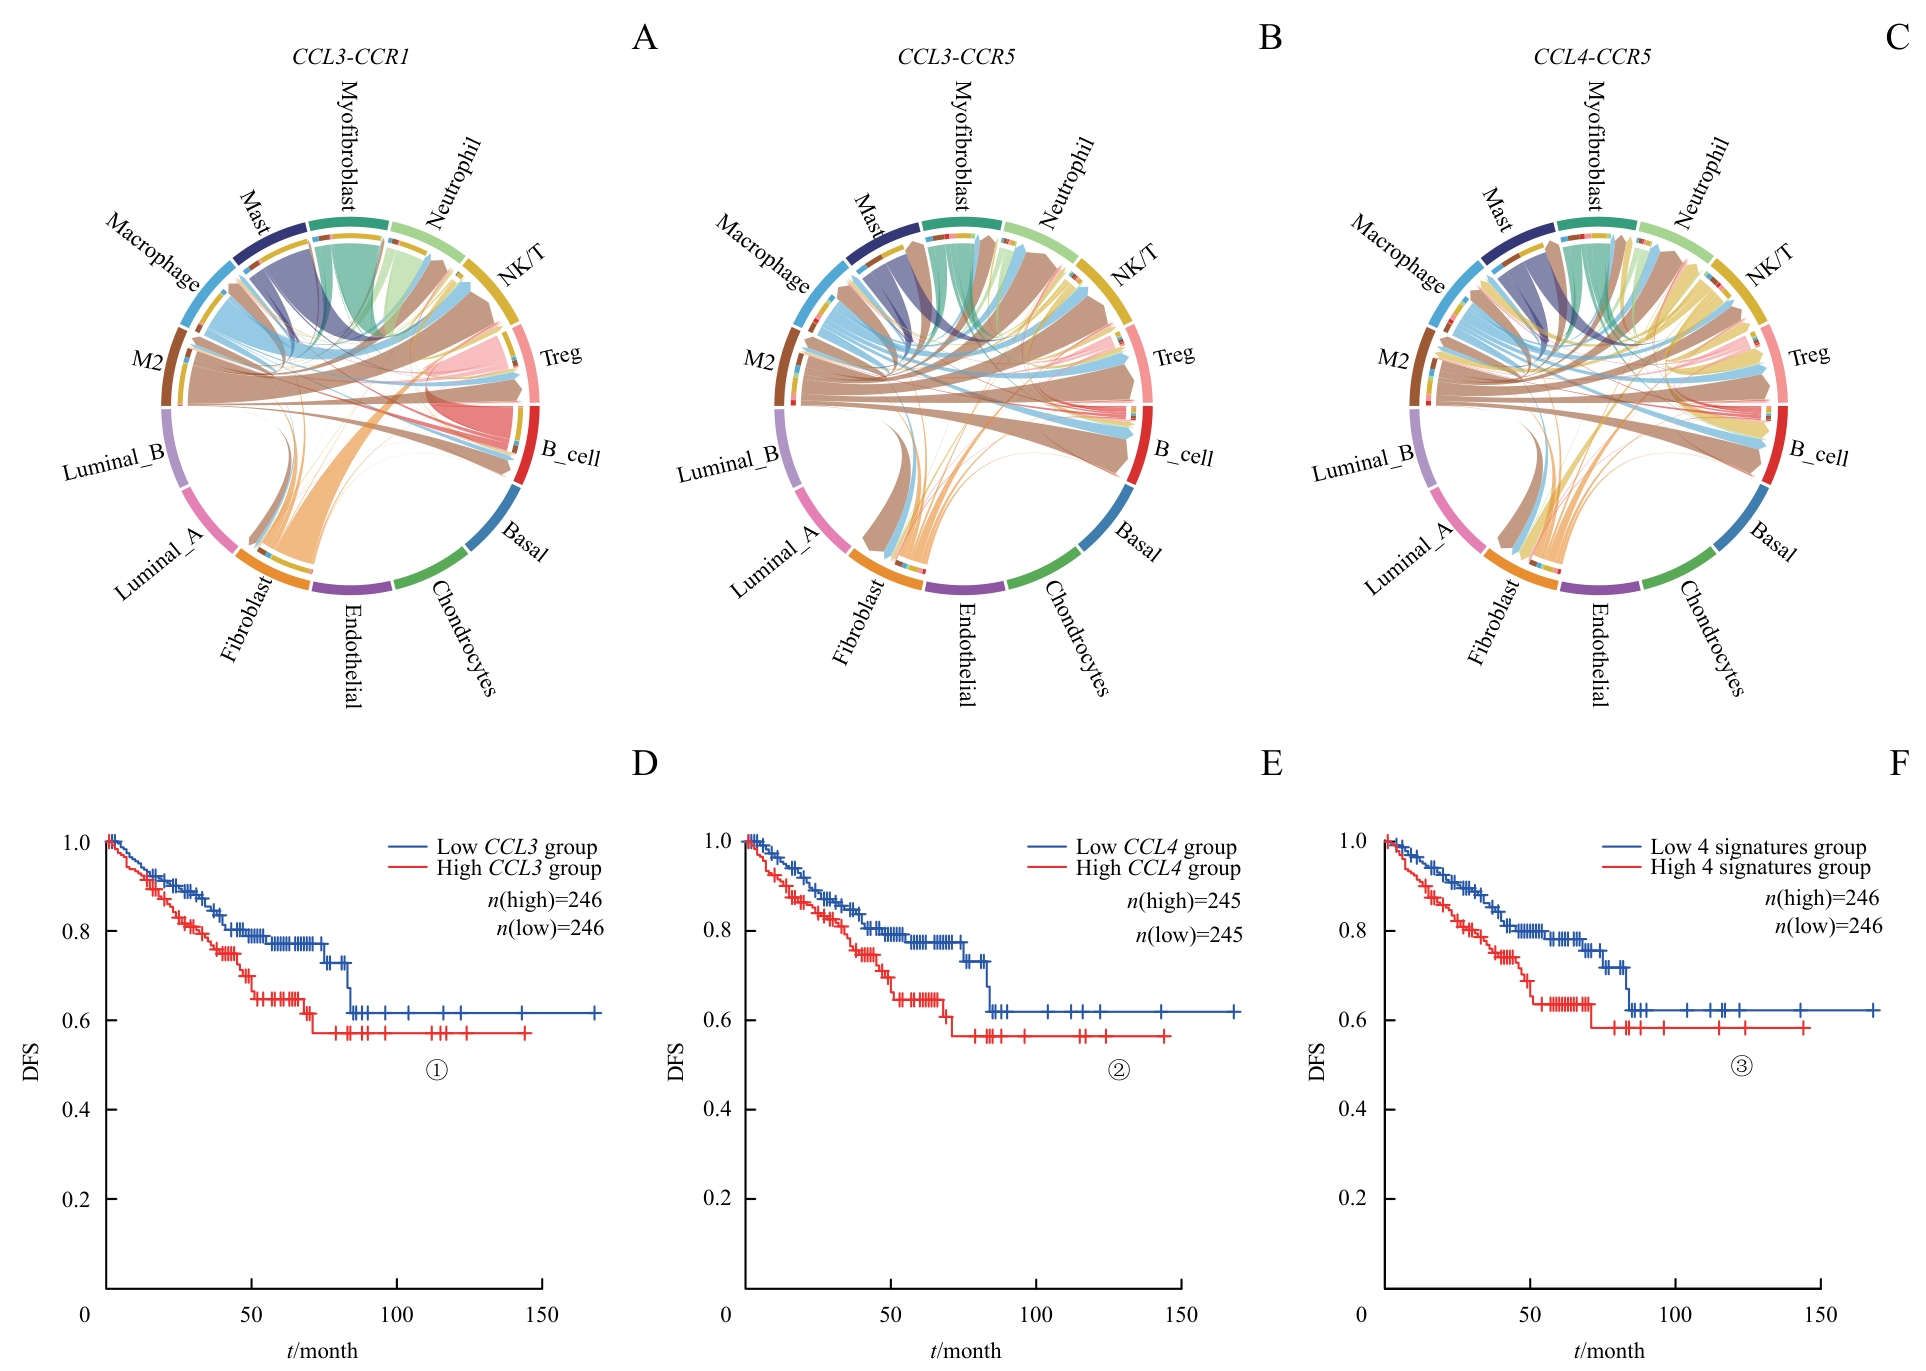
图3 M2巨噬细胞与TME中其他细胞交互的主要通路Note: A‒C. The signals of CCL3 and CCL4 from M2 macrophages primarily targeted NK/T cells, Treg cells and B cells in PCa. D‒F. DFS differences based on these pathways. ①P=0.036, ②P=0.032, ③P=0.013.
Fig 3 Major pathways of interaction between M2 macrophages and other cells in TME
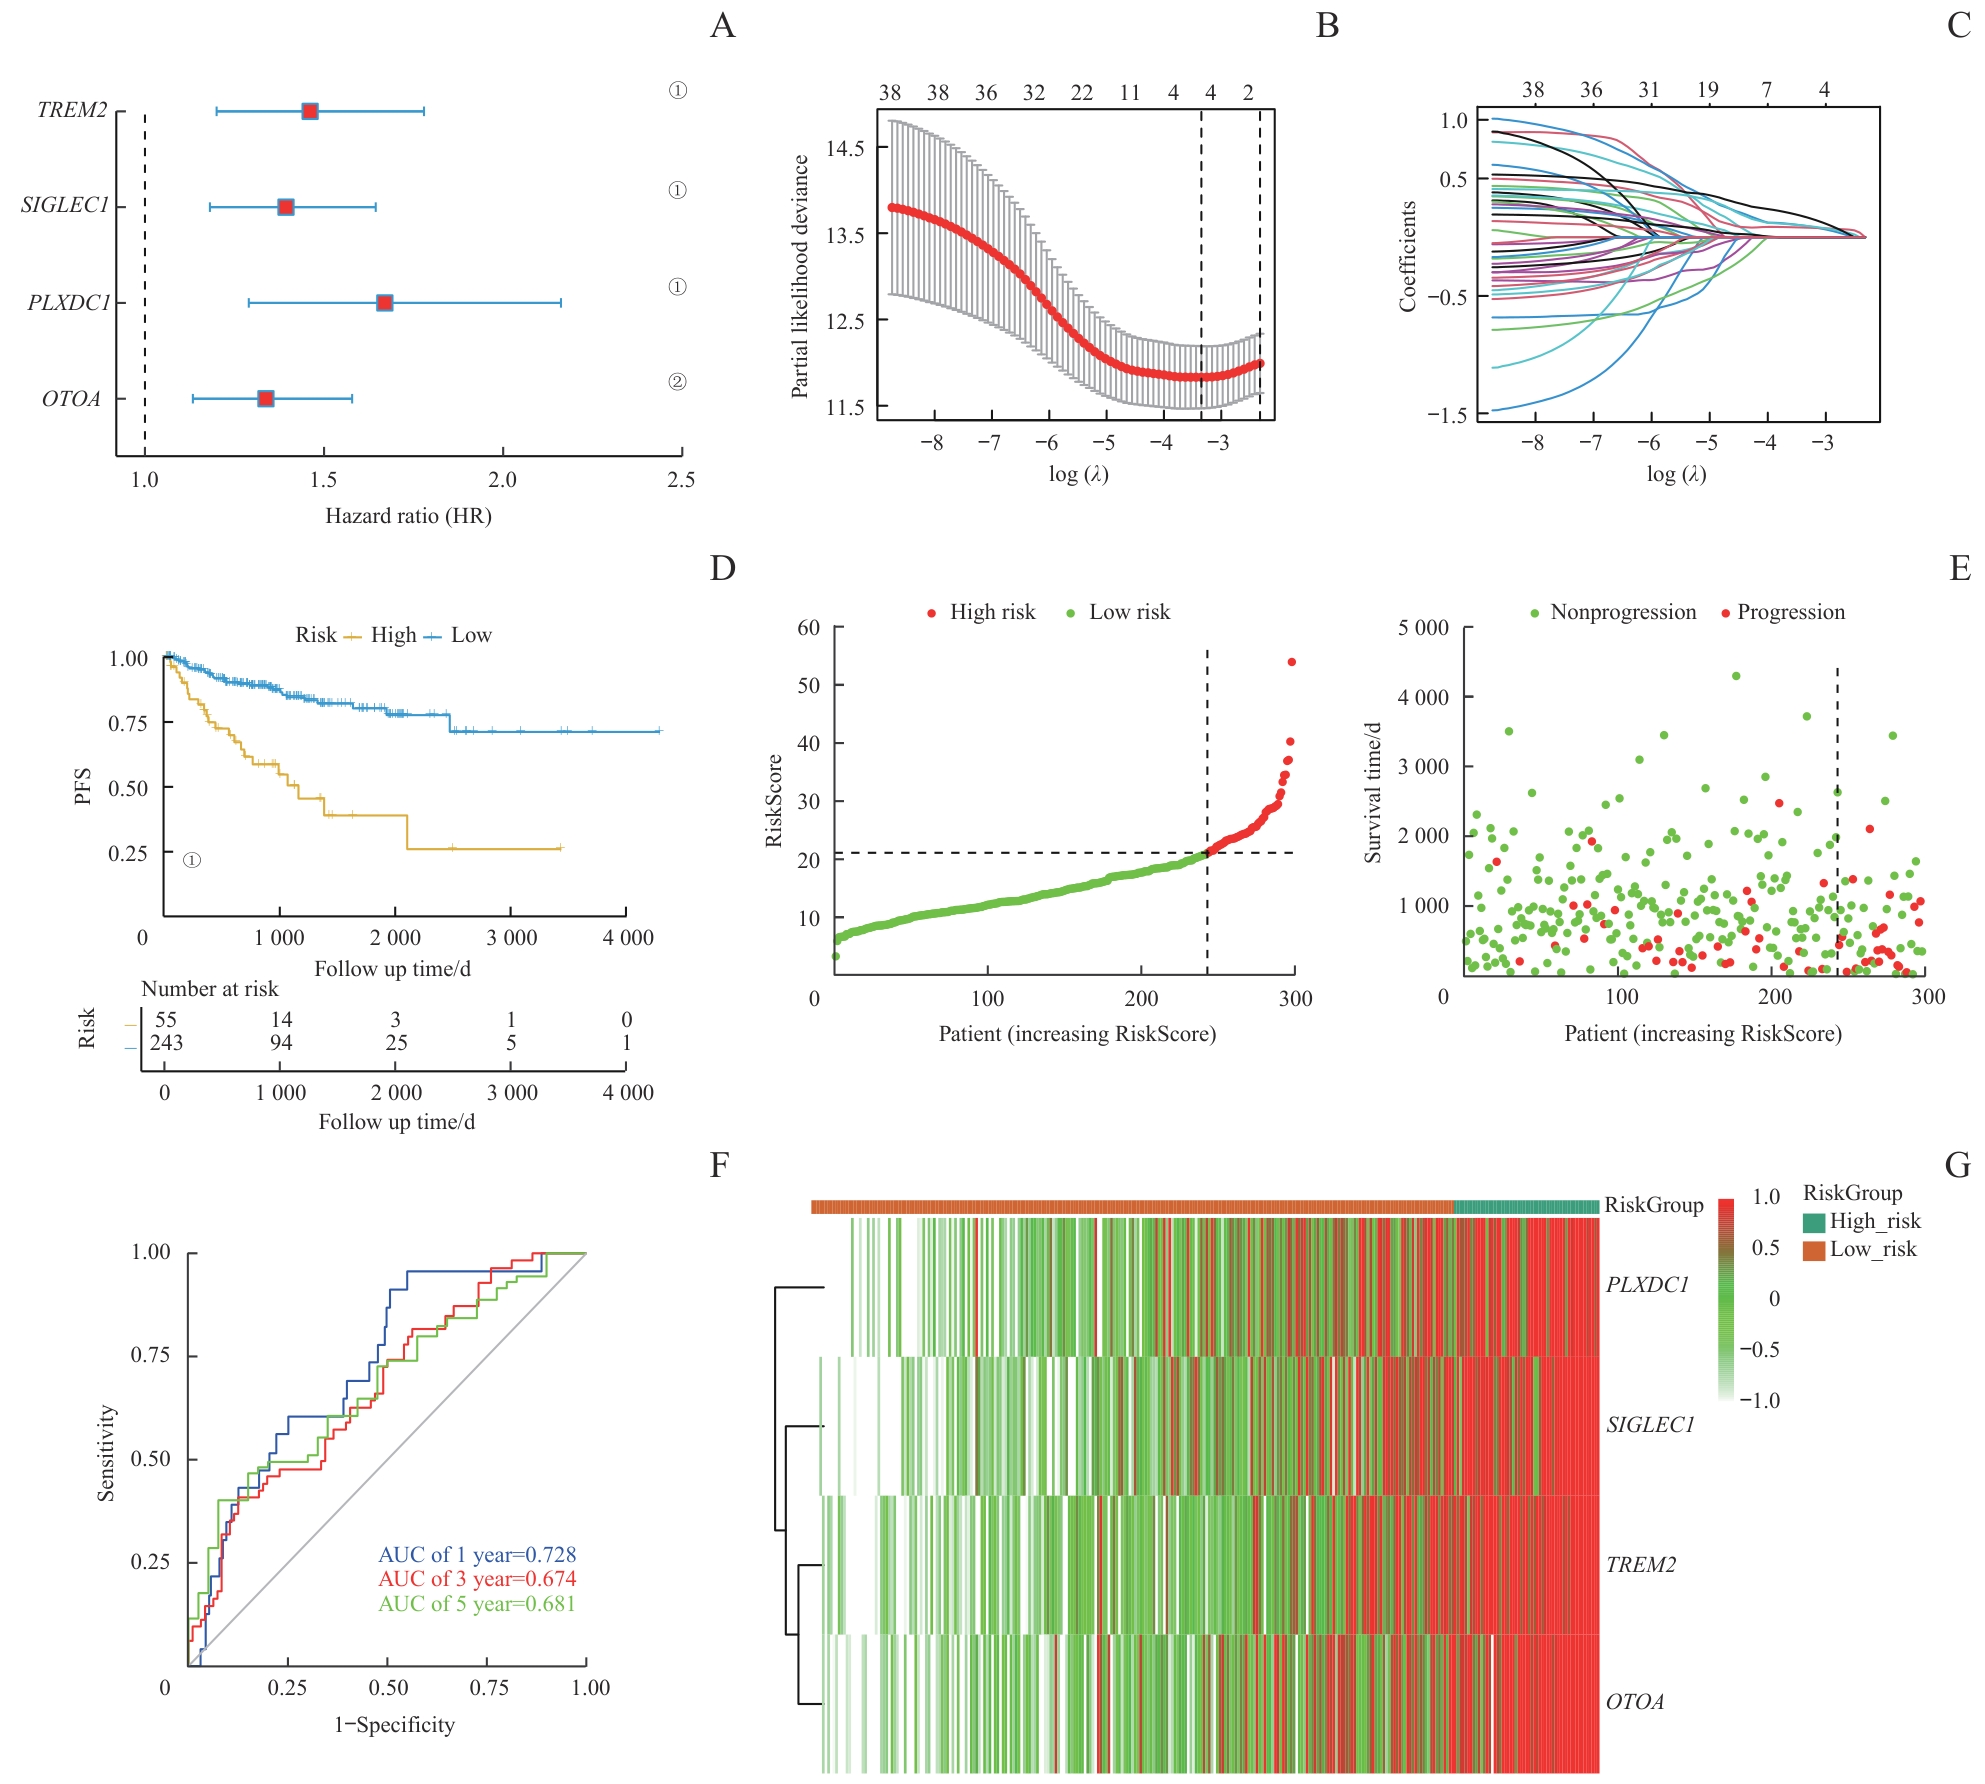
图4 PCa预后模型的构建与测试Note: A. The construction of a LASSO regression model based on four characteristic genes (TREM2, OTOA, SIGLEC1, and PLXDC1). B. Identification process of genes for construction of prognostic risk score signature. C. The coefficients in LASSO Cox regression analysis of the 38 prognostic M2 macrophages-related genes. D. The comparison of PFS between low- and high-risk score groups in the training set. E. The distribution of risk scores ranked from low to high and the comparison of survival status between low- and high- risk score groups in the training set. F. The prediction accuracy of the risk score measured by ROC curves at 1, 3, 5 years in the training set. The AUC values are 0.728, 0.674, 0.681 respectively. ①P<0.001, ②P=0.001.
Fig 4 Construction and testing of the prognostic model in PCa
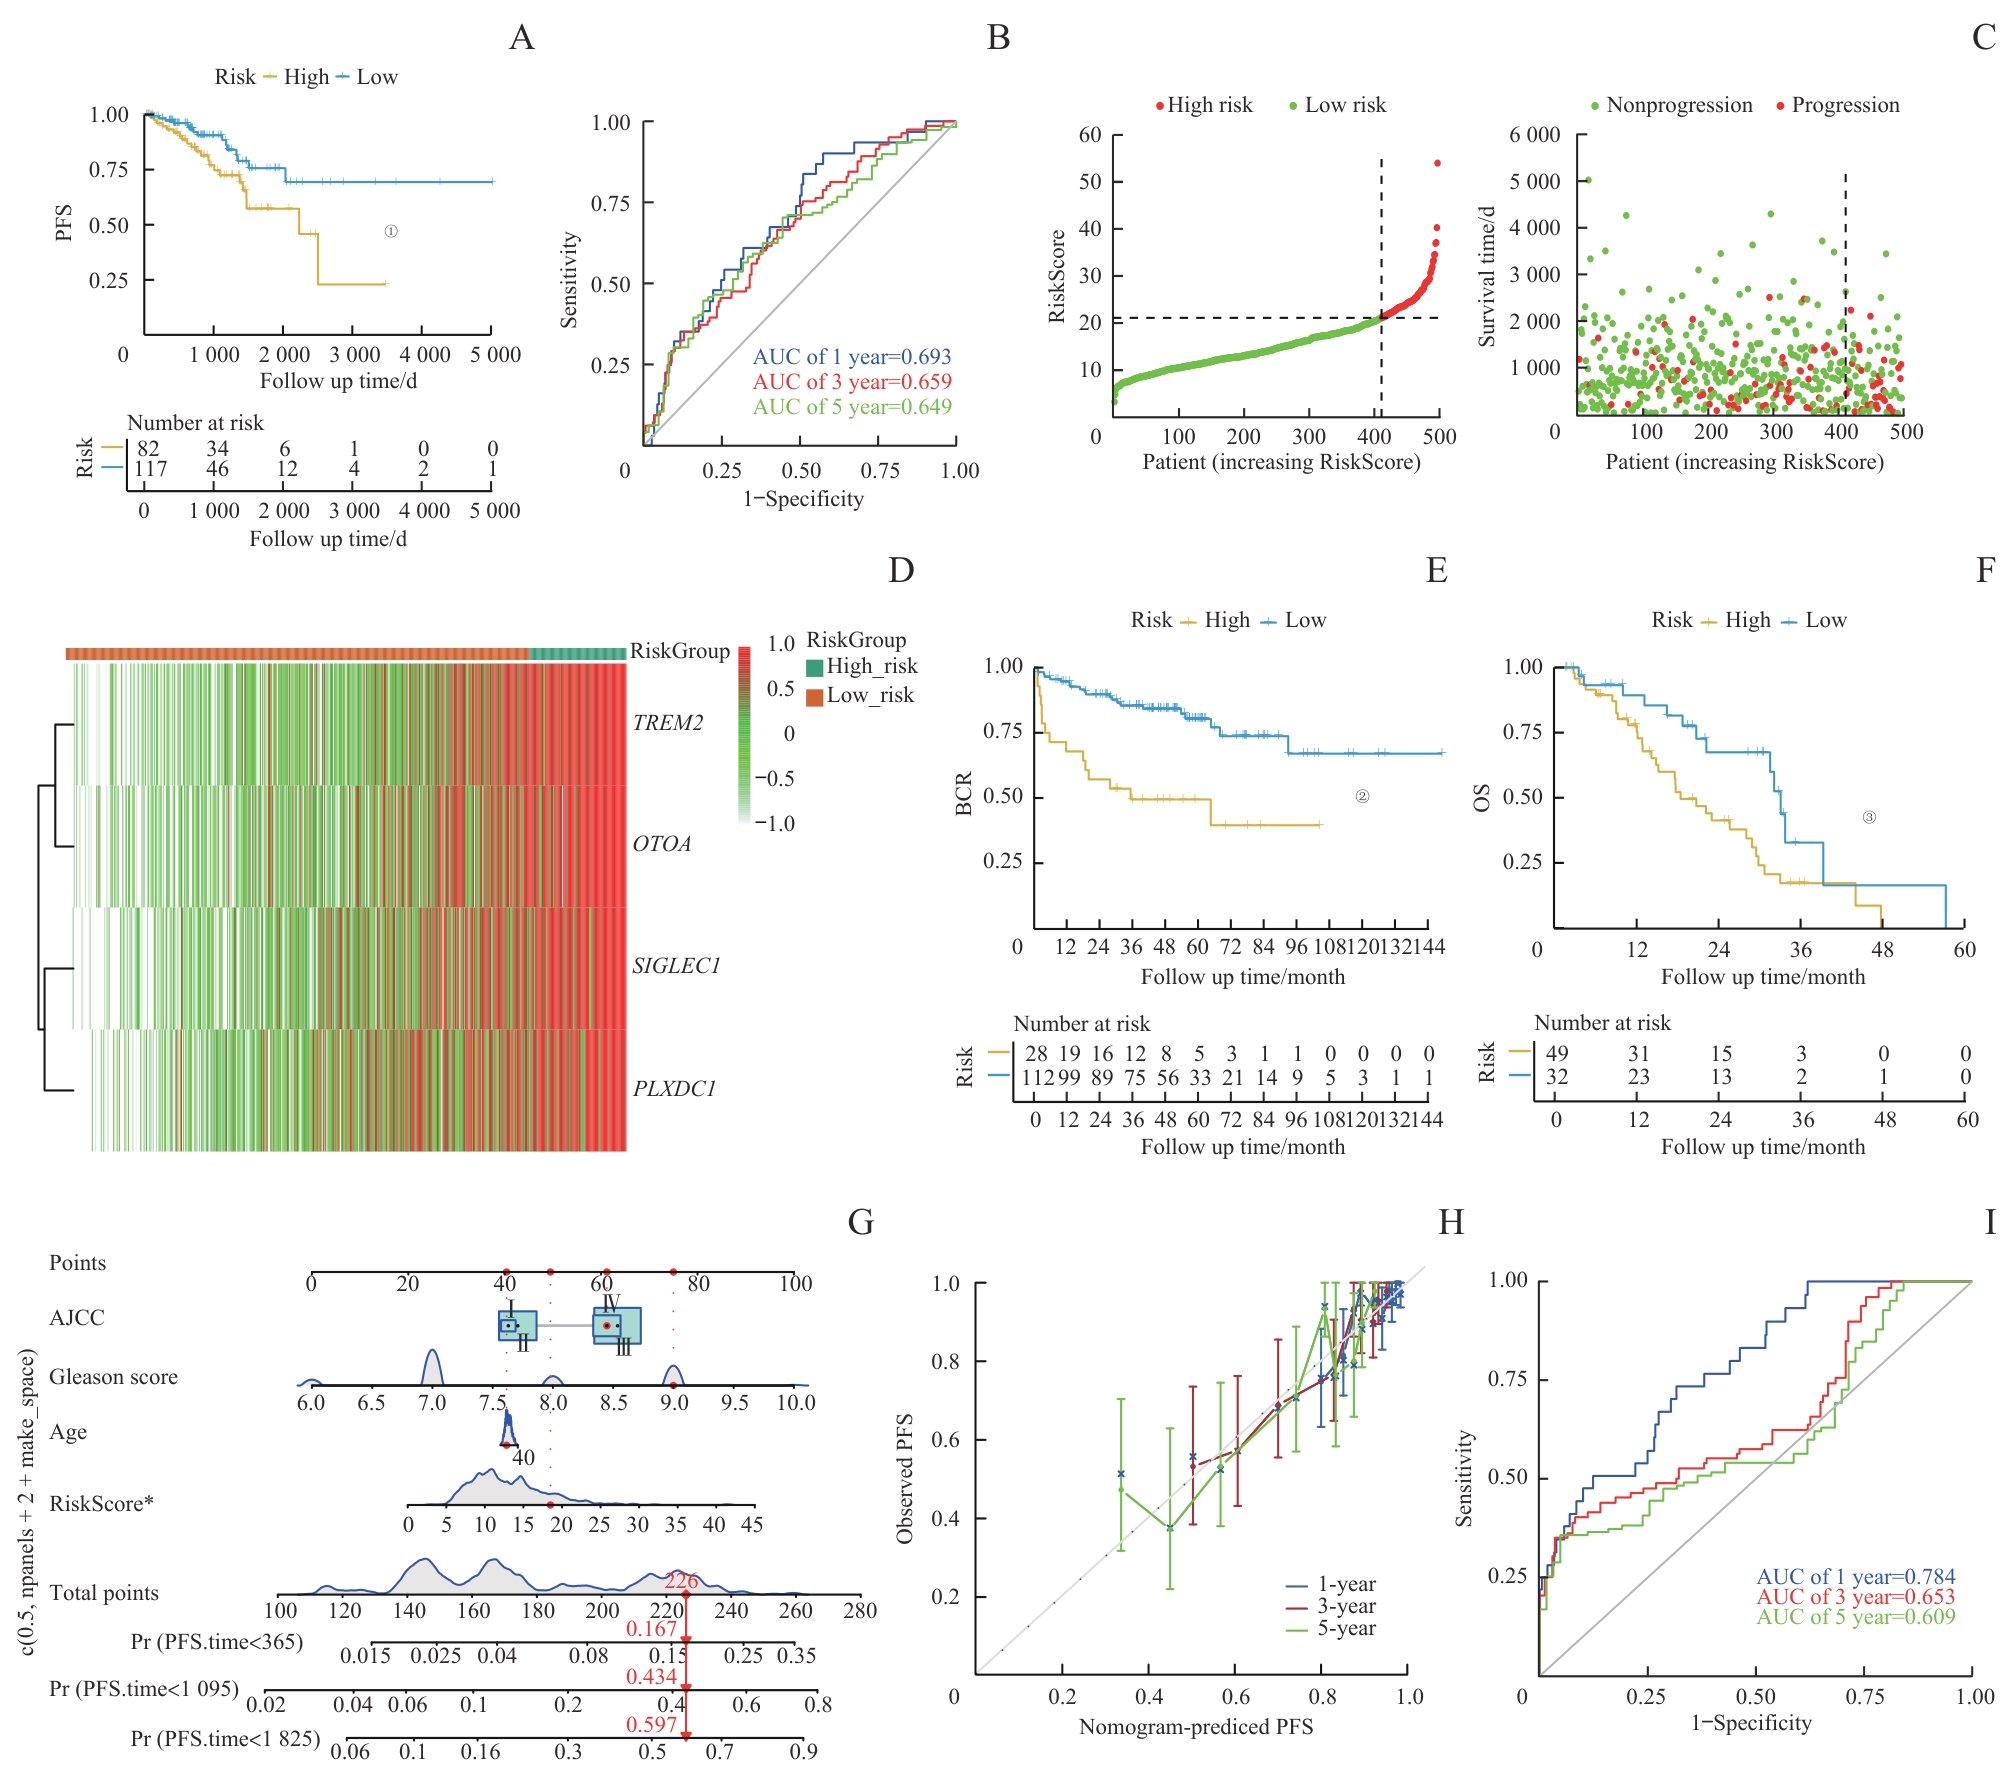
图5 通过外部数据库对预后模型进行验证Note: A. The comparison of PFS between low- and high-risk score groups in the test set. B. The prediction accuracy of the risk score measured by ROC curves at 1, 3, 5 years in the test set. The AUC values were 0.693, 0.659, and 0.649 for 1, 3, and 5 years, respectively. C. Distribution of risk in ascending order and comparison of survival status between low- and high- risk score groups in the test set. D. The heatmap of four signature genes between high- and low-risk group. E/F. The comparison of BCR (E) and OS (F) between low- and high-risk score groups in the SU2C/PCF Dream Team cohort. G. Nomogram for predicting PFS of patients in training set. H. The calibration plots of the nomogram at 1, 3, 5 years. The x coordinate value represents the nomogram-predicted survival, and the y coordinate value represents observed PFS. I. ROC curves for nomogram at 1, 3, 5 years. ①P=0.018, ②P<0.001, ③P=0.013.
Fig 5 External database validation of prognostic model
| Item | Coef | Exp(coef) | Se(coef) | Z | Pr(>|z|) |
|---|---|---|---|---|---|
| RiskScore | 0.041 055 | 1.041 909 | 0.020 700 | 1.983 | 0.047 3 |
| Age | -0.002 394 | 0.997 609 | 0.016 200 | -0.148 | 0.882 5 |
| Gleason score | 0.641 375 | 1.899 091 | 0.133 834 | 4.792 | 1.65×10⁻⁶ |
| AJCCⅡ | 0.050 297 | 1.051 583 | 1.060 082 | 0.047 | 0.962 2 |
| AJCCⅢ | 0.581 300 | 1.788 361 | 1.060 250 | 0.548 | 0.583 5 |
| AJCCⅣ | 0.524 520 | 1.689 648 | 1.087 386 | 0.482 | 0.629 5 |
表1 包含风险评分的多变量Cox回归模型
Tab 1 Multivariable Cox regression models with risk score
| Item | Coef | Exp(coef) | Se(coef) | Z | Pr(>|z|) |
|---|---|---|---|---|---|
| RiskScore | 0.041 055 | 1.041 909 | 0.020 700 | 1.983 | 0.047 3 |
| Age | -0.002 394 | 0.997 609 | 0.016 200 | -0.148 | 0.882 5 |
| Gleason score | 0.641 375 | 1.899 091 | 0.133 834 | 4.792 | 1.65×10⁻⁶ |
| AJCCⅡ | 0.050 297 | 1.051 583 | 1.060 082 | 0.047 | 0.962 2 |
| AJCCⅢ | 0.581 300 | 1.788 361 | 1.060 250 | 0.548 | 0.583 5 |
| AJCCⅣ | 0.524 520 | 1.689 648 | 1.087 386 | 0.482 | 0.629 5 |
| Item | Coef | Exp(coef) | Se(coef) | Z | Pr(>|z|) |
|---|---|---|---|---|---|
| Age | 0.000 538 3 | 1.000 538 5 | 0.015 995 0 | 0.034 | 0.973 |
| Gleason score | 0.705 826 4 | 2.025 519 8 | 0.131 378 0 | 5.372 | 7.77×10⁻⁶ |
| AJCCⅡ | -0.088 018 0 | 0.915 744 4 | 1.057 486 1 | -0.083 | 0.934 |
| AJCCⅢ | 0.488 412 6 | 1.629 727 2 | 1.059 586 6 | 0.461 | 0.645 |
| AJCCⅣ | 0.420 683 5 | 1.523 002 2 | 1.088 112 2 | 0.387 | 0.699 |
表2 不包含风险评分的多变量Cox回归模型
Tab 2 Multivariable Cox regression models without risk score
| Item | Coef | Exp(coef) | Se(coef) | Z | Pr(>|z|) |
|---|---|---|---|---|---|
| Age | 0.000 538 3 | 1.000 538 5 | 0.015 995 0 | 0.034 | 0.973 |
| Gleason score | 0.705 826 4 | 2.025 519 8 | 0.131 378 0 | 5.372 | 7.77×10⁻⁶ |
| AJCCⅡ | -0.088 018 0 | 0.915 744 4 | 1.057 486 1 | -0.083 | 0.934 |
| AJCCⅢ | 0.488 412 6 | 1.629 727 2 | 1.059 586 6 | 0.461 | 0.645 |
| AJCCⅣ | 0.420 683 5 | 1.523 002 2 | 1.088 112 2 | 0.387 | 0.699 |
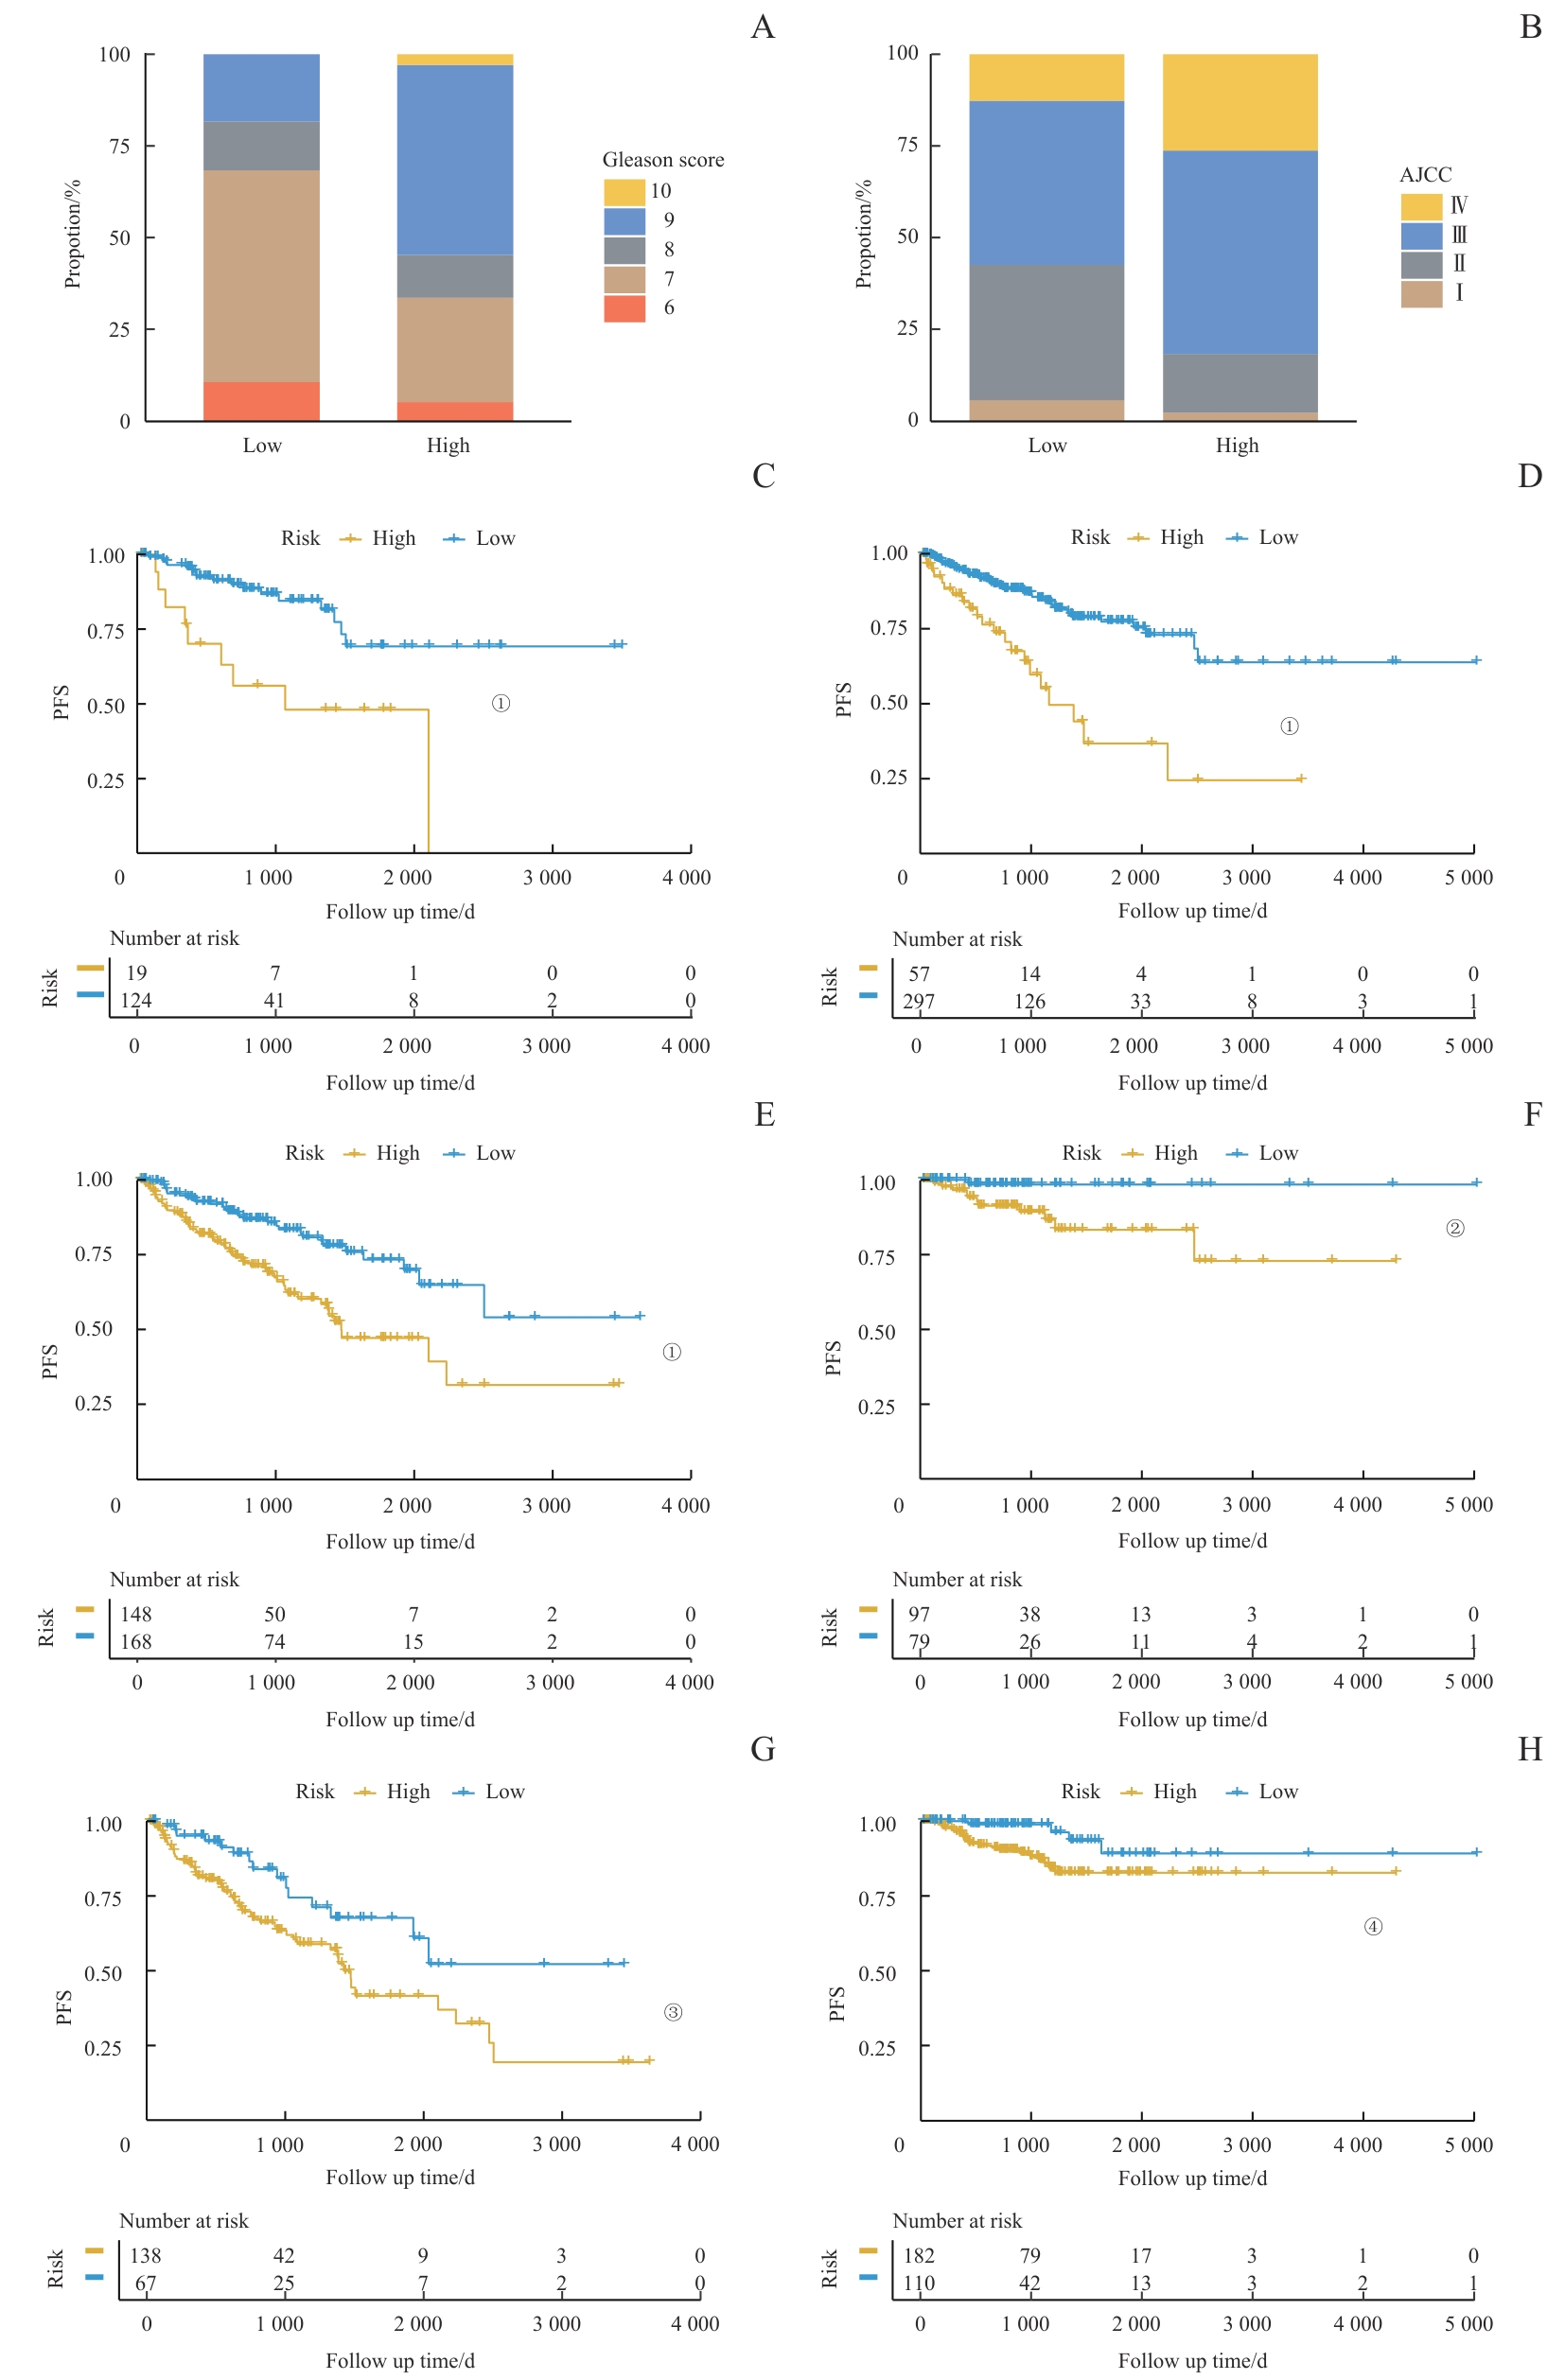
图6 临床特征与风险评分的关联Note: A/B. The analysis of the RiskScore distribution based on Gleason score (A) and AJCC stage (B). C‒H. Kaplan-Meier analysis of PFS between high-risk and low-risk score groups among patients with different clinical pathological features. C. Patients with Gleason scores 6‒7. D. Patients with Gleason scores 8‒10. E. Patients with AJCC stage Ⅰ/Ⅱ. F. Patients with AJCC stage Ⅲ/Ⅳ. G. Patients aged ≤65 years. H. Patients aged >65 years. ①P<0.001, ②P=0.011, ③P=0.010, ④P=0.024.
Fig 6 Association of clinical characteristics with RiskScore
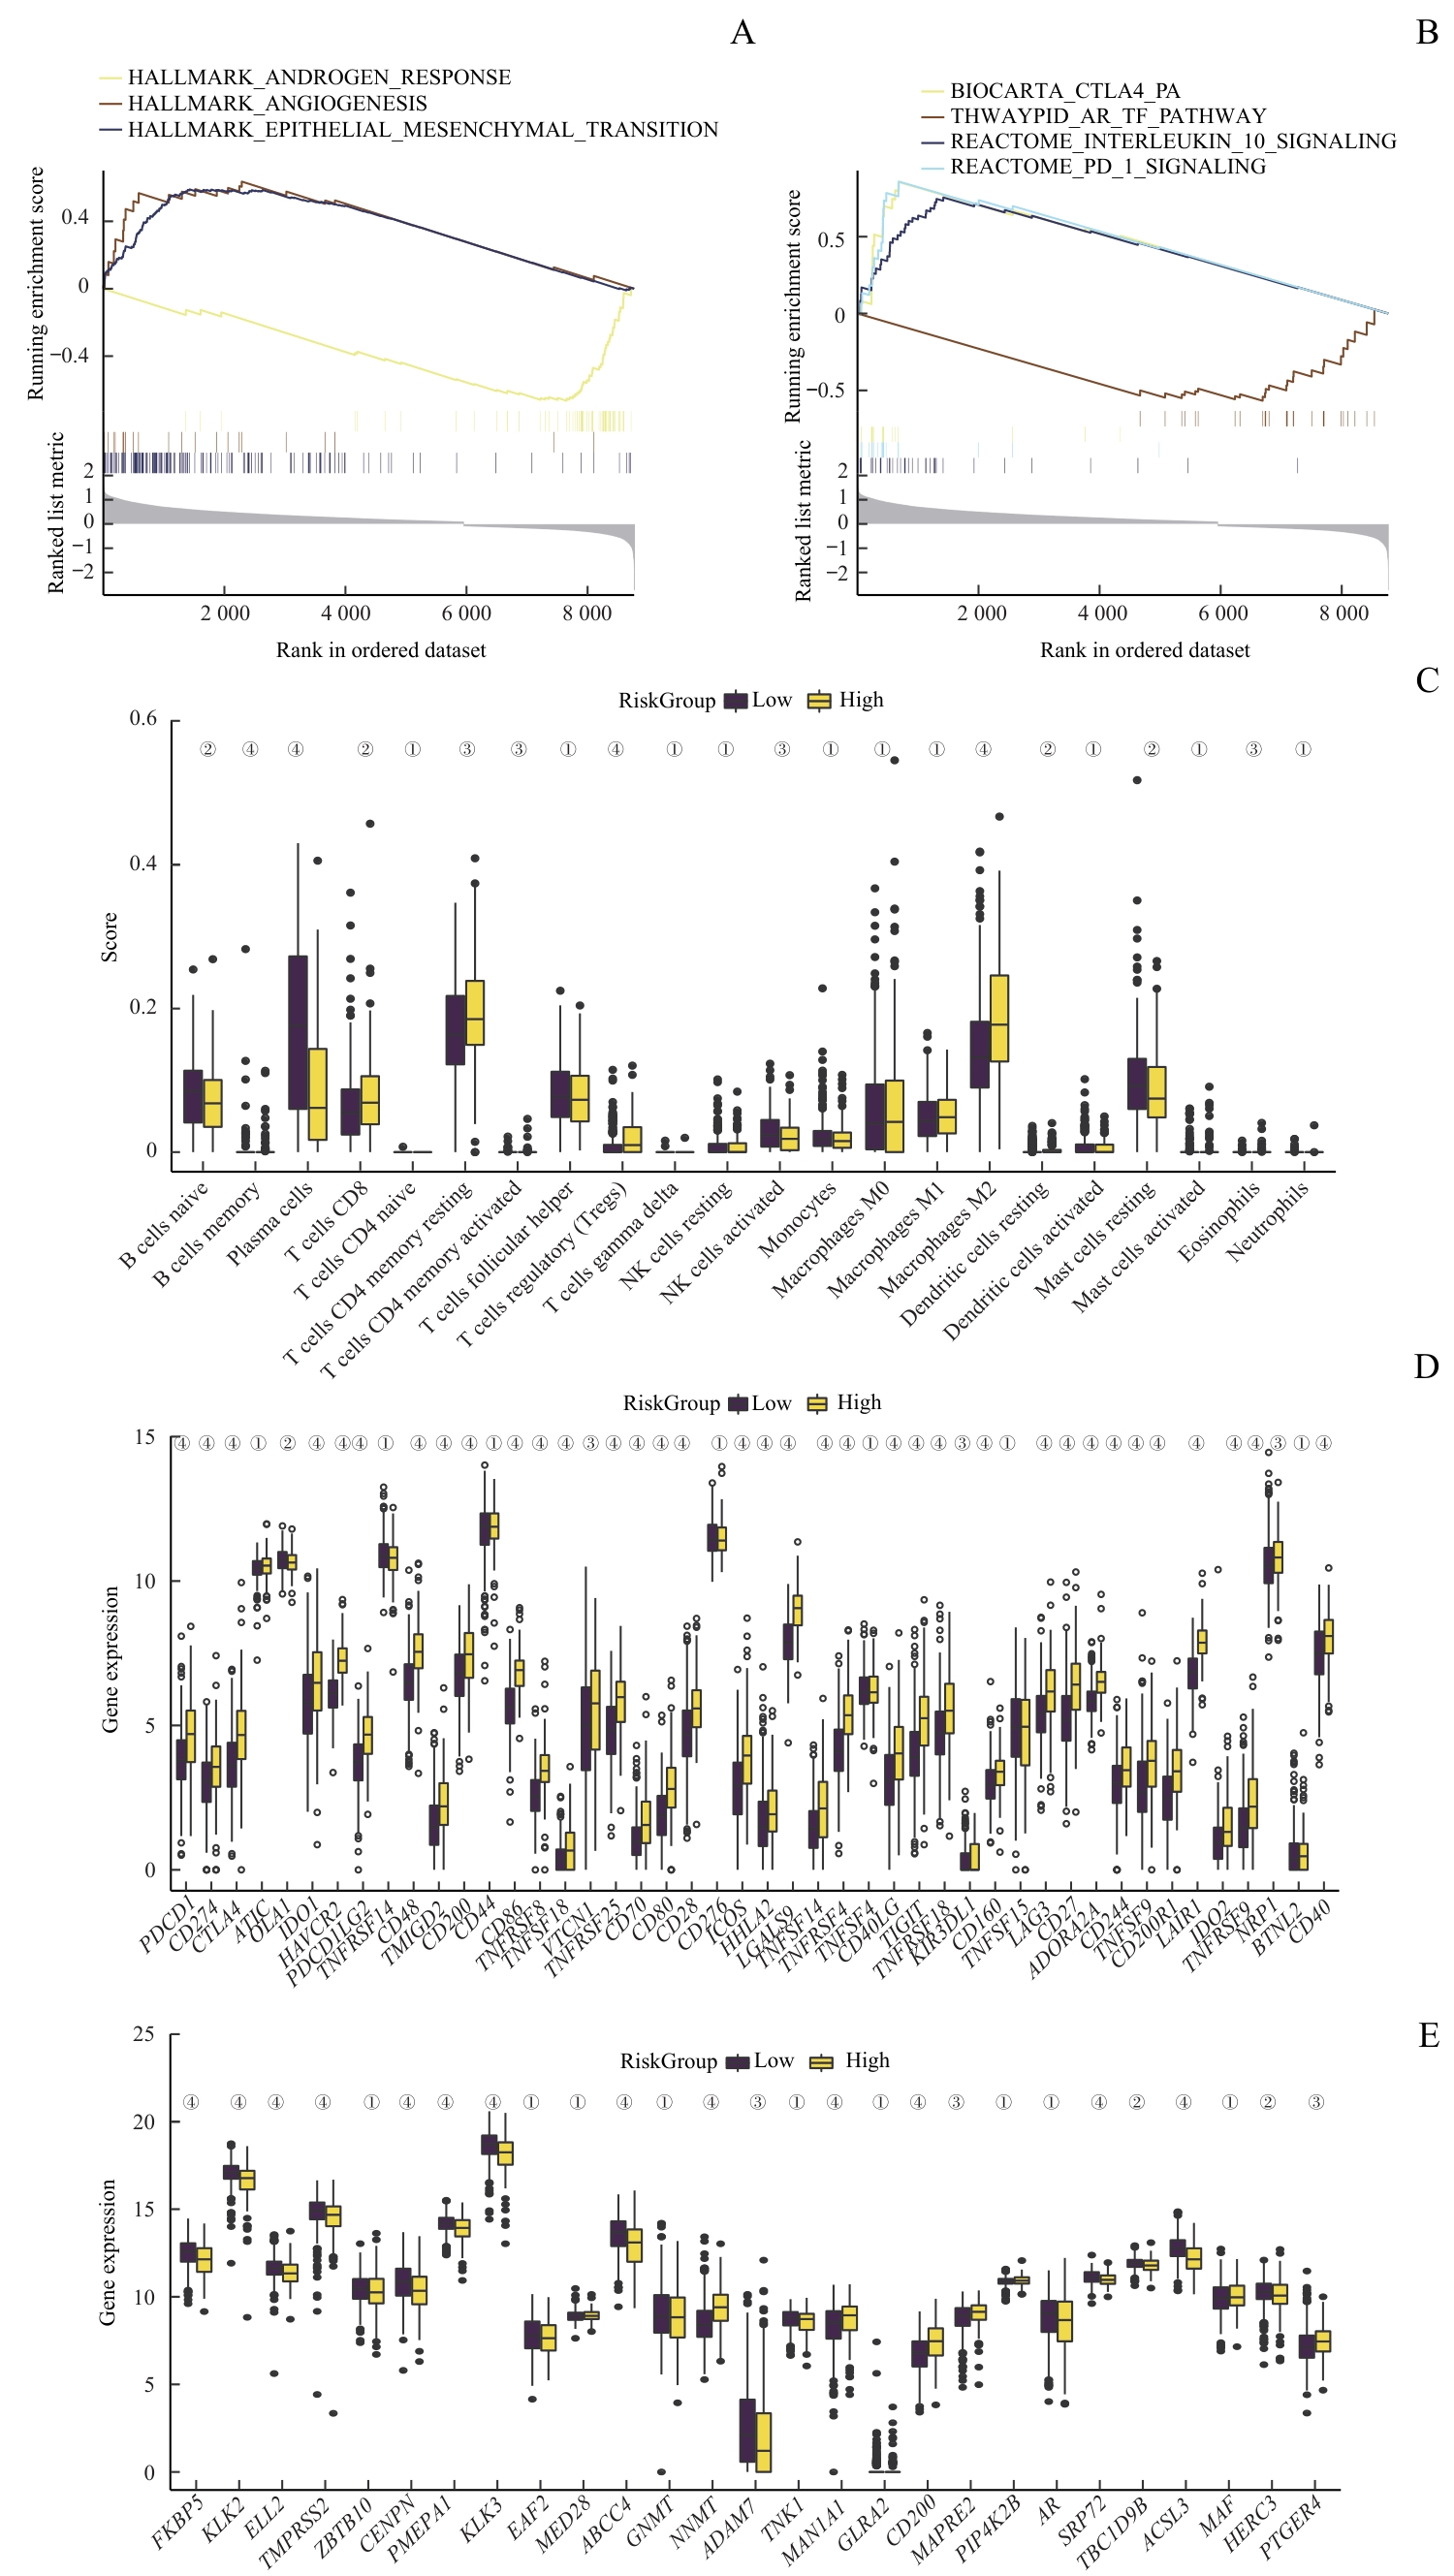
图7 风险评分与免疫抑制和耐药性的关联Note: A/B. GSEA of patients with high or low Risk Score. C. Analysis of immune cell infiltration in PCa samples with high or low Risk Score. D. Analysis of immune checkpoint-related genes in PCa samples with high or low Risk Score. E. Analysis ofAR pathway activity in PCa samples with high or low Risk Score. ①P>0.05, ②P<0.05, ③P<0.01, ④P<0.001.
Fig 7 Association of immunosuppression and drug resistance with RiskScore
| Drug ID | Drug name | Pathway name | Target |
|---|---|---|---|
| 1021 | Axitinib | RTK signaling | PDGFR, KIT, VEGFR |
| 1022 | AZD7762 | Cell cycle | CHEK1, CHEK2 |
| 1059 | AZD8055 | PI3K/mTOR signaling | MTORC1, MTORC2 |
| 1192 | GSK269962A | Cytoskeleton | ROCK1, ROCK2 |
| 1615 | CZC24832 | PI3K/mTOR signaling | PI3KG |
| 1632 | Ribociclib | Cell cycle | CDK4, CDK6 |
表3 与风险评分呈负相关的药物
Tab 3 Drugs negatively correlated with risk score
| Drug ID | Drug name | Pathway name | Target |
|---|---|---|---|
| 1021 | Axitinib | RTK signaling | PDGFR, KIT, VEGFR |
| 1022 | AZD7762 | Cell cycle | CHEK1, CHEK2 |
| 1059 | AZD8055 | PI3K/mTOR signaling | MTORC1, MTORC2 |
| 1192 | GSK269962A | Cytoskeleton | ROCK1, ROCK2 |
| 1615 | CZC24832 | PI3K/mTOR signaling | PI3KG |
| 1632 | Ribociclib | Cell cycle | CDK4, CDK6 |

图8 潜在药物预测Note: A/B. GSEA of potential drug resistance-related pathways. C. A comprehensive analysis of drug sensitivity between the high and low Risk Score groups. ①P<0.001.
Fig 8 Prediction of potential drugs
| 1 | SUNG H, FERLAY J, SIEGEL R L, et al. Global cancer statistics 2020: globocan estimates of incidence and mortality worldwide for 36 cancers in 185 countries[J]. CA Cancer J Clin, 2021, 71(3): 209-249. |
| 2 | JAMES N D, TANNOCK I, N'DOW J, et al. The lancet commission on prostate cancer: planning for the surge in cases[J]. Lancet, 2024, 403(10437): 1683-1722. |
| 3 | XIANG X N, WANG J G, LU D, et al. Targeting tumor-associated macrophages to synergize tumor immunotherapy[J]. Signal Transduct Target Ther, 2021, 6(1): 75. |
| 4 | MANTOVANI A, MARCHESI F, MALESCI A, et al. Tumour-associated macrophages as treatment targets in oncology[J]. Nat Rev Clin Oncol, 2017, 14(7): 399-416. |
| 5 | CASSETTA L, POLLARD J W. Targeting macrophages: therapeutic approaches in cancer[J]. Nat Rev Drug Discov, 2018, 17(12): 887-904. |
| 6 | EL-KENAWI A, DOMINGUEZ-VIQUEIRA W, LIU M, et al. Macrophage-derived cholesterol contributes to therapeutic resistance in prostate cancer[J]. Cancer Res, 2021, 81(21): 5477-5490. |
| 7 | WANG D, CHENG C P, CHEN X Y, et al. IL-1β is an androgen-responsive target in macrophages for immunotherapy of prostate cancer[J]. Adv Sci (Weinh), 2023, 10(17): e2206889. |
| 8 | PARTIN A W, MANGOLD L A, LAMM D M, et al. Contemporary update of prostate cancer staging nomograms (Partin Tables) for the new millennium[J]. Urology, 2001, 58(6): 843-848. |
| 9 | PUNNEN S, FREEDLAND S J, PRESTI J C Jr, et al. Multi-institutional validation of the CAPRA-S score to predict disease recurrence and mortality after radical prostatectomy[J]. Eur Urol, 2014, 65(6): 1171-1177. |
| 10 | BOSTRÖM P J, BJARTELL A S, CATTO J W F, et al. Genomic predictors of outcome in prostate cancer[J]. Eur Urol, 2015, 68(6): 1033-1044. |
| 11 | GOLDMAN M J, CRAFT B, HASTIE M, et al. Visualizing and interpreting cancer genomics data via the Xena platform[J]. Nat Biotechnol, 2020, 38(6): 675-678. |
| 12 | CHEN S J, ZHU G H, YANG Y, et al. Single-cell analysis reveals transcriptomic remodellings in distinct cell types that contribute to human prostate cancer progression[J]. Nat Cell Biol, 2021, 23(1): 87-98. |
| 13 | TAYLOR B S, SCHULTZ N, HIERONYMUS H, et al. Integrative genomic profiling of human prostate cancer[J]. Cancer Cell, 2010, 18(1): 11-22. |
| 14 | ABIDA W, CYRTA J, HELLER G, et al. Genomic correlates of clinical outcome in advanced prostate cancer[J]. Proc Natl Acad Sci USA, 2019, 116(23): 11428-11436. |
| 15 | NEWMAN A M, STEEN C B, LIU C L, et al. Determining cell type abundance and expression from bulk tissues with digital cytometry[J]. Nat Biotechnol, 2019, 37(7): 773-782. |
| 16 | TANG Z F, KANG B X, LI C W, et al. GEPIA2: an enhanced web server for large-scale expression profiling and interactive analysis[J]. Nucleic Acids Res, 2019, 47(W1): W556-W560. |
| 17 | YU G C, WANG L G, HAN Y Y, et al. ClusterProfiler: an R package for comparing biological themes among gene clusters[J]. OMICS, 2012, 16(5): 284-287. |
| 18 | JIN S Q, GUERRERO-JUAREZ C F, ZHANG L H, et al. Inference and analysis of cell-cell communication using CellChat[J]. Nat Commun, 2021, 12(1): 1088. |
| 19 | FRIEDMAN J, HASTIE T, TIBSHIRANI R. Regularization paths for generalized linear models via coordinate descent[J]. J Stat Softw, 2010, 33(1): 1-22. |
| 20 | LYU A, FAN Z H, CLARK M, et al. Evolution of myeloid-mediated immunotherapy resistance in prostate cancer[J]. Nature, 2025, 637: 1207-1217. |
| 21 | FANG L Y, IZUMI K, LAI K P, et al. Infiltrating macrophages promote prostate tumorigenesis via modulating androgen receptor-mediated CCL4-STAT3 signaling[J]. Cancer Res, 2013, 73(18): 5633-5646. |
| 22 | BLUM D L, KOYAMA T, M'KOMA A E, et al. Chemokine markers predict biochemical recurrence of prostate cancer following prostatectomy[J]. Clin Cancer Res, 2008, 14(23): 7790-7797. |
| 23 | GANTA V C, CHOI M, FARBER C R, et al. Antiangiogenic VEGF165b regulates macrophage polarization via S100A8/S100A9 in peripheral artery disease[J]. Circulation, 2019, 139(2): 226-242. |
| 24 | LIU Y, KONG X H, YOU Y, et al. S100A8-mediated NLRP3 inflammasome-dependent pyroptosis in macrophages facilitates liver fibrosis progression[J]. Cells, 2022, 11(22): 3579. |
| 25 | OBRADOVIC A, CHOWDHURY N, HAAKE S M, et al. Single-cell protein activity analysis identifies recurrence-associated renal tumor macrophages[J]. Cell, 2021, 184(11): 2988-3005.e16. |
| 26 | MOLGORA M, ESAULOVA E, VERMI W, et al. TREM2 modulation remodels the tumor myeloid landscape enhancing anti-PD-1 immunotherapy[J]. Cell, 2020, 182(4): 886-900.e17. |
| 27 | BINNEWIES M, POLLACK J L, RUDOLPH J, et al. Targeting TREM2 on tumor-associated macrophages enhances immunotherapy[J]. Cell Rep, 2021, 37(3): 109844. |
| 28 | LAURENT S, GEHRIG C, NOUSPIKEL T, et al. Molecular characterization of pathogenic OTOA gene conversions in hearing loss patients[J]. Hum Mutat, 2021, 42(4): 373-377. |
| 29 | LUKASHKIN A N, KEVIN LEGAN P, WEDDELL T D, et al. A mouse model for human deafness DFNB22 reveals that hearing impairment is due to a loss of inner hair cell stimulation[J]. Proc Natl Acad Sci USA, 2012, 109(47): 19351-19356. |
| 30 | HOFMANN O, CABALLERO O L, STEVENSON B J, et al. Genome-wide analysis of cancer/testis gene expression[J]. Proc Natl Acad Sci USA, 2008, 105(51): 20422-20427. |
| 31 | SINGH R, CHOI B K. Siglec1-expressing subcapsular sinus macrophages provide soil for melanoma lymph node metastasis[J]. eLife, 2019, 8: e48916. |
| 32 | CASSETTA L, FRAGKOGIANNI S, SIMS A H, et al. Human tumor-associated macrophage and monocyte transcriptional landscapes reveal cancer-specific reprogramming, biomarkers, and therapeutic targets[J]. Cancer Cell, 2019, 35(4): 588-602.e10. |
| 33 | FUCHS B, MAHLUM E, HALDER C, et al. High expression of tumor endothelial marker 7 is associated with metastasis and poor survival of patients with osteogenic sarcoma[J]. Gene, 2007, 399(2): 137-143. |
| [1] | 缪可言, 贾浩, 杨溪. 花生四烯酸代谢通路重塑肿瘤免疫微环境的研究进展[J]. 上海交通大学学报(医学版), 2026, 46(4): 521-528. |
| [2] | 章玥, 陈青建. 基于质谱流式细胞技术的乳腺癌免疫微环境预后特征分析[J]. 上海交通大学学报(医学版), 2026, 46(1): 34-42. |
| [3] | 朱涵菁, 郭艳, 殷弘凡, 王贝贝, 谢娟, 杨艳. 前列腺癌内分泌治疗患者体重管理的最佳证据总结[J]. 上海交通大学学报(医学版), 2025, 45(2): 194-203. |
| [4] | 敦译霆, 赵婧, 冯成领, 李行健, 崔迪, 韩邦旻. 机器人辅助腹腔镜根治性前列腺切除术后患者尿失禁的在线风险计算器和列线图预测模型[J]. 上海交通大学学报(医学版), 2025, 45(10): 1361-1371. |
| [5] | 张烨晟, 杨易静, 黄依雯, 施珑玙, 王曼媛, 陈思思. 肿瘤微环境免疫细胞调节肿瘤细胞耐药性的研究进展[J]. 上海交通大学学报(医学版), 2024, 44(7): 830-838. |
| [6] | 蔡人杰, 徐明. KHSRP通过ANK3调节前列腺癌细胞对雄激素的反应性[J]. 上海交通大学学报(医学版), 2024, 44(4): 417-426. |
| [7] | 刘林楠, 冯莉, 王龙, 刘嘉寅, 范志松. 多能蛋白聚糖在恶性肿瘤中的表达及生物学作用的研究进展[J]. 上海交通大学学报(医学版), 2024, 44(4): 525-530. |
| [8] | 李钰, 姜艺凡, 童荣亮, 陈迪宇, 吴健. FOXM1与肿瘤代谢关系的研究进展[J]. 上海交通大学学报(医学版), 2024, 44(10): 1323-1329. |
| [9] | 朱涵菁, 殷弘凡, 尤思洁, 杨艳. 前列腺癌患者内分泌治疗相关不良反应的潜在剖面分析[J]. 上海交通大学学报(医学版), 2023, 43(9): 1186-1193. |
| [10] | 严叶青, 梁胜, 杨斌, 邹仁健, 马玉飞, 蔡利生, 王辉, 傅宏亮. 18F-MD-PSMA PET/CT显像在中高危前列腺癌初始分期中的应用价值[J]. 上海交通大学学报(医学版), 2023, 43(7): 873-881. |
| [11] | 魏兰懿, 薛晓川, 陈君君, 杨全军, 王梦月, 韩永龙. 骨肉瘤免疫微环境中肿瘤相关巨噬细胞及其靶向治疗的研究进展[J]. 上海交通大学学报(医学版), 2023, 43(5): 624-630. |
| [12] | 杨万里, 宋娟, 李兵, 劳一敏. CBX8抑制前列腺癌细胞侵袭的机制研究[J]. 上海交通大学学报(医学版), 2023, 43(12): 1507-1519. |
| [13] | 吴瑞芳, 冯明, 孟健. 脂肪酸结合蛋白4在肥胖相关肿瘤中的作用综述[J]. 上海交通大学学报(医学版), 2023, 43(10): 1311-1316. |
| [14] | 马芳芳, 秦洁洁, 任灵杰, 唐笑梅, 刘佳, 施敏敏, 蒋玲曦. 基于水凝胶微球建立胰腺癌原代细胞的3D培养模型[J]. 上海交通大学学报(医学版), 2023, 43(1): 79-87. |
| [15] | 林家俞, 秦洁洁, 蒋玲曦. 肿瘤微环境中免疫细胞的代谢研究进展[J]. 上海交通大学学报(医学版), 2022, 42(8): 1122-1130. |
| 阅读次数 | ||||||
|
全文 |
|
|||||
|
摘要 |
|
|||||