上海交通大学学报(医学版) ›› 2021, Vol. 41 ›› Issue (9): 1233-1239.doi: 10.3969/j.issn.1674-8115.2021.09.015
何俊林1,2( ), 路青3, 徐昕4, 胡曙东5()
收稿日期:2021-01-18
出版日期:2021-09-28
发布日期:2021-08-03
通讯作者:
胡曙东,电子信箱:hsd2001054@163.com。作者简介:何俊林(1972—),男,主治医师,学士;电子信箱:912211529@qq.com。
Jun-lin HE1,2(), Qing LU3, Xin XU4, Shu-dong HU5()
Received:2021-01-18
Online:2021-09-28
Published:2021-08-03
Contact:
HU Shu-dong, E-mail: hsd2001054@163.com.摘要:
目的·探讨甲状腺乳头状癌(papillary thyroid carcinoma,PTC)CT增强检查的平扫期、动脉期和静脉期图像的影像组学特征对术前预测颈部淋巴结转移(cervical lymph node metastasis,CLNM)的价值。方法·收集2017年1月—2020年6月在上海市金山区亭林医院行甲状腺外科治疗的197例PTC患者的CT图像,筛选出满足要求的512帧(包括193帧平扫期、131帧动脉期、188帧静脉期),选择图像中显示病灶最大长径的层面进行影像组学研究。根据CLNM的状态,用全部512帧CT图像优选RandomForestClassifier的最佳参数;用具有全部3期CT图像的124例患者资料分别构建3期的随机森林(random forest,RF)分类模型,模型的评价标准为受试者操作特征曲线(receiver operator characteristic curve,ROC curve)的最大平均曲线下面积(area under the curve,AUC)和准确度。结果·RF分类模型显示平扫期、动脉期和静脉期的ROC曲线最大平均AUC分别为0.843、0.775、0.783,相应准确度分别为0.767、0.695、0.726,平扫期的最大平均AUC值明显高于动脉期及静脉期(均P=0.000)。结论·PTC的CT 3期影像组学特征可以较准确地预测CLNM,其中平扫期图像特征预测性能较高。
中图分类号:
何俊林, 路青, 徐昕, 胡曙东. CT影像组学特征预测甲状腺乳头状癌颈部淋巴结转移的价值研究[J]. 上海交通大学学报(医学版), 2021, 41(9): 1233-1239.
Jun-lin HE, Qing LU, Xin XU, Shu-dong HU. Value of CT radiomic features in preoperative prediction of cervical lymph node metastasis in patients with papillary thyroid carcinoma[J]. JOURNAL OF SHANGHAI JIAOTONG UNIVERSITY (MEDICAL SCIENCE), 2021, 41(9): 1233-1239.
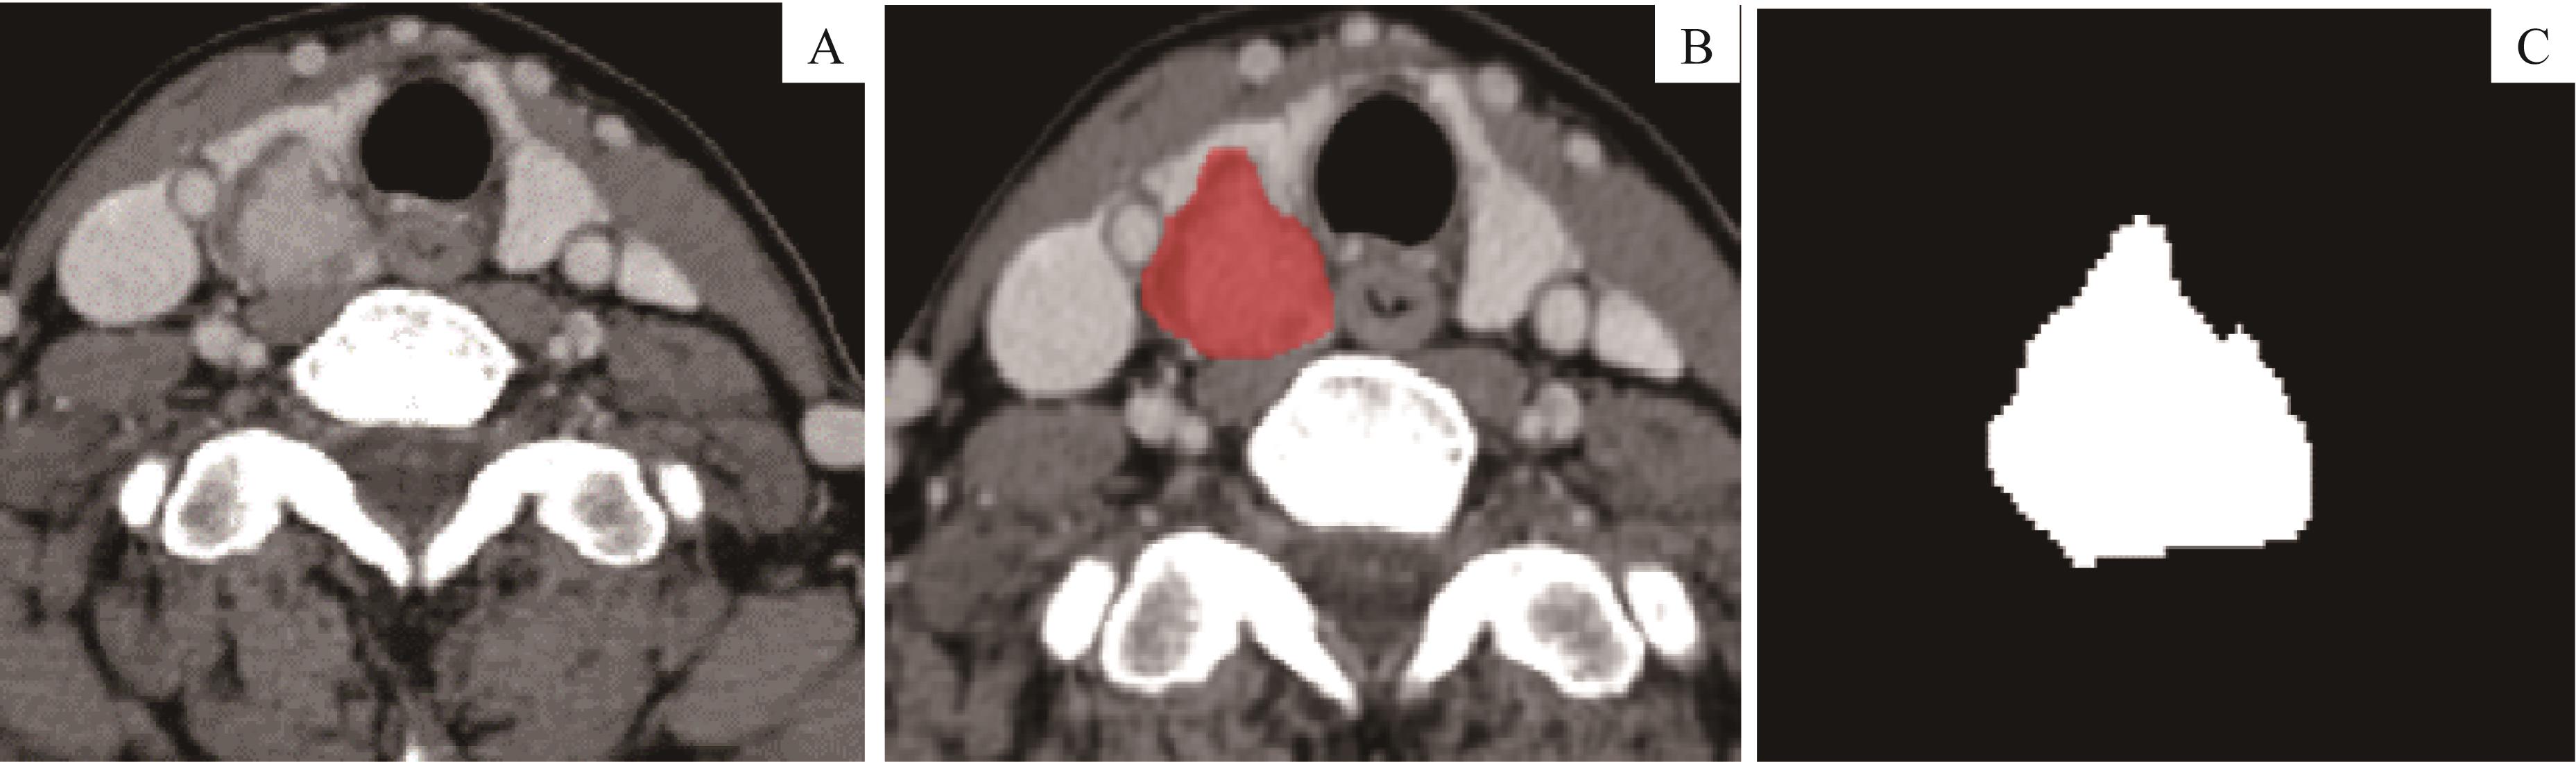
图1 PTC的ROI圈选示意Note:A. Lesion on the right lobe. B. Segmentation of ROI. C. 2D segmentation of the lesion with maximum length to diameter.
Fig1 Demonstration of segmentation to ROI of PTC
| Item | CLNM group (n=55) | Non-CLNM group (n=69) | t value | P value | Item | CLNM group (n=55) | Non-CLNM group (n=69) | t value | P value |
|---|---|---|---|---|---|---|---|---|---|
| Age/year | 52.8±12.8 | 48.3±13.5 | 0.139 | 0.063 | Isthmus | 3 (5.5) | 0 (0) | ||
| Age group/n(%) | 4.051 | 0.044 | Right lobe | 22 (40.0) | 38 (55.1) | ||||
| ≥50 | 37 (67.3) | 34 (49.3) | Calcification/n(%) | 0.116 | 0.733 | ||||
| <50 | 18 (32.7) | 35 (50.7) | Negative | 28 (50.9) | 33 (47.8) | ||||
| Gender/n(%) | 0.304 | 0.581 | Positive | 27 (49.1) | 36 (52.2) | ||||
| Male | 12 (21.8) | 18 (26.1) | Boundary①/n(%) | 1.125 | 0.289 | ||||
| Female | 43 (78.2) | 51 (73.9) | Distinct | 12 (21.8) | 10 (14.5) | ||||
| Shape/n(%) | 1.360 | 0.713 | Indistinct | 43 (78.2) | 59 (85.5) | ||||
| Irregular | 43 (78.2) | 52 (75.4) | Capsule invasion/n(%) | 5.731 | 0.025 | ||||
| Regular | 12 (21.8) | 17 (24.6) | Negative | 4 (7.3) | 16 (23.2) | ||||
| Length to diameter/n(%) | 2.285 | 0.131 | Positive | 51 (92.7) | 53 (76.8) | ||||
| ≤1.0 | 26 (47.3) | 42 (60.9) | ETE/n(%) | 8.801 | 0.004 | ||||
| >1.0 | 29 (52.7) | 27 (39.1) | Negative | 27 (49.1) | 51 (73.9) | ||||
| Location/n(%) | 5.776 | 0.056 | Positive | 28 (50.9) | 18 (26.1) | ||||
| Left lobe | 30 (54.5) | 31 (44.9) |
表1 PTC患者的基线及临床特征(N=124)
Tab1 Baseline and clinical information of PTC patients(N=124)
| Item | CLNM group (n=55) | Non-CLNM group (n=69) | t value | P value | Item | CLNM group (n=55) | Non-CLNM group (n=69) | t value | P value |
|---|---|---|---|---|---|---|---|---|---|
| Age/year | 52.8±12.8 | 48.3±13.5 | 0.139 | 0.063 | Isthmus | 3 (5.5) | 0 (0) | ||
| Age group/n(%) | 4.051 | 0.044 | Right lobe | 22 (40.0) | 38 (55.1) | ||||
| ≥50 | 37 (67.3) | 34 (49.3) | Calcification/n(%) | 0.116 | 0.733 | ||||
| <50 | 18 (32.7) | 35 (50.7) | Negative | 28 (50.9) | 33 (47.8) | ||||
| Gender/n(%) | 0.304 | 0.581 | Positive | 27 (49.1) | 36 (52.2) | ||||
| Male | 12 (21.8) | 18 (26.1) | Boundary①/n(%) | 1.125 | 0.289 | ||||
| Female | 43 (78.2) | 51 (73.9) | Distinct | 12 (21.8) | 10 (14.5) | ||||
| Shape/n(%) | 1.360 | 0.713 | Indistinct | 43 (78.2) | 59 (85.5) | ||||
| Irregular | 43 (78.2) | 52 (75.4) | Capsule invasion/n(%) | 5.731 | 0.025 | ||||
| Regular | 12 (21.8) | 17 (24.6) | Negative | 4 (7.3) | 16 (23.2) | ||||
| Length to diameter/n(%) | 2.285 | 0.131 | Positive | 51 (92.7) | 53 (76.8) | ||||
| ≤1.0 | 26 (47.3) | 42 (60.9) | ETE/n(%) | 8.801 | 0.004 | ||||
| >1.0 | 29 (52.7) | 27 (39.1) | Negative | 27 (49.1) | 51 (73.9) | ||||
| Location/n(%) | 5.776 | 0.056 | Positive | 28 (50.9) | 18 (26.1) | ||||
| Left lobe | 30 (54.5) | 31 (44.9) |
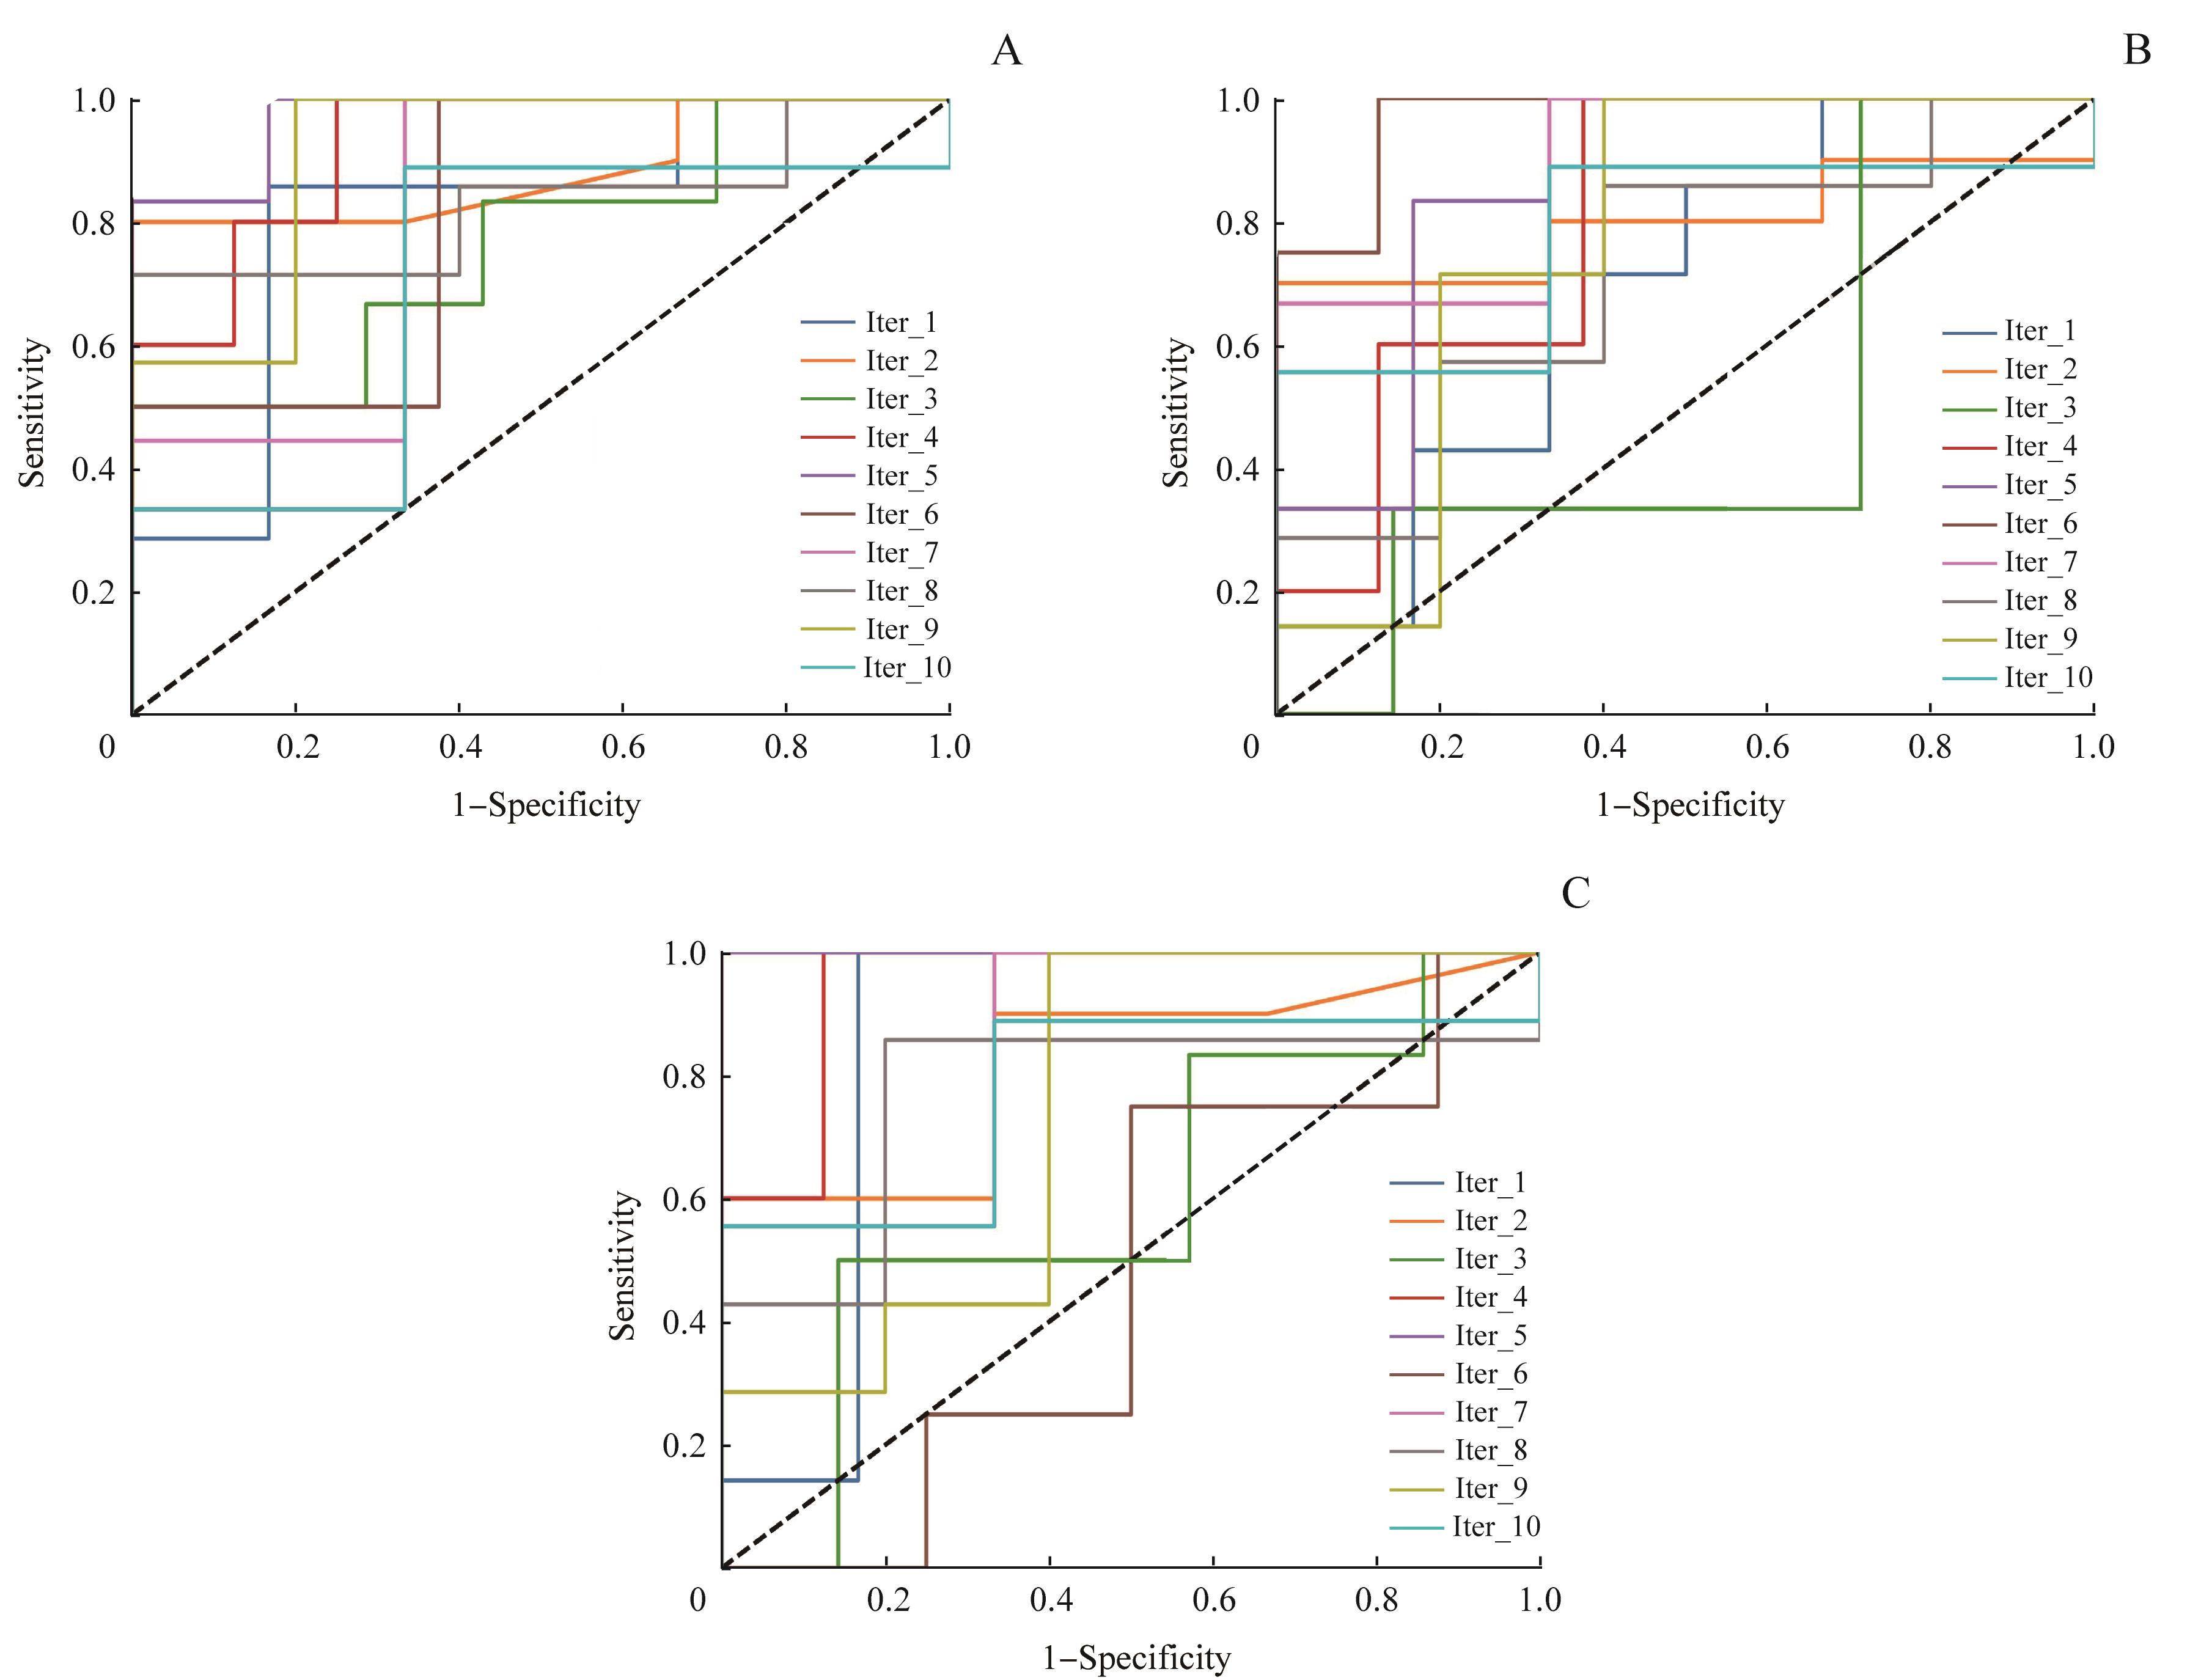
图2 PTC患者的平扫期(A)、动脉期(B)、静脉期(C)的RF分类模型中最大平均AUC的10折ROC曲线
Fig 2 10-fold ROC curve of the maximum AUC in RF classification models of the pre-contrast phase (A), arterial phase (B) and venous phase (C) of patients with PTC
| Iteration | Training set | Validation set | Pre-contrast phase [top(k)=56] | Arterial phase [top(k)=94] | Venous phase [top(k)=47] | |||
|---|---|---|---|---|---|---|---|---|
| Accuracy | AUC | Accuracy | AUC | Accuracy | AUC | |||
| 1 | 111 | 13 | 0.846 | 0.810 | 0.615 | 0.690 | 0.846 | 0.857 |
| 2 | 111 | 13 | 0.846 | 0.833 | 0.692 | 0.800 | 0.692 | 0.817 |
| 3 | 111 | 13 | 0.538 | 0.762 | 0.615 | 0.476 | 0.615 | 0.595 |
| 4 | 111 | 13 | 0.769 | 0.925 | 0.692 | 0.800 | 0.692 | 0.950 |
| 5 | 111 | 13 | 0.917 | 0.972 | 0.750 | 0.861 | 1.000 | 1.000 |
| 6 | 111 | 13 | 0.583 | 0.812 | 0.583 | 0.969 | 0.500 | 0.469 |
| 7 | 111 | 13 | 0.833 | 0.815 | 0.833 | 0.889 | 0.750 | 0.852 |
| 8 | 111 | 13 | 0.750 | 0.829 | 0.667 | 0.714 | 0.750 | 0.771 |
| 9 | 111 | 13 | 0.833 | 0.914 | 0.750 | 0.771 | 0.667 | 0.743 |
| 10 | 111 | 13 | 0.750 | 0.704 | 0.750 | 0.778 | 0.750 | 0.778 |
| Average AUC | ‒ | ‒ | 0.767 | 0.843 | 0.695 | 0.775 | 0.726 | 0.783 |
表2 PTC患者CT平扫期、动脉期、静脉期RF分类模型10折交叉验证的结果
Tab 2 Results of 10-fold cross-validation of RF classification model in pre-contrast phase,arterial phase and venous phase of patients with PTC
| Iteration | Training set | Validation set | Pre-contrast phase [top(k)=56] | Arterial phase [top(k)=94] | Venous phase [top(k)=47] | |||
|---|---|---|---|---|---|---|---|---|
| Accuracy | AUC | Accuracy | AUC | Accuracy | AUC | |||
| 1 | 111 | 13 | 0.846 | 0.810 | 0.615 | 0.690 | 0.846 | 0.857 |
| 2 | 111 | 13 | 0.846 | 0.833 | 0.692 | 0.800 | 0.692 | 0.817 |
| 3 | 111 | 13 | 0.538 | 0.762 | 0.615 | 0.476 | 0.615 | 0.595 |
| 4 | 111 | 13 | 0.769 | 0.925 | 0.692 | 0.800 | 0.692 | 0.950 |
| 5 | 111 | 13 | 0.917 | 0.972 | 0.750 | 0.861 | 1.000 | 1.000 |
| 6 | 111 | 13 | 0.583 | 0.812 | 0.583 | 0.969 | 0.500 | 0.469 |
| 7 | 111 | 13 | 0.833 | 0.815 | 0.833 | 0.889 | 0.750 | 0.852 |
| 8 | 111 | 13 | 0.750 | 0.829 | 0.667 | 0.714 | 0.750 | 0.771 |
| 9 | 111 | 13 | 0.833 | 0.914 | 0.750 | 0.771 | 0.667 | 0.743 |
| 10 | 111 | 13 | 0.750 | 0.704 | 0.750 | 0.778 | 0.750 | 0.778 |
| Average AUC | ‒ | ‒ | 0.767 | 0.843 | 0.695 | 0.775 | 0.726 | 0.783 |

图3 3个期相中107个RF分类模型10折ROC曲线的平均AUC比较Note:The P value by t-test for two independent samples: pre-contrast phase and arterial phase (P=0.000), pre-contrast phase and venous phase (P=0.000), arterial phase and venous phase (P =0.782).
Fig 3 Comparison of the average AUC of 10-fold ROC curves of 107 RF classification models in three phases
| Order | Pre-contrast phase | Arterial phase | Venous phase |
|---|---|---|---|
| 1 | Original_glcm_DifferenceAverage | Original_glcm_DifferenceVariance | Original_glcm_DifferenceVariance |
| 2 | Original_firstorder_Variance | Original_glcm_ClusterProminence | Original_glcm_Contrast |
| 3 | Original_glrlm_RunPercentage | Original_glcm_Contrast | Original_glrlm_ShortRunEmphasis |
| 4 | Original_glszm_GrayLevelNonUniformityNormalized | Original_firstorder_Kurtosis | Original_glszm_SmallAreaLowGrayLevelEmphasis |
| 5 | Original_glcm_SumSquares | Original_glcm_ClusterShade | Original_glcm_ClusterProminence |
| 6 | Original_glcm_JointEntropy | Original_shape_Maximum3DDiameter | Original_glrlm_RunVariance |
| 7 | Original_glcm_SumAverage | Original_glrlm_GrayLevelVariance | Original_firstorder_Skewness |
| 8 | Original_glcm_Contrast | Original_gldm_DependenceVariance | Original_glcm_MaximumProbability |
| 9 | Original_ngtdm_Strength | Original_glcm_SumSquares | Original_glcm_DifferenceAverage |
| 10 | Original_gldm_DependenceNonUniformityNormalized | Original_glcm_DifferenceEntropy | Original_glcm_ClusterShade |
表3 PTC患者平扫期、动脉期和静脉期RF分类模型中预测性能最佳的10个影像组学特征(N=124)
Tab 3 Top 10 radiomic features in RF classification model of pre-contrast, arterial and venous phase of PTC patients(N=124)
| Order | Pre-contrast phase | Arterial phase | Venous phase |
|---|---|---|---|
| 1 | Original_glcm_DifferenceAverage | Original_glcm_DifferenceVariance | Original_glcm_DifferenceVariance |
| 2 | Original_firstorder_Variance | Original_glcm_ClusterProminence | Original_glcm_Contrast |
| 3 | Original_glrlm_RunPercentage | Original_glcm_Contrast | Original_glrlm_ShortRunEmphasis |
| 4 | Original_glszm_GrayLevelNonUniformityNormalized | Original_firstorder_Kurtosis | Original_glszm_SmallAreaLowGrayLevelEmphasis |
| 5 | Original_glcm_SumSquares | Original_glcm_ClusterShade | Original_glcm_ClusterProminence |
| 6 | Original_glcm_JointEntropy | Original_shape_Maximum3DDiameter | Original_glrlm_RunVariance |
| 7 | Original_glcm_SumAverage | Original_glrlm_GrayLevelVariance | Original_firstorder_Skewness |
| 8 | Original_glcm_Contrast | Original_gldm_DependenceVariance | Original_glcm_MaximumProbability |
| 9 | Original_ngtdm_Strength | Original_glcm_SumSquares | Original_glcm_DifferenceAverage |
| 10 | Original_gldm_DependenceNonUniformityNormalized | Original_glcm_DifferenceEntropy | Original_glcm_ClusterShade |
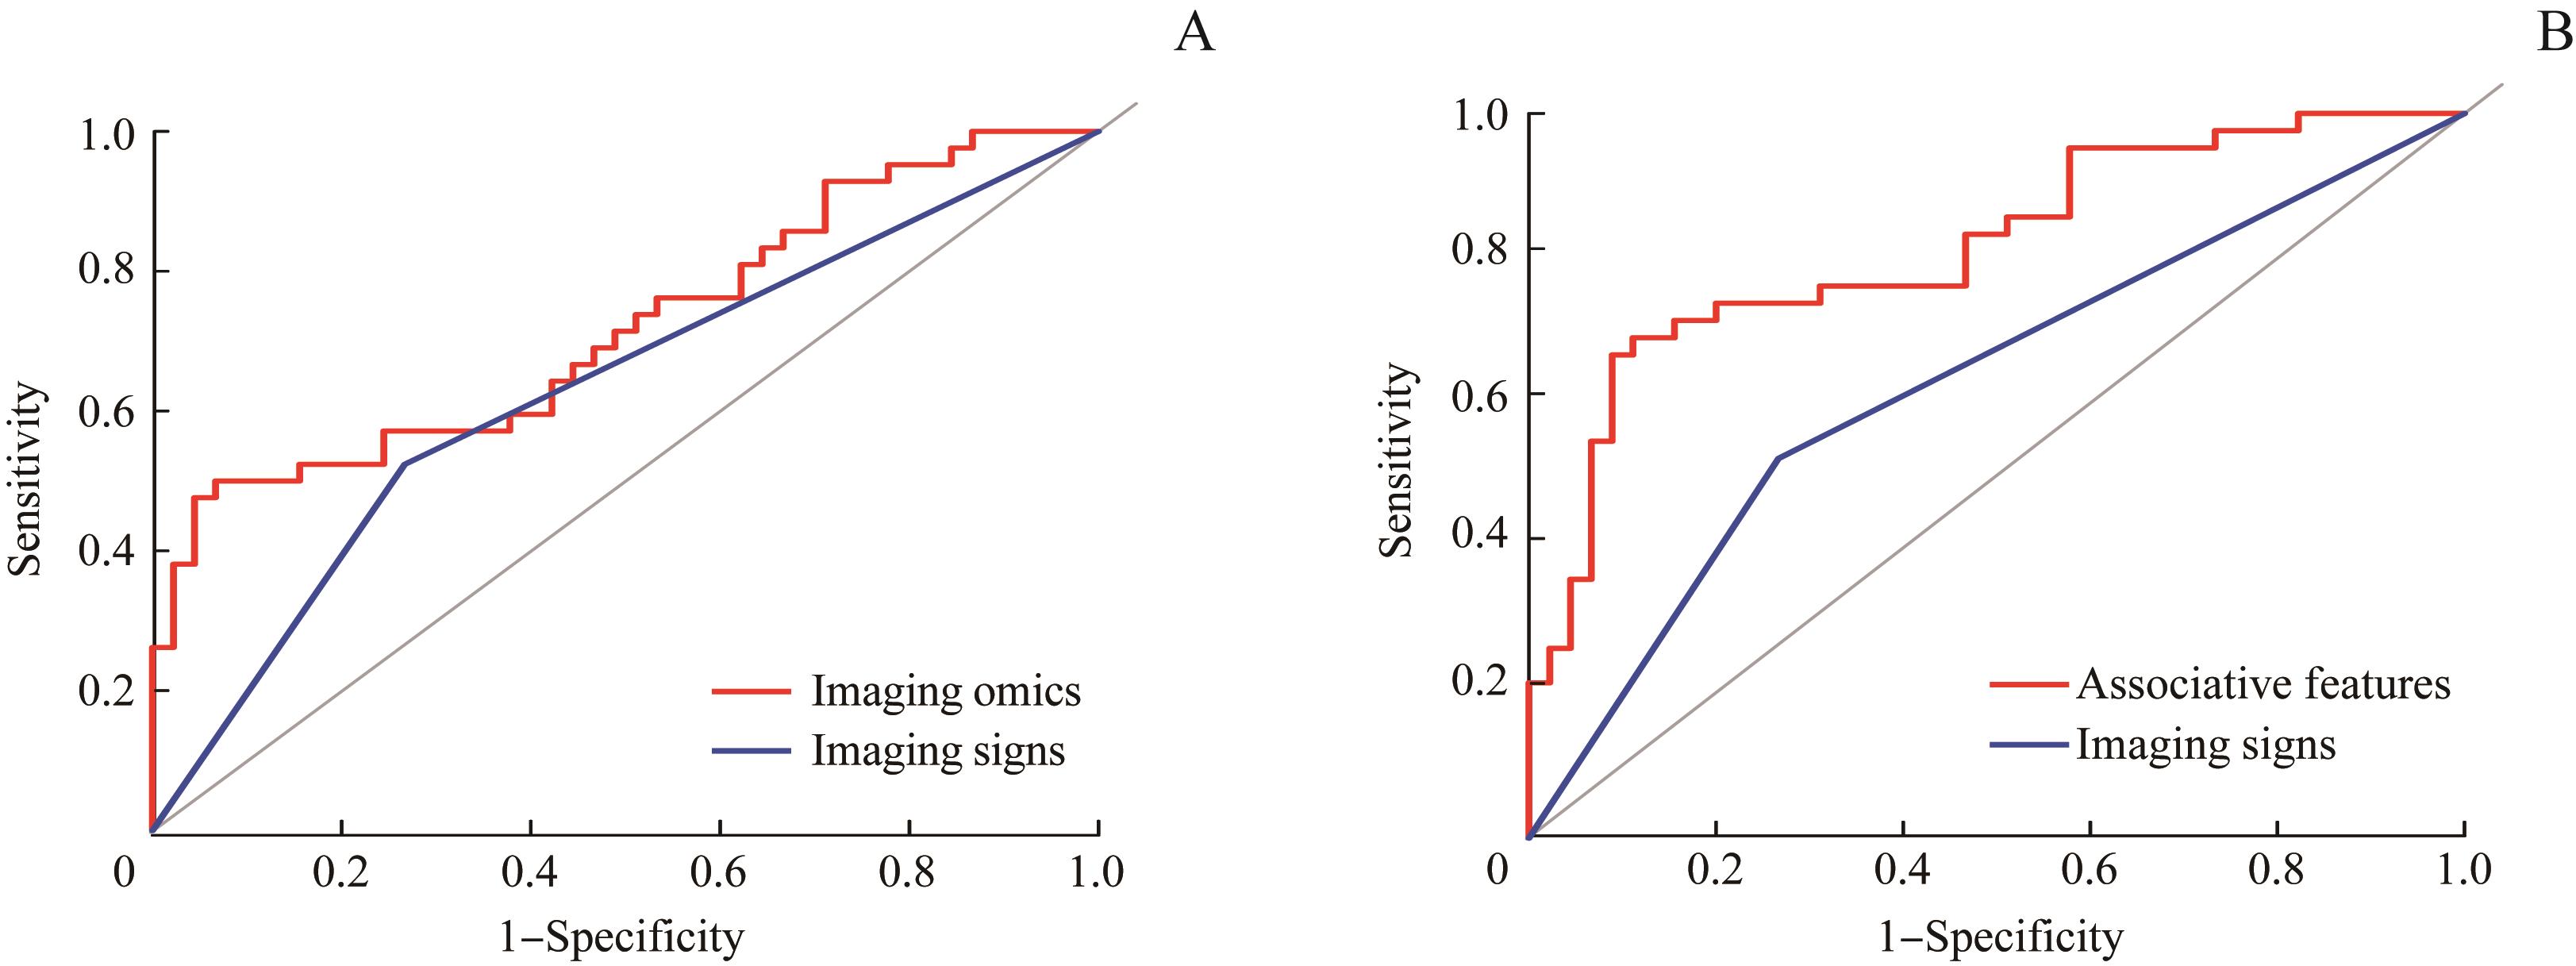
图4 PTC患者的影像组学特征、联合特征与影像征象的预测价值比较的ROC曲线Note: A. Comparison of imaging omics and imaging signs (P=0.011). B. Comparison of associative features and imaging signs (P=0.009).
Fig 4 ROC curve for comparison of predictive value of imaging omics, associative features and imaging signs of PTC patients
| 1 | Siegel RL, Miller KD, Jemal A. Cancer statistics, 2019[J]. CA Cancer J Clin, 2019, 69(1): 7-34. |
| 2 | Vaccarella S, Franceschi S, Bray F, et al. Worldwide thyroid-cancer epidemic? The increasing impact of overdiagnosis[J]. N Engl J Med, 2016, 375(7): 614-617. |
| 3 | Londero SC, Krogdahl A, Bastholt L, et al. Papillary thyroid carcinoma in Denmark, 1996‒2008: outcome and evaluation of established prognostic scoring systems in a prospective national cohort[J]. Thyroid, 2015, 25(1): 78-84. |
| 4 | Lee YK, Kim D, Shin DY, et al. The prognosis of papillary thyroid cancer with initial distant metastasis is strongly associated with extensive extrathyroidal extension: a retrospective cohort study[J]. Ann Surg Oncol, 2019, 26(7): 2200-2209. |
| 5 | Mulla M, Schulte KM. Central cervical lymph node metastases in papillary thyroid cancer: a systematic review of imaging-guided and prophylactic removal of the central compartment[J]. Clin Endocrinol (Oxf), 2012, 76(1): 131-136. |
| 6 | Hall CM, Snyder SK, Lairmore TC. Central lymph node dissection improves lymph node clearance in papillary thyroid cancer patients with lateral neck metastases, even after prior total thyroidectomy[J]. Am Surg, 2018, 84(4): 531-536. |
| 7 | Mulla M, Schulte KM. The accuracy of ultrasonography in the preoperative diagnosis of cervical lymph node (LN) metastasis in patients with papillary thyroid carcinoma: a meta-analysis[J]. Eur J Radiol, 2012, 81(8): 1965. |
| 8 | Suh CH, Baek JH, Choi YJ, et al. Performance of CT in the preoperative diagnosis of cervical lymph node metastasis in patients with papillary thyroid cancer: a systematic review and meta-analysis[J]. AJNR Am J Neuroradiol, 2017, 38(1): 154-161. |
| 9 | Gross ND, Weissman JL, Talbot JM, et al. MRI detection of cervical metastasis from differentiated thyroid carcinoma[J]. Laryngoscope, 2001, 111(11Pt 1): 1905-1909. |
| 10 | Chen QH, Raghavan P, Mukherjee S, et al. Accuracy of MRI for the diagnosis of metastatic cervical lymphadenopathy in patients with thyroid cancer[J]. La Radiol Med, 2015, 120(10): 959-966. |
| 11 | Paek SH, Yi KH, Kim SJ, et al. Feasibility of sentinel lymph node dissection using Tc-99m phytate in papillary thyroid carcinoma[J]. Ann Surg Treat Res, 2017, 93(5): 240-245. |
| 12 | Suh CH, Choi YJ, Lee JJ, et al. Comparison of core-needle biopsy and fine-needle aspiration for evaluating thyroid incidentalomas detected by 18F-fluorodeoxyglucose positron emission tomography/computed tomography: a propensity score analysis[J]. Thyroid, 2017, 27(10): 1258-1266. |
| 13 | Lambin P, Rios-Velazquez E, Leijenaar R, et al. Radiomics: extracting more information from medical images using advanced feature analysis[J]. Eur J Cancer, 2012, 48(4): 441-446. |
| 14 | van Griethuysen JJM, Fedorov A, Parmar C, et al. Computational radiomics system to decode the radiographic phenotype[J]. Cancer Res, 2017, 77(21): e104-e107. |
| 15 | Barry WT, Kernagis DN, Dressman HK, et al. Intratumor heterogeneity and precision of microarray-based predictors of breast cancer biology and clinical outcome[J]. J Clin Oncol, 2010, 28(13): 2198-2206. |
| 16 | Gambardella C, Patrone R, di Capua F, et al. The role of prophylactic central compartment lymph node dissection in elderly patients with differentiated thyroid cancer: a multicentric study[J]. BMC Surg, 2019, 18(): 110. |
| 17 | Lu W, Zhong LZ, Dong D, et al. Radiomic analysis for preoperative prediction of cervical lymph node metastasis in patients with papillary thyroid carcinoma[J]. Eur J Radiol, 2019, 118: 231-238. |
| 18 | Liu TT, Zhou SC, Yu JH, et al. Prediction of lymph node metastasis in patients with papillary thyroid carcinoma: a radiomics method based on preoperative ultrasound images[J]. Technol Cancer Res Treat, 2019, 18: 1533033819831713. |
| 19 | O′Connor JP, Rose CJ, Waterton JC, et al. Imaging intratumor heterogeneity: role in therapy response, resistance, and clinical outcome[J]. Clin Cancer Res, 2015, 21(2): 249-257. |
| 20 | 徐天伟. 基于灰度共生矩阵的医学PET图像纹理分析研究[J]. 电脑知识与技术, 2017, 13(5): 219-220. |
| 21 | 颜智敏, 冯智超, 曹鹏, 等. 多层螺旋CT图像纹理分析对直肠癌转移性淋巴结的诊断价值[J]. 中华放射学杂志, 2017, 51(6): 432-436. |
| 22 | El Naqa I, Grigsby P, Apte A, et al. Exploring feature-based approaches in PET images for predicting cancer treatment outcomes[J]. Pattern Recognit, 2009, 42(6): 1162-1171. |
| 23 | 梁子超, 李智炜, 赖铿, 等. 10折交叉验证用于预测模型泛化能力评价及其R软件实现[J]. 中国医院统计, 2020, 27(4): 289-292. |
| 24 | Rodríguez JD, Pérez A, Lozano JA. Sensitivity analysis of kappa-fold cross validation in prediction error estimation[J]. IEEE Trans Pattern Anal Mach Intell, 2010, 32(3): 569-575. |
| 25 | Johnstone IM, Titterington DM. Statistical challenges of high-dimensional data[J]. Philos Trans A Math Phys Eng Sci, 2009, 367(1906): 4237-4253. |
| 26 | Clarke R, Ressom HW, Wang A, et al. The properties of high-dimensional data spaces: implications for exploring gene and protein expression data[J]. Nat Rev Cancer, 2008, 8(1): 37-49. |
| [1] | 李偲羽, 陈娅, 胡文韬, 戴勇鸣, 吴颖为. 磁共振耦合谱成像识别头颈部肿瘤异质性及隐匿性淋巴结转移[J]. 上海交通大学学报(医学版), 2025, 45(9): 1202-1213. |
| [2] | 吴雷, 杜凤麟, 赵明娜, 任逸喆, 张先洲, 娄加陶. N型蛋白酪氨酸磷酸酶受体在肺腺癌中的表达及其促进肿瘤转移的机制[J]. 上海交通大学学报(医学版), 2025, 45(7): 846-857. |
| [3] | 王蕊, 袁瑛, 陶晓峰. 合成磁共振成像在口腔癌颈部淋巴结转移诊断中的应用价值[J]. 上海交通大学学报(医学版), 2025, 45(7): 900-909. |
| [4] | 杨娜, 刘俊丽, 白静, 杨思怡, 韩继明, 张华华. HENMT1通过激活PI3K-AKT-mTOR信号通路促进胃癌的增殖与迁移[J]. 上海交通大学学报(医学版), 2025, 45(6): 717-726. |
| [5] | 张钲佳, 李小敏, 周鑫, 马海荣, 艾松涛. 高阶磁共振功能成像评估骨与软组织肿瘤价值初探[J]. 上海交通大学学报(医学版), 2025, 45(5): 585-596. |
| [6] | 邓佳丽, 郭嘉婧, 王静怡, 丁心怡, 朱仪, 王中领. 自组装载药纳米探针用于乳腺癌焦亡增敏及化学交换饱和转移成像研究[J]. 上海交通大学学报(医学版), 2025, 45(3): 271-281. |
| [7] | 张先洲, 杜凤麟, 吴雷, 任逸喆, 赵明娜, 娄加陶. OGT通过ERK信号通路促进非小细胞肺癌增殖的机制研究[J]. 上海交通大学学报(医学版), 2025, 45(10): 1288-1297. |
| [8] | 韩依杉, 徐梓淇, 陶梦玉, 范广建, 余波. PRMT6促进乳腺癌细胞的增殖和迁移[J]. 上海交通大学学报(医学版), 2024, 44(8): 999-1010. |
| [9] | 耿瑶, 张杨, 赵洁, 李伟, 蔡国青. MTA1在子痫前期胎盘组织中的表达及其对滋养细胞功能的影响[J]. 上海交通大学学报(医学版), 2024, 44(11): 1383-1390. |
| [10] | 高翌轩, 张亦弛, 戴鹭俨, 马皎. GALNT3作为潜在肿瘤分子标志物及药物靶点的研究进展[J]. 上海交通大学学报(医学版), 2024, 44(11): 1460-1465. |
| [11] | 刘启明, 卢启帆, 柴烨子, 姜萌, 卜军. 心脏磁共振短轴电影成像影像组学鉴别肥厚型心肌病与健康对照[J]. 上海交通大学学报(医学版), 2024, 44(1): 79-86. |
| [12] | 郑国培, 曹骎, 沈键锋. 赖氨酸乙酰转移酶7的冷冻电镜全长结构分析[J]. 上海交通大学学报(医学版), 2023, 43(9): 1099-1106. |
| [13] | 刘启明, 卢启帆, 柴烨子, 姜萌, 卜军. 基于影像组学特征预测左室射血分数的可行性研究[J]. 上海交通大学学报(医学版), 2023, 43(9): 1162-1168. |
| [14] | 马奔, 赵成, 束翌俊, 董平. CT影像组学在胃肠道间质瘤中的应用进展[J]. 上海交通大学学报(医学版), 2023, 43(7): 923-930. |
| [15] | 程然, 胡佳佳, 李彪. 18F-FDG PET/CT影像组学应用于淋巴瘤诊疗及预后预测的研究进展[J]. 上海交通大学学报(医学版), 2023, 43(6): 781-787. |
| 阅读次数 | ||||||
|
全文 |
|
|||||
|
摘要 |
|
|||||