上海交通大学学报(医学版) ›› 2025, Vol. 45 ›› Issue (10): 1342-1352.doi: 10.3969/j.issn.1674-8115.2025.10.009
刘佳1, 任灵杰1, 施敏敏1, 唐笑梅1, 马芳芳1, 秦洁洁1,2( )
)
收稿日期:2025-03-25
接受日期:2025-09-18
出版日期:2025-10-28
发布日期:2025-10-23
通讯作者:
秦洁洁,助理研究员,博士;电子信箱:qinjie2007@126.com。基金资助:
LIU Jia1, REN Lingjie1, SHI Minmin1, TANG Xiaomei1, MA Fangfang1, QIN Jiejie1,2()
Received:2025-03-25
Accepted:2025-09-18
Online:2025-10-28
Published:2025-10-23
Contact:
QIN Jiejie, E-mail: qinjie2007@126.com.Supported by:摘要:
目的·识别并评估用于诊断胰腺导管腺癌(pancreatic ductal adenocarcinoma,PDAC)的新型且可靠的非侵入性血清生物标志物。方法·收集2018年5月至2019年12月在上海交通大学医学院附属瑞金医院胰腺疾病诊疗中心招募的67例PDAC患者(Ruijin cohort Ⅰ)的肿瘤组织和匹配的癌旁正常组织,进行全蛋白质组学分析。利用生物信息学方法分析蛋白质组学数据来识别新的生物标志物,并应用受试者工作特征(receiver operating characteristic,ROC)曲线及曲线下面积(area under the curve,AUC)评价其诊断价值。下载并分析临床蛋白质组肿瘤分析联盟(Clinical Proteomic Tumor Analysis Consortium,CPTAC)发布的PDAC蛋白质组学及其mRNA数据。2021年6月至2022年6月招募47例PDAC患者和75例健康人(Ruijin cohort Ⅱ)开展病例对照研究。收集患者及健康人血清,应用酶联免疫吸附试验(enzyme-linked immunosorbent assay,ELISA)检测血清中新生物标志物的表达水平,评价新生物标志物的血清学诊断价值。结果·蛋白质组学数据的差异表达分析显示,胶原蛋白Ⅻ型α1链(collagen type Ⅻ α1 chain,COL12A1)为PDAC诊断的候选标志物,并且公共数据库CPTAC队列分析证实其在肿瘤组织中的表达高于正常邻近组织。COL12A1蛋白在PDAC患者血清中的表达显著高于健康人血清。其鉴别PDAC患者与健康人的AUC为0.82,敏感度为81%,特异度为83%。ROC曲线分析显示,COL12A1辅助糖类抗原199(carbohydrate antigen 199,CA199)鉴别PDAC患者与健康人的AUC显著高于单独使用CA199(AUCCA199=0.91 vs AUCCA199 + COL12A1=0.95,P<0.05)。此外,COL12A1有较高的能力鉴别早期PDAC患者(Ⅰ~Ⅱ期)与健康人(AUC=0.83),并且COL12A1联合CA199鉴别早期PDAC的AUC显著高于单独使用CA199(AUCCA199=0.92 vs AUCCA199 + COL12A1=0.97,P<0.05)。结论·COL12A1是一种潜在的PDAC血清学诊断标志物,能够与CA199联合用于检测早期PDAC。
中图分类号:
刘佳, 任灵杰, 施敏敏, 唐笑梅, 马芳芳, 秦洁洁. COL12A作为一种新型的胰腺导管腺癌血清诊断标志物的鉴定与评价[J]. 上海交通大学学报(医学版), 2025, 45(10): 1342-1352.
LIU Jia, REN Lingjie, SHI Minmin, TANG Xiaomei, MA Fangfang, QIN Jiejie. Identification and evaluation of COL12A1 as a novel serological diagnostic marker in pancreatic ductal adenocarcinoma[J]. Journal of Shanghai Jiao Tong University (Medical Science), 2025, 45(10): 1342-1352.
| Characteristic | Ruijin cohort Ⅰ (n=67) | CPTAC cohort (n=135) | Ruijin cohort Ⅱ | P2 value② | P3 value③ | P4 value④ | ||
|---|---|---|---|---|---|---|---|---|
| PDAC (n=47) | Normal (n=75) | P1 value① | ||||||
| Age/year | 63 (56, 67) | 65 (60, 71) | 67 (56, 71) | 64 (56, 69) | 0.317 | 0.058 | 0.054 | 0.375 |
| Gender/n(%) | 0.634 | 0.331 | 0.810 | 0.280 | ||||
| Female | 33 (49.3) | 64 (47.4) | 20 (42.6) | 37 (49.3) | ||||
| Male | 34 (50.7) | 71 (52.6) | 27 (57.4) | 38 (50.7) | ||||
| Race/n(%) | ‒ | <0.001 | <0.001 | <0.001 | ||||
| Black | 0 (0) | 2 (1.5) | 0 (0) | 0 (0) | ||||
| White | 0 (0) | 30 (22.2) | 0 (0) | 0 (0) | ||||
| Yellow | 67 (100) | 0 (0) | 47 (100) | 75 (100) | ||||
| NA | 0 (0) | 103 (76.3) | 0 (0) | 0 (0) | ||||
| TNM stage/n(%) | ‒ | <0.001 | <0.001 | 0.380 | ||||
| Ⅰ | 20 (29.9) | 23 (17.0) | 5 (10.6) | ‒ | ||||
| Ⅱ | 47 (70.1) | 56 (41.5) | 17 (36.2) | ‒ | ||||
| Ⅲ | 0 (0) | 41 (30.4) | 18 (38.3) | ‒ | ||||
| Ⅳ | 0 (0) | 9 (6.7) | 7 (14.9) | ‒ | ||||
| NA | 0 (0) | 6 (4.4) | 0 (0) | ‒ | ||||
| T stage/n(%) | ‒ | 0.185 | 0.120 | 0.720 | ||||
| T1 | 10 (14.9) | 10 (7.4) | 4 (8.5) | ‒ | ||||
| T2 | 20 (29.9) | 83 (61.5) | 20 (42.6) | ‒ | ||||
| T3 | 37 (55.2) | 39 (28.9) | 7 (14.9) | ‒ | ||||
| T4 | 0 (0) | 1 (0.7) | 16 (34.0) | ‒ | ||||
| TX | 0 (0) | 2 (1.5) | 0 (0) | ‒ | ||||
| N stage/n(%) | ‒ | <0.001 | <0.001 | 0.043 | ||||
| N0 | 44 (65.7) | 30 (22.2) | 12 (25.5) | ‒ | ||||
| N1 | 23 (34.3) | 51 (37.8) | 18 (38.3) | ‒ | ||||
| N2 | 0 (0) | 46 (34.1) | 14 (29.8) | ‒ | ||||
| NX | 0 (0) | 8 (5.9) | 3 (6.4) | ‒ | ||||
| M stage/n(%) | ‒ | <0.001 | <0.001 | 0.001 | ||||
| M0 | 67 (100) | 88 (65.2) | 40 (85.1) | ‒ | ||||
| M1 | 0 (0) | 8 (5.9) | 7 (14.9) | ‒ | ||||
| MX | 0 (0) | 39 (28.9) | 0 (0) | ‒ | ||||
表1 本研究中各队列的基本特征
Tab 1 Basic characteristics of the cohorts in the study
| Characteristic | Ruijin cohort Ⅰ (n=67) | CPTAC cohort (n=135) | Ruijin cohort Ⅱ | P2 value② | P3 value③ | P4 value④ | ||
|---|---|---|---|---|---|---|---|---|
| PDAC (n=47) | Normal (n=75) | P1 value① | ||||||
| Age/year | 63 (56, 67) | 65 (60, 71) | 67 (56, 71) | 64 (56, 69) | 0.317 | 0.058 | 0.054 | 0.375 |
| Gender/n(%) | 0.634 | 0.331 | 0.810 | 0.280 | ||||
| Female | 33 (49.3) | 64 (47.4) | 20 (42.6) | 37 (49.3) | ||||
| Male | 34 (50.7) | 71 (52.6) | 27 (57.4) | 38 (50.7) | ||||
| Race/n(%) | ‒ | <0.001 | <0.001 | <0.001 | ||||
| Black | 0 (0) | 2 (1.5) | 0 (0) | 0 (0) | ||||
| White | 0 (0) | 30 (22.2) | 0 (0) | 0 (0) | ||||
| Yellow | 67 (100) | 0 (0) | 47 (100) | 75 (100) | ||||
| NA | 0 (0) | 103 (76.3) | 0 (0) | 0 (0) | ||||
| TNM stage/n(%) | ‒ | <0.001 | <0.001 | 0.380 | ||||
| Ⅰ | 20 (29.9) | 23 (17.0) | 5 (10.6) | ‒ | ||||
| Ⅱ | 47 (70.1) | 56 (41.5) | 17 (36.2) | ‒ | ||||
| Ⅲ | 0 (0) | 41 (30.4) | 18 (38.3) | ‒ | ||||
| Ⅳ | 0 (0) | 9 (6.7) | 7 (14.9) | ‒ | ||||
| NA | 0 (0) | 6 (4.4) | 0 (0) | ‒ | ||||
| T stage/n(%) | ‒ | 0.185 | 0.120 | 0.720 | ||||
| T1 | 10 (14.9) | 10 (7.4) | 4 (8.5) | ‒ | ||||
| T2 | 20 (29.9) | 83 (61.5) | 20 (42.6) | ‒ | ||||
| T3 | 37 (55.2) | 39 (28.9) | 7 (14.9) | ‒ | ||||
| T4 | 0 (0) | 1 (0.7) | 16 (34.0) | ‒ | ||||
| TX | 0 (0) | 2 (1.5) | 0 (0) | ‒ | ||||
| N stage/n(%) | ‒ | <0.001 | <0.001 | 0.043 | ||||
| N0 | 44 (65.7) | 30 (22.2) | 12 (25.5) | ‒ | ||||
| N1 | 23 (34.3) | 51 (37.8) | 18 (38.3) | ‒ | ||||
| N2 | 0 (0) | 46 (34.1) | 14 (29.8) | ‒ | ||||
| NX | 0 (0) | 8 (5.9) | 3 (6.4) | ‒ | ||||
| M stage/n(%) | ‒ | <0.001 | <0.001 | 0.001 | ||||
| M0 | 67 (100) | 88 (65.2) | 40 (85.1) | ‒ | ||||
| M1 | 0 (0) | 8 (5.9) | 7 (14.9) | ‒ | ||||
| MX | 0 (0) | 39 (28.9) | 0 (0) | ‒ | ||||

图1 通过Ruijin cohort Ⅰ中PDAC肿瘤组织和癌旁组织的全蛋白质组学分析鉴定出COL12A1Note: A. PCA of proteomic data from 134 samples (67 tumor tissues vs 67 adjacent normal tissues). Each dot represents one sample, with red dots indicating tumor samples and blue dots indicating adjacent normal tissues. B. Volcano plot of differentially expressed proteins between tumor and adjacent normal tissues. Each dot represents one protein, with red dots indicating significantly upregulated proteins in tumors and blue dots indicating significantly downregulated proteins. FC—fold change. C. Pathway enrichment analysis identified based on significantly up/down-regulated proteins created by xEnrichCompare from XGR version 1.1.8. D. Boxplot of COL12A1 abundance in the Ruijin cohort Ⅰ. T—tumor; N—normal. E. ROC curve of COL12A1 for discriminating PDAC tumor tissues from adjacent normal tissues in the Ruijin cohort Ⅰ.
Fig 1 Identificating COL12A1 from global proteomic profiling of PDAC tumor tissues and adjacent normal tissues in the Ruijin cohort Ⅰ
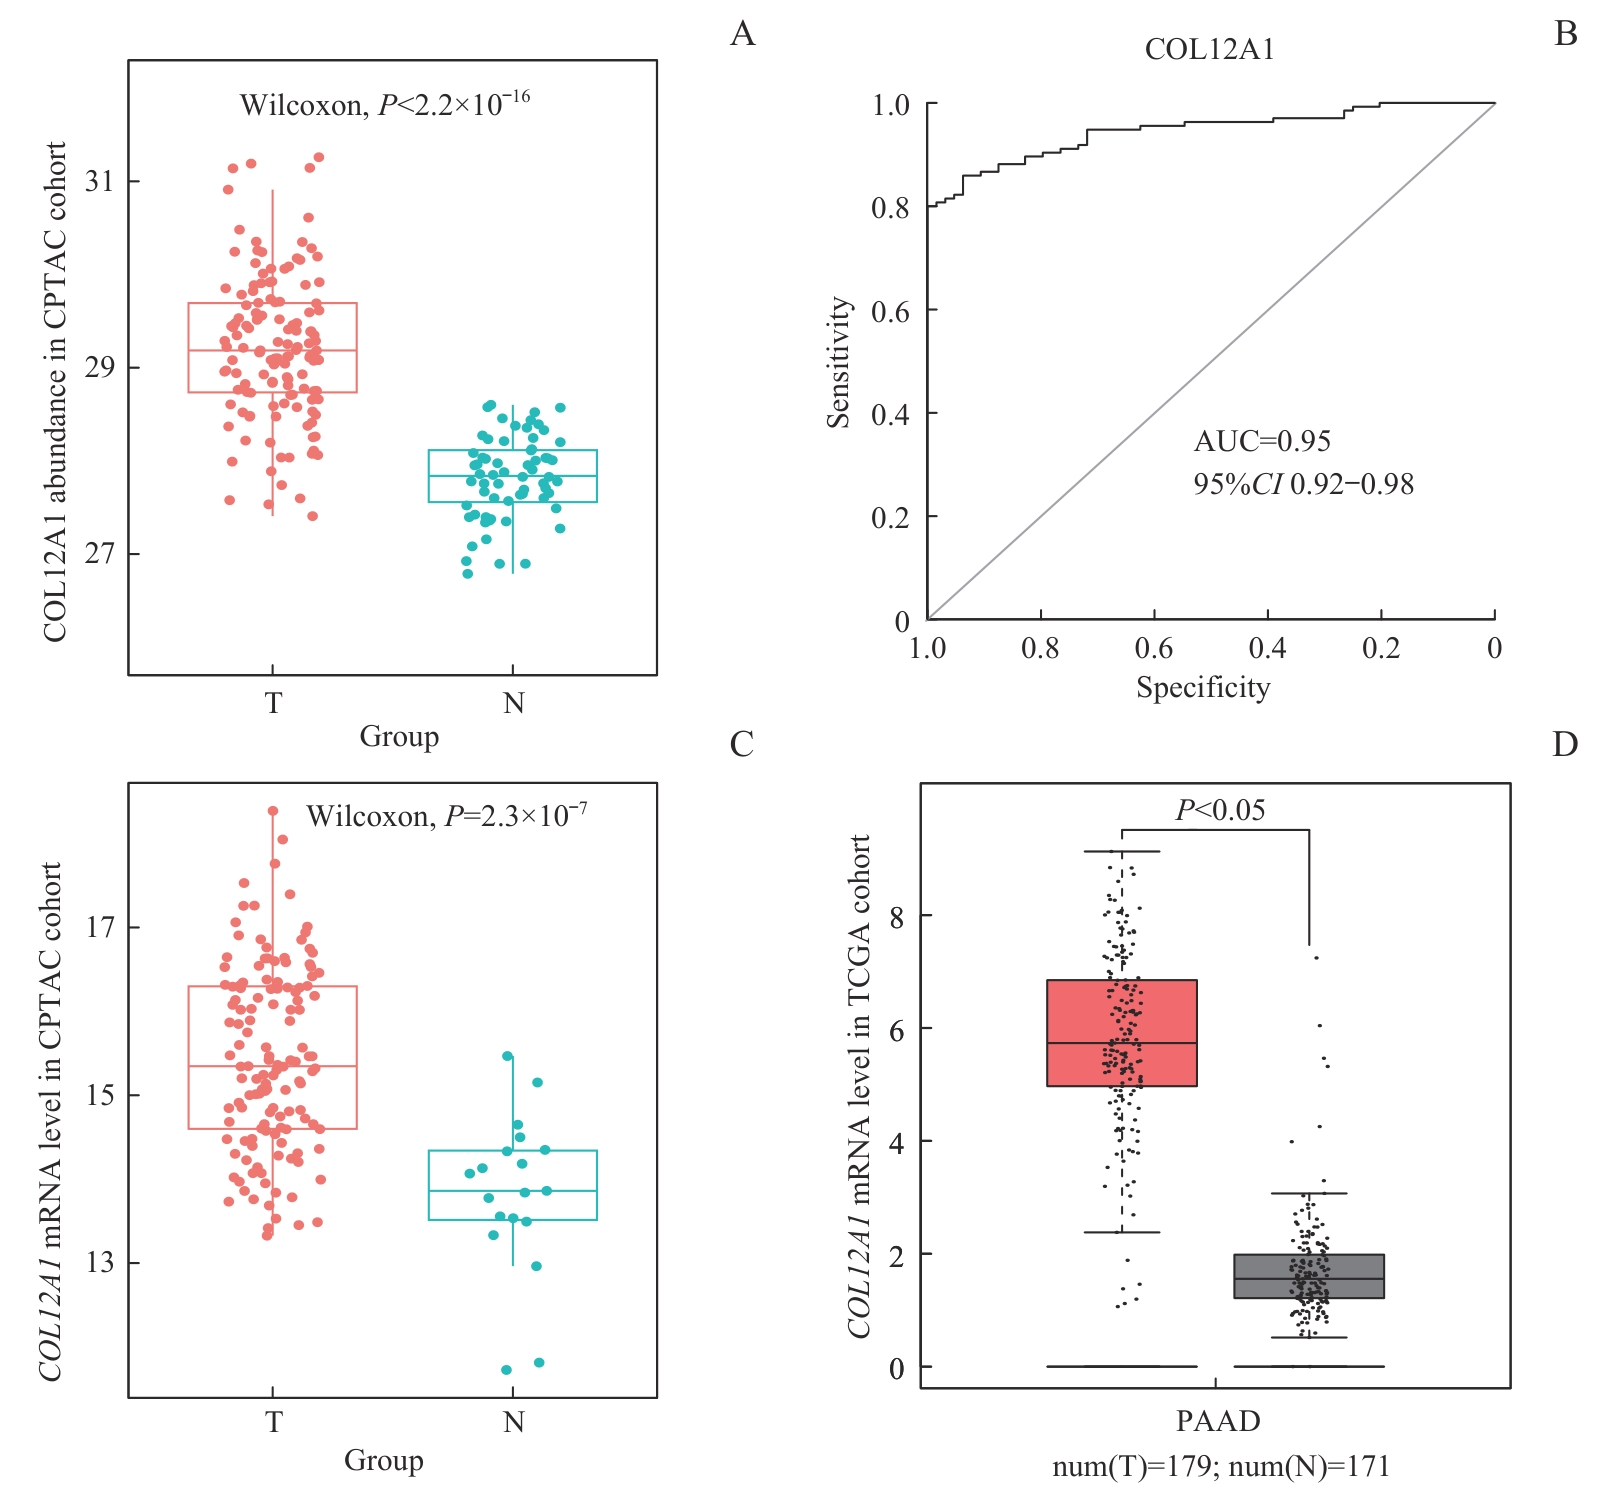
图2 CPTAC队列和TCGA队列中PDAC肿瘤和正常组织中COL12A1蛋白和mRNA的表达水平Note: A. Box plot showing COL12A1 protein abundance in the CPTAC cohort. B. ROC curve of COL12A1 protein for distinguishing PDAC from adjacent normal tissues in the CPTAC cohort. C. Box plot showing COL12A1 mRNA expression in the CPTAC cohort. D. Box plot showing COL12A1 mRNA expression in the TCGA cohort (generated using the online tool GEPIA). T—tumor; N—normal.
Fig 2 Expression levels of COL12A1 protein and mRNA in PDAC and adjacent normal tissues in the CPTAC and TCGA cohorts

图 3 Ruijin cohort Ⅱ中COL12A1和CA199蛋白鉴别PDAC和健康人血清的表现Note: A/B. Box plots showing the serum levels of COL12A1 (A) and CA199 (B) in PDAC patients and healthy individuals in the Ruijin cohort Ⅱ. C. ROC curves of COL12A1, CA199, and their combination for distinguishing PDAC from normal human sera in the Ruijin cohort Ⅱ. The optimal cut-off values are labeled by dots on the ROC curves. The numbers outside the parenthesis represent the optimal cut-off values, while those inside the parentheses represent specificity and sensitivity, respectively. D. Boxplots of the positive rates of COL12A1, CA199, and their combination in the Ruijin cohort Ⅱ. NHS—normal human sera.
Fig 3 Diagnostic performance of COL12A1 and CA199 proteins in distinguishing PDAC from normal human sera in the Ruijin cohort Ⅱ
| Item | AUC | 95%CI | Accuracy/% | κ value | Sensitivity/% | Specificity/% |
|---|---|---|---|---|---|---|
| All PDAC vs NHS | ||||||
| COL12A1 | 0.82 | 0.74‒0.90 | 82 | 0.63 | 81 | 83 |
| CA199 | 0.91 | 0.85‒0.96 | 88 | 0.75 | 89 | 87 |
| COL12A1+CA199 | 0.95 | 0.91‒0.99 | 92 | 0.83 | 94 | 91 |
| PDAC (Ⅰ‒Ⅱ stage) vs NHS | ||||||
| COL12A1 | 0.83 | 0.75‒0.92 | 81 | 0.53 | 77 | 83 |
| CA199 | 0.92 | 0.86‒0.97 | 88 | 0.69 | 91 | 87 |
| COL12A1+CA199 | 0.97 | 0.93‒0.99 | 92 | 0.79 | 95 | 91 |
| PDAC (T1-T2 stage) vs NHS | ||||||
| COL12A1 | 0.85 | 0.77‒0.93 | 83 | 0.59 | 83 | 83 |
| CA199 | 0.93 | 0.88‒0.98 | 89 | 0.73 | 96 | 87 |
| COL12A1+CA199 | 0.98 | 0.96‒1.00 | 92 | 0.80 | 96 | 91 |
| PDAC (N0 stage) vs NHS | ||||||
| COL12A1 | 0.84 | 0.75‒0.94 | 83 | 0.48 | 83 | 83 |
| CA199 | 0.92 | 0.86‒0.98 | 91 | 0.60 | 92 | 87 |
| COL12A1+CA199 | 0.97 | 0.94‒1.00 | 92 | 0.73 | 100 | 91 |
| PDAC (well-differentiated) vs NHS | ||||||
| COL12A1 | 0.80 | 0.69‒0.91 | 82 | 0.54 | 80 | 83 |
| CA199 | 0.89 | 0.79‒0.98 | 87 | 0.67 | 90 | 87 |
| COL12A1+CA199 | 0.94 | 0.85‒1.00 | 91 | 0.74 | 90 | 91 |
表2 COL12A1辅助CA199诊断PDAC的价值
Tab 2 Complementary diagnostic value of COL12A1 to CA199 in the diagnosis of PDAC
| Item | AUC | 95%CI | Accuracy/% | κ value | Sensitivity/% | Specificity/% |
|---|---|---|---|---|---|---|
| All PDAC vs NHS | ||||||
| COL12A1 | 0.82 | 0.74‒0.90 | 82 | 0.63 | 81 | 83 |
| CA199 | 0.91 | 0.85‒0.96 | 88 | 0.75 | 89 | 87 |
| COL12A1+CA199 | 0.95 | 0.91‒0.99 | 92 | 0.83 | 94 | 91 |
| PDAC (Ⅰ‒Ⅱ stage) vs NHS | ||||||
| COL12A1 | 0.83 | 0.75‒0.92 | 81 | 0.53 | 77 | 83 |
| CA199 | 0.92 | 0.86‒0.97 | 88 | 0.69 | 91 | 87 |
| COL12A1+CA199 | 0.97 | 0.93‒0.99 | 92 | 0.79 | 95 | 91 |
| PDAC (T1-T2 stage) vs NHS | ||||||
| COL12A1 | 0.85 | 0.77‒0.93 | 83 | 0.59 | 83 | 83 |
| CA199 | 0.93 | 0.88‒0.98 | 89 | 0.73 | 96 | 87 |
| COL12A1+CA199 | 0.98 | 0.96‒1.00 | 92 | 0.80 | 96 | 91 |
| PDAC (N0 stage) vs NHS | ||||||
| COL12A1 | 0.84 | 0.75‒0.94 | 83 | 0.48 | 83 | 83 |
| CA199 | 0.92 | 0.86‒0.98 | 91 | 0.60 | 92 | 87 |
| COL12A1+CA199 | 0.97 | 0.94‒1.00 | 92 | 0.73 | 100 | 91 |
| PDAC (well-differentiated) vs NHS | ||||||
| COL12A1 | 0.80 | 0.69‒0.91 | 82 | 0.54 | 80 | 83 |
| CA199 | 0.89 | 0.79‒0.98 | 87 | 0.67 | 90 | 87 |
| COL12A1+CA199 | 0.94 | 0.85‒1.00 | 91 | 0.74 | 90 | 91 |
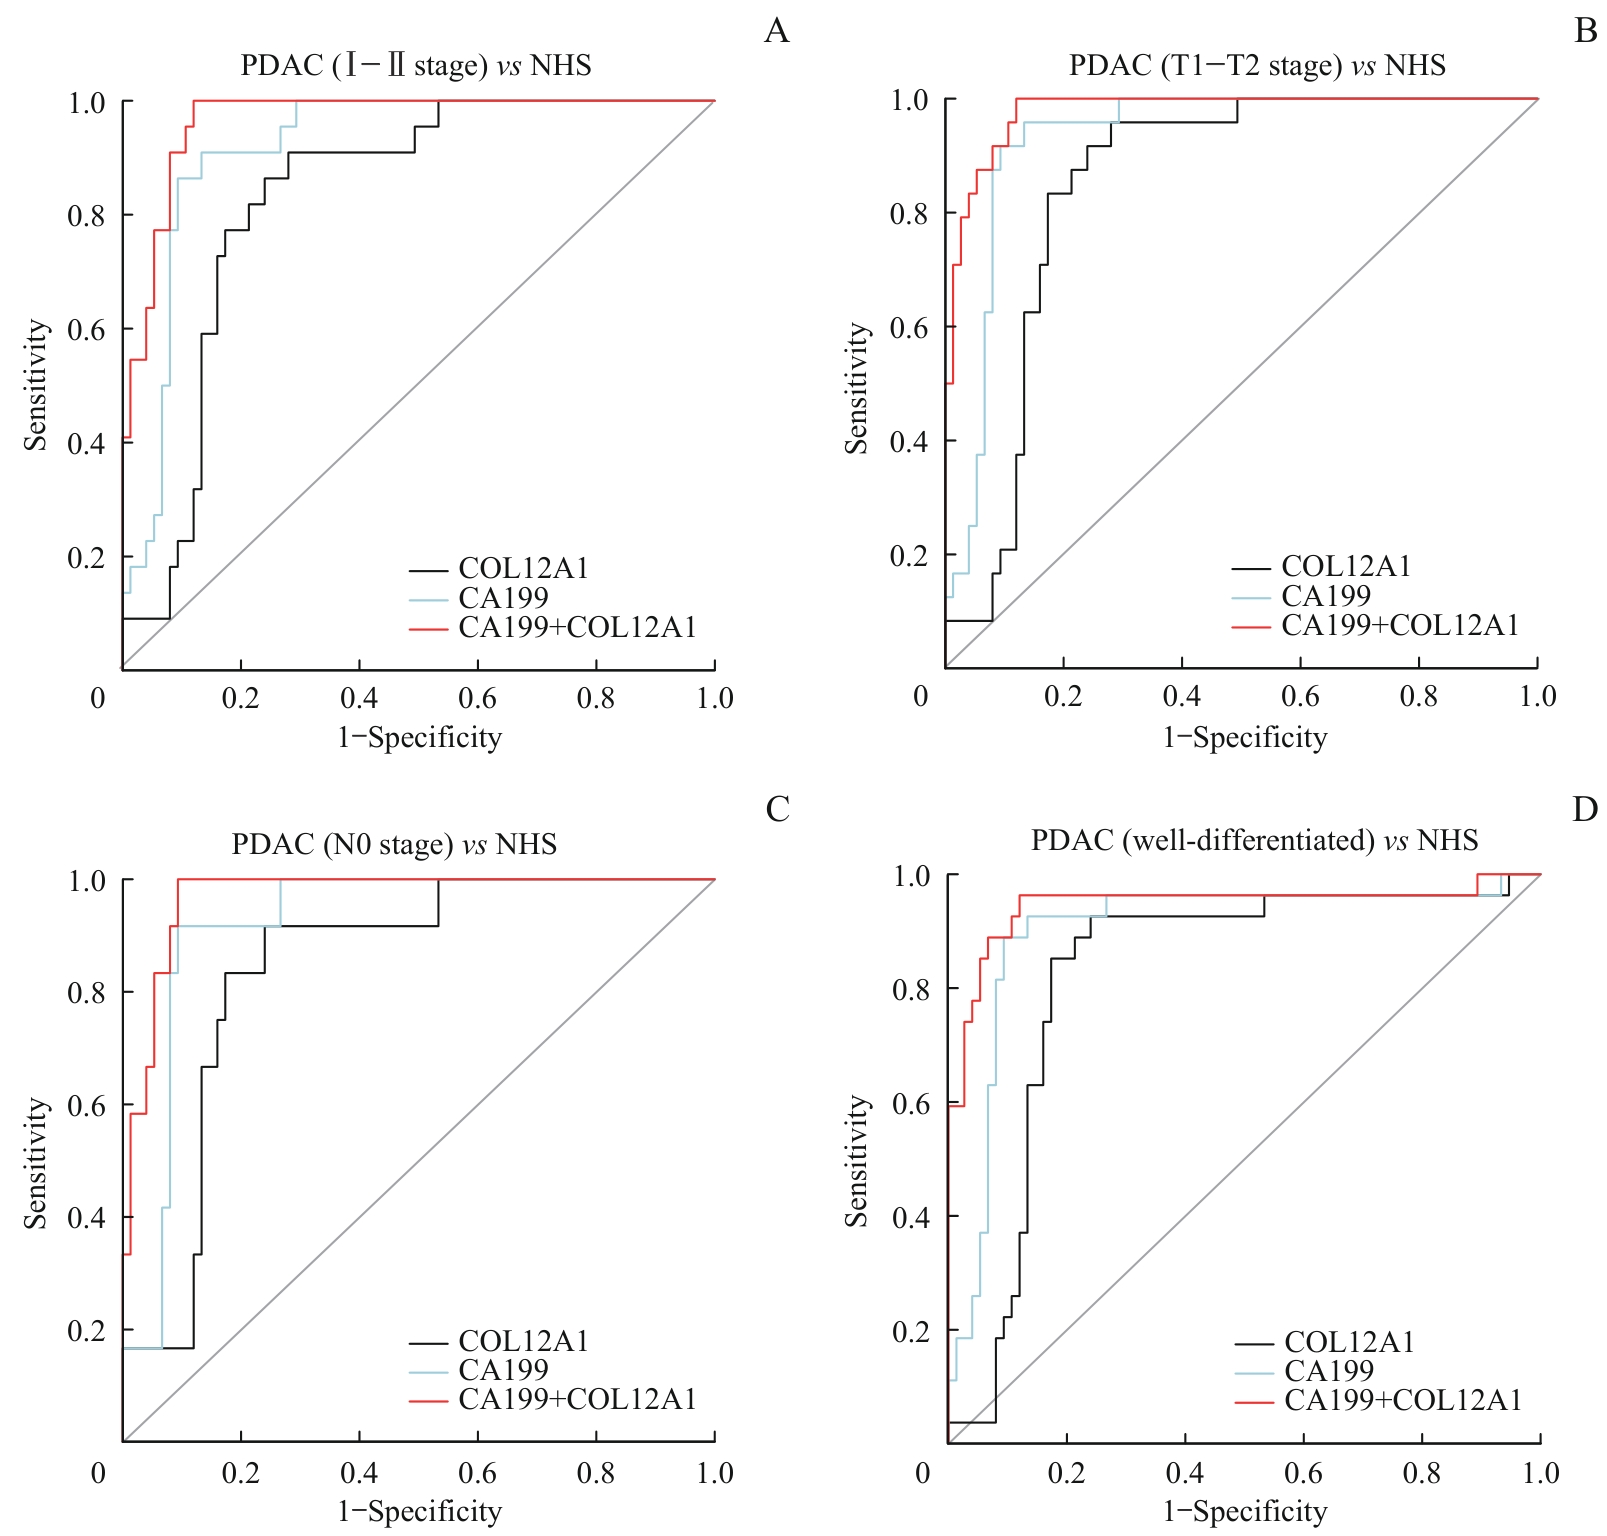
图4 基于TNM分期、分化程度、T分期和N分期,COL12A1、CA199及其组合在PDAC患者亚组中的诊断价值Note: A. ROC curves of COL12A1, CA199, and their combination for distinguishing early-stage PDAC (Ⅰ‒Ⅱ stage) from healthy individuals. B. ROC curves of COL12A1, CA199, and their combination for distinguishing PDAC (T1‒T2 stage) from healthy individuals. C. ROC curves of COL12A1, CA199, and their combination for distinguishing early PDAC (N0 stage) from healthy individuals. D. ROC curves of COL12A1, CA199, and their combination for distinguishing PDAC (well-differentiated) from healthy individuals.
Fig 4 Diagnostic performance of COL12A1, CA199, and their combination in the subgroups of PDAC patients based on TNM stage, differentiation, T stage, and N stage
| [1] | SUNG H, FERLAY J, SIEGEL R L, et al. Global cancer statistics 2020: globocan estimates of incidence and mortality worldwide for 36 cancers in 185 countries[J]. CA Cancer J Clin, 2021, 71(3): 209-249. |
| [2] | RYAN D P, HONG T S, BARDEESY N. Pancreatic adenocarcinoma[J]. N Engl J Med, 2014, 371(11): 1039-1049. |
| [3] | 佟陈昀颢. 中国大陆地区胰腺癌回顾性临床流行病学研究[D]. 北京: 北京协和医学院, 2024. |
| TONG C Y H. A retrospective clinical epidemiology study of pancreatic cancer in mainland China[D]. Beijing: Peking Union Medical College, 2024. | |
| [4] | MIZRAHI J D, SURANA R, VALLE J W, et al. Pancreatic cancer[J]. Lancet, 2020, 395(10242): 2008-2020. |
| [5] | 胡斌, 宋少莉. 胰腺癌的治疗进展[J]. 上海交通大学学报(医学版), 2015, 35(3): 445-449. |
| HU B, Song S L. Progresses of treatment of pancreatic cancer[J]. Journal of Shanghai Jiao Tong University (Medical Science), 2015, 35(3): 445-449. | |
| [6] | LUO G P, JIN K Z, DENG S M, et al. Roles of CA19-9 in pancreatic cancer: biomarker, predictor and promoter[J]. Biochim Biophys Acta Rev Cancer, 2021, 1875(2): 188409. |
| [7] | BOYD L N C, ALI M, COMANDATORE A, et al. Prediction model for early-stage pancreatic cancer using routinely measured blood biomarkers[J]. JAMA Netw Open, 2023, 6(8): e2331197. |
| [8] | HICKS D, FARSANI G T, LAVAL S, et al. Mutations in the collagen Ⅻ gene define a new form of extracellular matrix-related myopathy[J]. Hum Mol Genet, 2014, 23(9): 2353-2363. |
| [9] | ZHANG Y P, WANG H X, GAO Z C, et al. COL12A1 promotes osteosarcoma progression via the FAK/PI3K/AKT/mTOR pathway[J]. Curr Mol Med, 2024. DOI:10.2174/0115665240322280240903111159. |
| [10] | YAN Y L, LIANG Q J, LIU Y H, et al. COL12A1 as a prognostic biomarker links immunotherapy response in breast cancer[J]. Endocr Relat Cancer, 2023, 30(5): e230012. |
| [11] | 张文姣. COL12A1在胰腺癌中的表达与临床病理特征及预后的关系[D]. 青岛: 青岛大学, 2024. |
| ZHANG W J. The expression of COL12A1 in pancreatic cancer and its relationship with clinicopathological features and prognosis[D]. Qingdao: Qingdao University, 2024. | |
| [12] | KRUG K, JAEHNIG E J, SATPATHY S, et al. Proteogenomic landscape of breast cancer tumorigenesis and targeted therapy[J]. Cell, 2020, 183(5): 1436-1456.e31. |
| [13] | JIANG L X, QIN J J, DAI Y T, et al. Prospective observational study on biomarkers of response in pancreatic ductal adenocarcinoma[J]. Nat Med, 2024, 30(3): 749-761. |
| [14] | RITCHIE M E, PHIPSON B, WU D, et al. Limma powers differential expression analyses for RNA-sequencing and microarray studies[J]. Nucleic Acids Res, 2015, 43(7): e47. |
| [15] | FANG H, KNEZEVIC B, BURNHAM K L, et al. XGR software for enhanced interpretation of genomic summary data, illustrated by application to immunological traits[J]. Genome Med, 2016, 8(1): 129. |
| [16] | DELONG E R, DELONG D M, CLARKE-PEARSON D L. Comparing the areas under two or more correlated receiver operating characteristic curves: a nonparametric approach[J]. Biometrics, 1988, 44(3): 837-845. |
| [17] | CAO L W, HUANG C, ZHOU D C, et al. Proteogenomic characterization of pancreatic ductal adenocarcinoma[J]. Cell, 2021, 184(19): 5031-5052.e26. |
| [18] | AMIN M B, EDGE S, GREENE F L. AJCC cancer staging manual[M]. 8th ed. New York: Springer, 2017: 327-335. |
| [19] | DOU Y C, KATSNELSON L, GRITSENKO M A, et al. Proteogenomic insights suggest druggable pathways in endometrial carcinoma[J]. Cancer Cell, 2023, 41(9): 1586-1605.e15. |
| [20] | 李宝宝. 基于蛋白质组学技术筛选脑膜瘤诊断的血清学潜在生物标志物的研究[D]. 延安: 延安大学, 2022. |
| LI B B. Screening serological diagnosis of meningioma based on proteomic techniques studies on potential biomarkers[D]. Yan'an: Yan'an University, 2022. | |
| [21] | GERECKE D R, OLSON P F, KOCH M, et al. Complete primary structure of two splice variants of collagen Ⅻ, and assignment of alpha 1 (Ⅻ) collagen (COL12A1), alpha 1 (Ⅸ) collagen (COL9A1), and alpha 1 (ⅩⅨ) collagen (COL19A1) to human chromosome 6q12-q13[J]. Genomics, 1997, 41(2): 236-242. |
| [22] | XU S S, XU H X, WANG W Q, et al. The role of collagen in cancer: from bench to bedside[J]. J Transl Med, 2019, 17(1): 309. |
| [23] | TIAN C X, HUANG Y, CLAUSER K R, et al. Suppression of pancreatic ductal adenocarcinoma growth and metastasis by fibrillar collagens produced selectively by tumor cells[J]. Nat Commun, 2021, 12(1): 2328. |
| [24] | GELSE K, PÖSCHL E, AIGNER T. Collagens: structure, function, and biosynthesis[J]. Adv Drug Deliv Rev, 2003, 55(12): 1531-1546. |
| [25] | NISSEN N I, KARSDAL M, WILLUMSEN N. Collagens and cancer associated fibroblasts in the reactive stroma and its relation to cancer biology[J]. J Exp Clin Cancer Res, 2019, 38(1): 115. |
| [26] | THORLACIUS-USSING J, JENSEN C, MADSEN E A, et al. Type ⅩⅩ collagen is elevated in circulation of patients with solid tumors[J]. Int J Mol Sci, 2022, 23(8): 4144. |
| [27] | WILLUMSEN N, ALI S M, LEITZEL K, et al. Collagen fragments quantified in serum as measures of desmoplasia associate with survival outcome in patients with advanced pancreatic cancer[J]. Sci Rep, 2019, 9(1): 19761. |
| [28] | SONG Y, WANG L, WANG K D, et al. COL12A1 acts as a novel prognosis biomarker and activates cancer-associated fibroblasts in pancreatic cancer through bioinformatics and experimental validation[J]. Cancers (Basel), 2023, 15(5): 1480. |
| [29] | WERNER S, CHEN H D, TAO S, et al. Systematic review: serum autoantibodies in the early detection of gastric cancer[J]. Int J Cancer, 2015, 136(10): 2243-2252. |
| [30] | PEPE M S, ETZIONI R, FENG Z, et al. Phases of biomarker development for early detection of cancer[J]. J Natl Cancer Inst, 2001, 93(14): 1054-1061. |
| [31] | SONG J, SOKOLL L J, PASAY J J, et al. Identification of serum biomarker panels for the early detection of pancreatic cancer[J]. Cancer Epidemiol Biomarkers Prev, 2019, 28(1): 174-182. |
| [32] | 李祥苏, 王冬冬, 吴旭东. 血清MUC5AC和CA199联合检测在胰腺癌诊断中的作用[J]. 现代肿瘤医学, 2022, 30(5): 852-855. |
| LI X S, WANG D D, WU X D. Evaluation of serum MUC5AC in combination with CA199 for the diagnosis of pancreatic cancer[J]. Journal of Modern Oncology, 2022, 30(5): 852-855. | |
| [33] | KIM J, BAMLET W R, OBERG A L, et al. Detection of early pancreatic ductal adenocarcinoma with thrombospondin-2 and CA19-9 blood markers[J]. Sci Transl Med, 2017, 9(398): eaah5583. |
| [34] | LEI X F, JIA S Z, YE J, et al. Application values of detection of serum CA199, CA242 and CA50 in the diagnosis of pancreatic cancer[J]. J Biol Regul Homeost Agents, 2017, 31(2): 383-388. |
| [35] | DONG D, JIA L, ZHANG L F, et al. Periostin and CA242 as potential diagnostic serum biomarkers complementing CA19.9 in detecting pancreatic cancer[J]. Cancer Sci, 2018, 109(9): 2841-2851. |
| [36] | HUANG B W, HUANG H R, ZHANG S T, et al. Artificial intelligence in pancreatic cancer[J]. Theranostics, 2022, 12(16): 6931-6954. |
| [1] | 胥瀚文, 陈墨馨, 梁小乙, 舒琴, 聂琬钦, 杨雪峰, 沈慜瑄, 黎晓静, 曹禹, 李琳. 基于面部照片的眼病智能诊断研究进展[J]. 上海交通大学学报(医学版), 2025, 45(9): 1249-1255. |
| [2] | 黄昕, 刘家辉, 叶敬文, 钱文莉, 许万星, 王琳. 基于机器学习的小细胞肺癌代谢分子诊断模型的建立和临床应用[J]. 上海交通大学学报(医学版), 2025, 45(8): 1009-1016. |
| [3] | 张兴利, 田洁, 罗菁, 刘倩, 欧阳皖雁, 邱宏春, 王焰, 糜坚青. 剂量减低的来那度胺/美法仑/醋酸泼尼松方案治疗老年虚弱新诊断多发性骨髓瘤的效果分析[J]. 上海交通大学学报(医学版), 2025, 45(7): 815-822. |
| [4] | 刘楚萱, 左佳鑫, 熊屏. 基于超声评分参数及临床指标的列线图鉴别原发性干燥综合征与IgG4相关唾液腺炎[J]. 上海交通大学学报(医学版), 2025, 45(3): 373-380. |
| [5] | 木司塔巴·木台力甫, 王俊杰, 钱云臻, 陈溯源, 邵达, 张志刚, 李冬雪. 预免疫策略结合mVenus-p27K-系统构建休眠肿瘤小鼠模型[J]. 上海交通大学学报(医学版), 2024, 44(9): 1104-1114. |
| [6] | 唐培源, 汪崇泽, 洪武, 费慧, 易正辉, 吕钦谕. 以间歇性晕倒伴随肌阵挛发作为主要表现的分离转换障碍1例报道[J]. 上海交通大学学报(医学版), 2024, 44(8): 1056-1060. |
| [7] | 郭勇麟, 陈墨馨, 刘哲源, 李奕霏, 王子琦, 舒琴, 李琳. 基于人工智能技术的斜视诊疗进展[J]. 上海交通大学学报(医学版), 2024, 44(3): 393-398. |
| [8] | 邓青松, 张长青, 陶诗聪. 烟酰胺代谢相关基因与骨关节炎的关系探索[J]. 上海交通大学学报(医学版), 2024, 44(2): 145-160. |
| [9] | 杨婧偊, 陈留宝, 王康太, 杨兴智, 于海涛. 基于实验室指标的系统性红斑狼疮鉴别诊断列线图的构建及评估[J]. 上海交通大学学报(医学版), 2024, 44(2): 204-211. |
| [10] | 陈溯源, 木司塔巴·木台力甫, 李冬雪, 张志刚. 黏附性G蛋白偶联受体F1在胰腺导管腺癌中的表达及其促进癌症进展的机制研究[J]. 上海交通大学学报(医学版), 2024, 44(1): 23-34. |
| [11] | 杨越, 何开举, 宗家豪, 杨自逸, 吴向嵩, 龚伟. 细胞游离DNA在胆道癌诊断中的价值:一项meta分析[J]. 上海交通大学学报(医学版), 2023, 43(9): 1175-1185. |
| [12] | 王颖雯, 李小玲, 代佳佳, 刘芳, 黄剑峰, 王立波, 张晓波, 冯瑞. 儿童重症支气管哮喘的流行病学特征及危险因素:一项单中心前瞻性队列研究[J]. 上海交通大学学报(医学版), 2023, 43(6): 665-672. |
| [13] | 党向阳, 唐雨一, 李卫国, 刘恩梅. 呼出气一氧化氮检测对儿童咳嗽变异性哮喘诊断价值的系统评价和meta分析[J]. 上海交通大学学报(医学版), 2023, 43(6): 680-688. |
| [14] | 李瑛, 谭阳霞, 尹虹心, 蒋雁翎, 陈立, 蒙国宇. ZNF384融合亚型急性白血病的发病机制及预后研究进展[J]. 上海交通大学学报(医学版), 2023, 43(5): 631-640. |
| [15] | 潘泓, 廖颖娜, 盖严支, 钱立恒, 聂惠贞. 分选链接蛋白1在胰腺导管腺癌中的表达及其促进胰腺导管腺癌进展的机制研究[J]. 上海交通大学学报(医学版), 2023, 43(3): 278-292. |
| 阅读次数 | ||||||
|
全文 |
|
|||||
|
摘要 |
|
|||||