上海交通大学学报(医学版) ›› 2026, Vol. 46 ›› Issue (4): 509-520.doi: 10.3969/j.issn.1674-8115.2026.04.011
诸梦琳1, 刘骁2, 徐晓丹1, 王甘红3, 夏开建4, 陈健1,4( )
)
收稿日期:2025-11-04
接受日期:2026-02-28
出版日期:2026-04-28
发布日期:2026-04-16
通讯作者:
陈 健,副主任医师,硕士;电子信箱:szcs10132716@163.com。基金资助:
Zhu Menglin1, Liu Xiao2, Xu Xiaodan1, Wang Ganhong3, Xia Kaijian4, Chen Jian1,4()
Received:2025-11-04
Accepted:2026-02-28
Online:2026-04-28
Published:2026-04-16
Contact:
Chen Jian,E-mail:szcs10132716@163.com.Supported by:摘要:
目的·构建一个多模态预测模型,将内镜创面图像与临床特征相结合,运用深度学习与机器学习技术,预测术后迟发性出血(delayed post-polypectomy bleeding,DPPB)的风险。方法·收集在2家医院行结肠息肉内镜下切除术患者的临床资料及术后内镜创面图像。研究共设计3个阶段:第一阶段,采用迁移学习训练的YOLOv11模型对创面图像进行自动识别与分割,提取感兴趣区域(region of interest,ROI);第二阶段,以ROI图像为输入项,构建基于ResNet50架构的深度神经网络,结合术后是否发生DPPB进行监督学习,输出标准化的内镜影像学评分(endoscopic score,E-Score);第三阶段,将E-Score与患者临床特征融合,利用LASSO回归进行特征选择,并将筛选后的变量输入多种机器学习模型训练,构建多模态DPPB预测模型。最终,基于Streamlit框架开发一款便于医护人员使用的网络应用工具(application,APP)。结果·共纳入2 782例接受结肠息肉切除术的患者,其中228例(8.20%)发生了DPPB。在测试集中,由XGBoost算法构建的多模态预测模型(PrismDPPB)表现最优,曲线下面积(area under the curve,AUC)达到0.831(95%CI 0.81~0.85),优于其他模型。此外,该模型在准确率(79.78%)、灵敏度(77.28%)、阳性预测值(81.32%)以及F1分数(79.25%)方面亦表现最佳。特征重要性分析显示,对模型预测贡献最大的6项变量依次为E-Score、息肉最大基底直径、性别、有无蒂、体质量指数以及息肉位置。模型解释性方面,使用SHAP图对预测结果进行了可视化解释。结论·融合创面影像组学特征与患者临床特征所构建的多模态预测模型及配套APP,在DPPB的风险评估中表现出良好的实用性与临床应用潜力。
中图分类号:
诸梦琳, 刘骁, 徐晓丹, 王甘红, 夏开建, 陈健. 多模态模型预测结肠息肉切除术后迟发性出血[J]. 上海交通大学学报(医学版), 2026, 46(4): 509-520.
Zhu Menglin, Liu Xiao, Xu Xiaodan, Wang Ganhong, Xia Kaijian, Chen Jian. Prediction of delayed post-polypectomy bleeding using a multimodal model[J]. Journal of Shanghai Jiao Tong University (Medical Science), 2026, 46(4): 509-520.
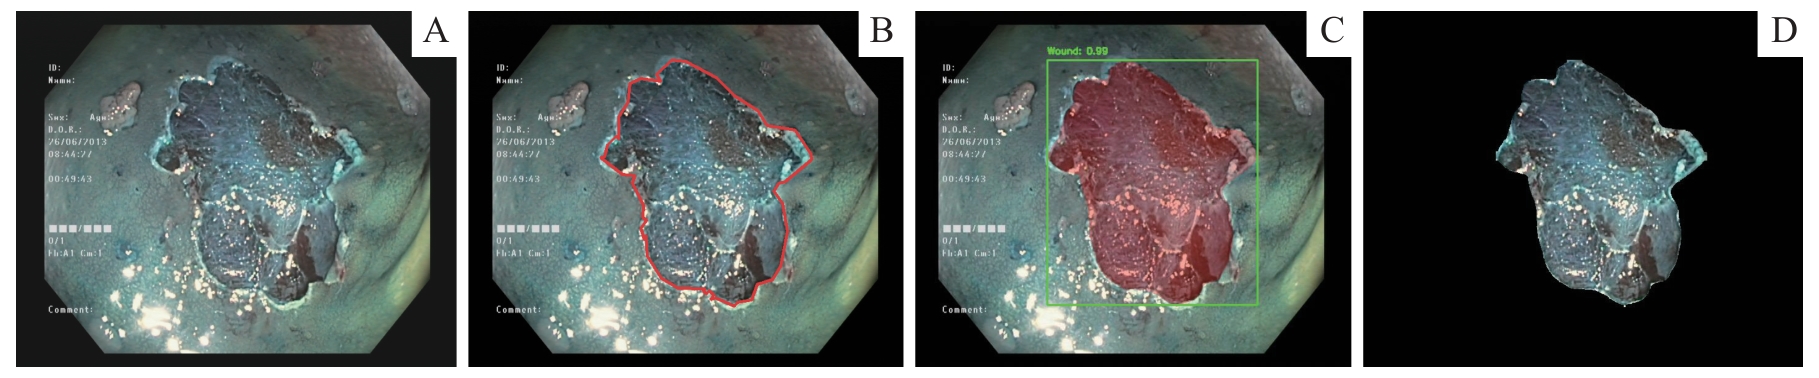
图1 结肠息肉切除术后创面图像的分割流程示意图Note: A. Original endoscopic image. B. Manually annotated image. C. Segmentation results of model α with confidence box display. D. Extracted ROI image for subsequent radiomics analysis.
Fig 1 Schematic diagram of the segmentation workflow for post-polypectomy wound images
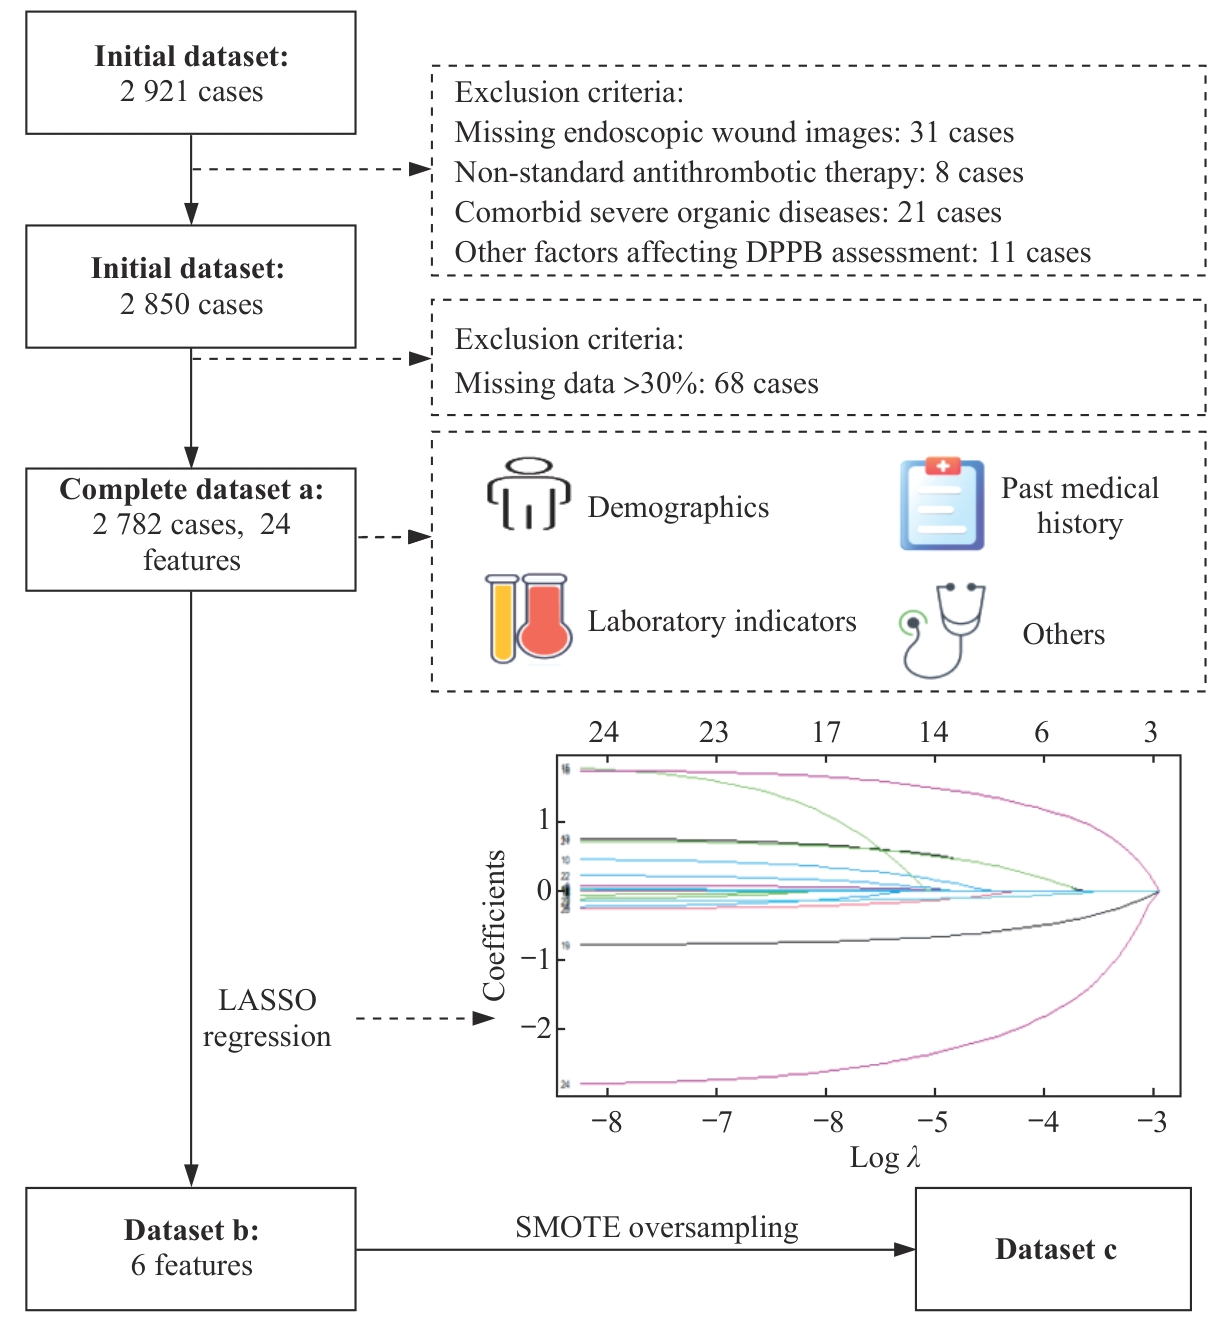
图2 特征筛选流程
Fig 2 Feature selection workflow
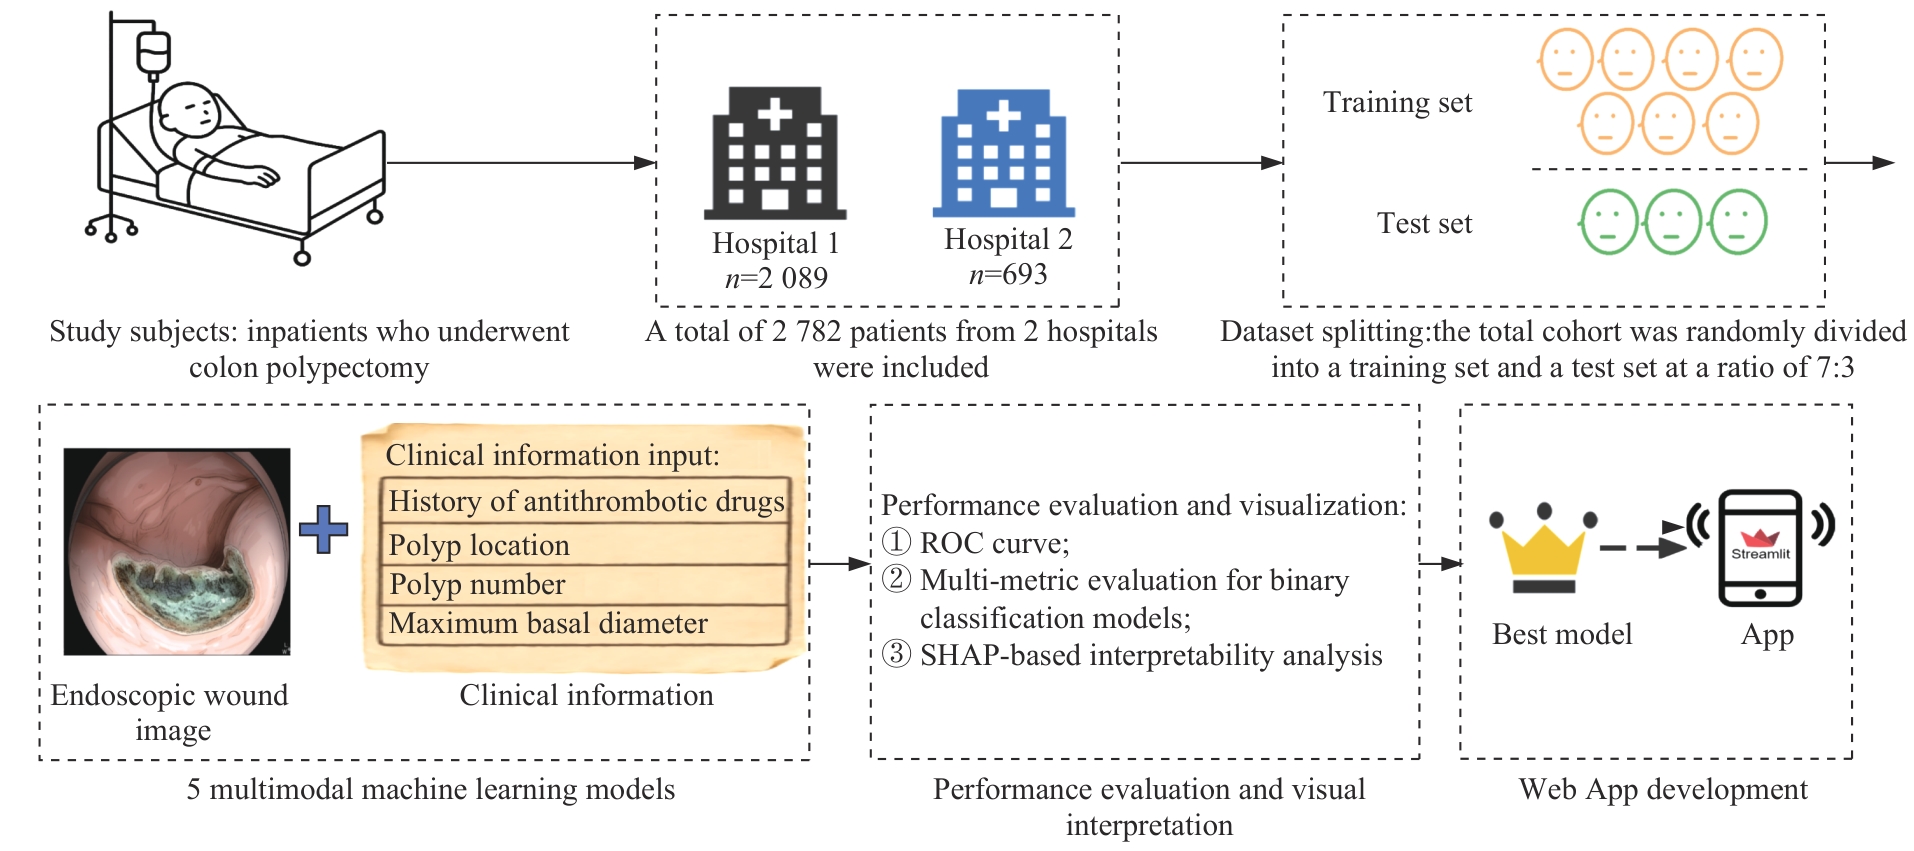
图3 网络APP开发流程
Fig 3 Web App development workflow
| Feature | Training set (n=1 947) | Test set (n=835) | t/Z/χ2 | P value |
|---|---|---|---|---|
| Age/year | 58.50±11.30 | 58.19±10.93 | 0.668 | 0.507 |
| DBIL/(μmol·L-1) | 5.01 (1.73, 8.98) | 4.79 (1.94, 8.14) | 1.801 | 0.214 |
| TBIL/(μmol·L-1) | 29.01 (10.97, 48.23) | 26.47 (11.87, 46.33) | 1.771 | 0.218 |
| Cholesterol/(mmol·L-1 ) | 7.88 (6.76, 8.98) | 7.75 (6.68, 8.80) | 1.959 | 0.047 |
| AST/(U·L-1 ) | 100.59 (78.61, 124.08) | 101.89 (79.45, 122.13) | 0.293 | 0.946 |
| Platelet count/(109·L-1) | 246.20 (186.34, 311.28) | 249.63 (180.30, 311.17) | -0.023 | 0.982 |
| BUN/(mg·dL-1 ) | 6.33 (4.76, 7.86) | 6.29 (4.85, 7.96) | -0.512 | 0.545 |
| ALP/(U·L-1 ) | 110.63 (81.65, 140.05) | 109.15 (80.61, 140.26) | 0.523 | 0.531 |
| BMI/(kg·m-2) | 24.10 (22.10, 26.20) | 24.00 (22.10, 26.20) | 0.316 | 0.667 |
| PT/s | 11.73±0.82 | 11.70±0.86 | 0.804 | 0.415 |
| INR | 1.02 (0.98, 1.06) | 1.02 (0.98, 1.06) | 1.391 | 0.110 |
| Albumin/(g·L-1) | 41.67 (38.33, 44.34) | 41.59 (38.52, 44.49) | -0.711 | 0.712 |
| Maximum basal diameter/cm | 1.76 (1.33, 2.27) | 1.69 (1.29, 2.19) | 2.023 | 0.056 |
| E-Score | 0 (0, 0.02) | 0 (0, 0.03) | -1.512 | 0.042 |
| Smoking/n(%) | 2.496 | 0.114 | ||
| No | 1 801 (92.5) | 787 (94.3) | ||
| Yes | 146 (7.5) | 48 (5.7) | ||
| Alcohol consumption/n(%) | 0.477 | 0.490 | ||
| No | 1 588 (81.6) | 671 (80.4) | ||
| Yes | 359 (18.4) | 164 (19.6) | ||
| Hypertension/n(%) | 949 (48.7) | 420 (50.3) | 0.507 | 0.477 |
| No | ||||
| Yes | 998 (51.3) | 415 (49.7) | ||
| Coronary heart disease/n(%) | 0.342 | 0.559 | ||
| No | 344 (17.7) | 156 (18.7) | ||
| Yes | 1 603 (82.3) | 679 (81.3) | ||
| Gender/n(%) | 1.384 | 0.239 | ||
| Female | 1 026 (52.7) | 461 (55.2) | ||
| Male | 921 (47.3) | 374 (44.8) | ||
| Diabetes mellitus/n(%) | 1 614 (82.9) | 675 (80.8) | 1.560 | 0.212 |
| No | ||||
| Yes | 333 (17.1) | 160 (19.2) | ||
| Pedunculated status/n(%) | 0.761 | 0.383 | ||
| No | 1 370 (70.4) | 573 (68.6) | ||
| Yes | 577 (29.6) | 262 (31.4) | ||
| Antithrombotic drug use history/n(%) | 0.010 | 0.982 | ||
| No | 1 847 (94.9) | 793 (95.0) | ||
| Yes | 100 (5.1) | 42 (5.0) | ||
| Polyp location/n(%) | 5.139 | 0.077 | ||
| Left colon | 769 (39.5) | 334 (40.0) | ||
| Right colon | 571 (29.3) | 273 (32.7) | ||
| Bilateral colon | 607 (31.2) | 228 (27.3) | ||
| Number of polyps/n(%) | 0.153 | 0.696 | ||
| <3 | 1 551 (79.7) | 659 (78.9) | ||
| ≥3 | 396 (20.3) | 176 (21.1) |
表1 训练集与测试集基线资料比较
Tab 1 Comparison of baseline data between the training set and the test set
| Feature | Training set (n=1 947) | Test set (n=835) | t/Z/χ2 | P value |
|---|---|---|---|---|
| Age/year | 58.50±11.30 | 58.19±10.93 | 0.668 | 0.507 |
| DBIL/(μmol·L-1) | 5.01 (1.73, 8.98) | 4.79 (1.94, 8.14) | 1.801 | 0.214 |
| TBIL/(μmol·L-1) | 29.01 (10.97, 48.23) | 26.47 (11.87, 46.33) | 1.771 | 0.218 |
| Cholesterol/(mmol·L-1 ) | 7.88 (6.76, 8.98) | 7.75 (6.68, 8.80) | 1.959 | 0.047 |
| AST/(U·L-1 ) | 100.59 (78.61, 124.08) | 101.89 (79.45, 122.13) | 0.293 | 0.946 |
| Platelet count/(109·L-1) | 246.20 (186.34, 311.28) | 249.63 (180.30, 311.17) | -0.023 | 0.982 |
| BUN/(mg·dL-1 ) | 6.33 (4.76, 7.86) | 6.29 (4.85, 7.96) | -0.512 | 0.545 |
| ALP/(U·L-1 ) | 110.63 (81.65, 140.05) | 109.15 (80.61, 140.26) | 0.523 | 0.531 |
| BMI/(kg·m-2) | 24.10 (22.10, 26.20) | 24.00 (22.10, 26.20) | 0.316 | 0.667 |
| PT/s | 11.73±0.82 | 11.70±0.86 | 0.804 | 0.415 |
| INR | 1.02 (0.98, 1.06) | 1.02 (0.98, 1.06) | 1.391 | 0.110 |
| Albumin/(g·L-1) | 41.67 (38.33, 44.34) | 41.59 (38.52, 44.49) | -0.711 | 0.712 |
| Maximum basal diameter/cm | 1.76 (1.33, 2.27) | 1.69 (1.29, 2.19) | 2.023 | 0.056 |
| E-Score | 0 (0, 0.02) | 0 (0, 0.03) | -1.512 | 0.042 |
| Smoking/n(%) | 2.496 | 0.114 | ||
| No | 1 801 (92.5) | 787 (94.3) | ||
| Yes | 146 (7.5) | 48 (5.7) | ||
| Alcohol consumption/n(%) | 0.477 | 0.490 | ||
| No | 1 588 (81.6) | 671 (80.4) | ||
| Yes | 359 (18.4) | 164 (19.6) | ||
| Hypertension/n(%) | 949 (48.7) | 420 (50.3) | 0.507 | 0.477 |
| No | ||||
| Yes | 998 (51.3) | 415 (49.7) | ||
| Coronary heart disease/n(%) | 0.342 | 0.559 | ||
| No | 344 (17.7) | 156 (18.7) | ||
| Yes | 1 603 (82.3) | 679 (81.3) | ||
| Gender/n(%) | 1.384 | 0.239 | ||
| Female | 1 026 (52.7) | 461 (55.2) | ||
| Male | 921 (47.3) | 374 (44.8) | ||
| Diabetes mellitus/n(%) | 1 614 (82.9) | 675 (80.8) | 1.560 | 0.212 |
| No | ||||
| Yes | 333 (17.1) | 160 (19.2) | ||
| Pedunculated status/n(%) | 0.761 | 0.383 | ||
| No | 1 370 (70.4) | 573 (68.6) | ||
| Yes | 577 (29.6) | 262 (31.4) | ||
| Antithrombotic drug use history/n(%) | 0.010 | 0.982 | ||
| No | 1 847 (94.9) | 793 (95.0) | ||
| Yes | 100 (5.1) | 42 (5.0) | ||
| Polyp location/n(%) | 5.139 | 0.077 | ||
| Left colon | 769 (39.5) | 334 (40.0) | ||
| Right colon | 571 (29.3) | 273 (32.7) | ||
| Bilateral colon | 607 (31.2) | 228 (27.3) | ||
| Number of polyps/n(%) | 0.153 | 0.696 | ||
| <3 | 1 551 (79.7) | 659 (78.9) | ||
| ≥3 | 396 (20.3) | 176 (21.1) |
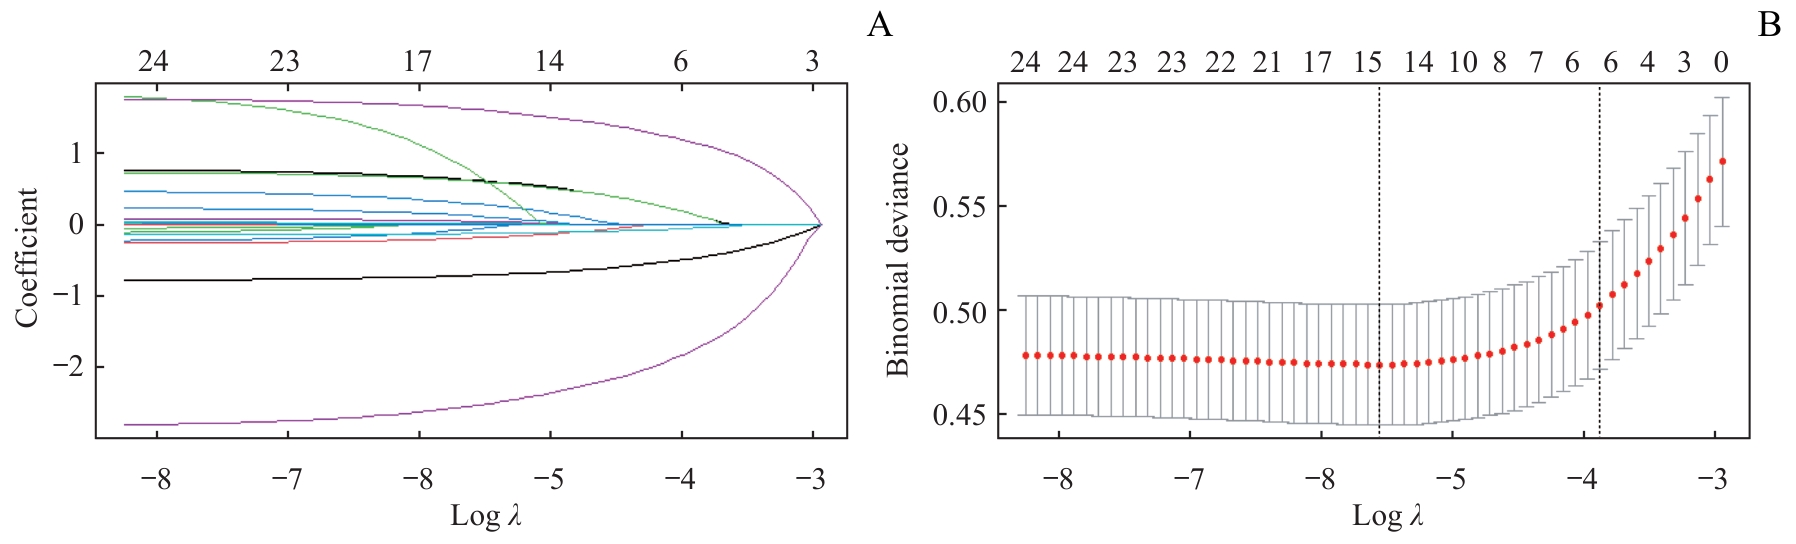
图4 LASSO回归特征筛选过程Note: A. Coefficient path plot of LASSO regression. The horizontal axis represents Log λ, and the vertical axis represents the regression coefficient. As λ increases, the coefficients of some variables gradually shrink toward 0, and finally only the features with the strongest predictive power for the outcome are retained.B. Trend plot of binomial deviance in 5-fold cross-validation. As λ increases, the model deviance first decreases to a minimum and then gradually increases. The red dots represent the average deviance at each λ, and the gray lines represent the standard errors. The two dashed lines represent λ_min and λ_1se respectively.
Fig 4 Feature selection process using LASSO regression
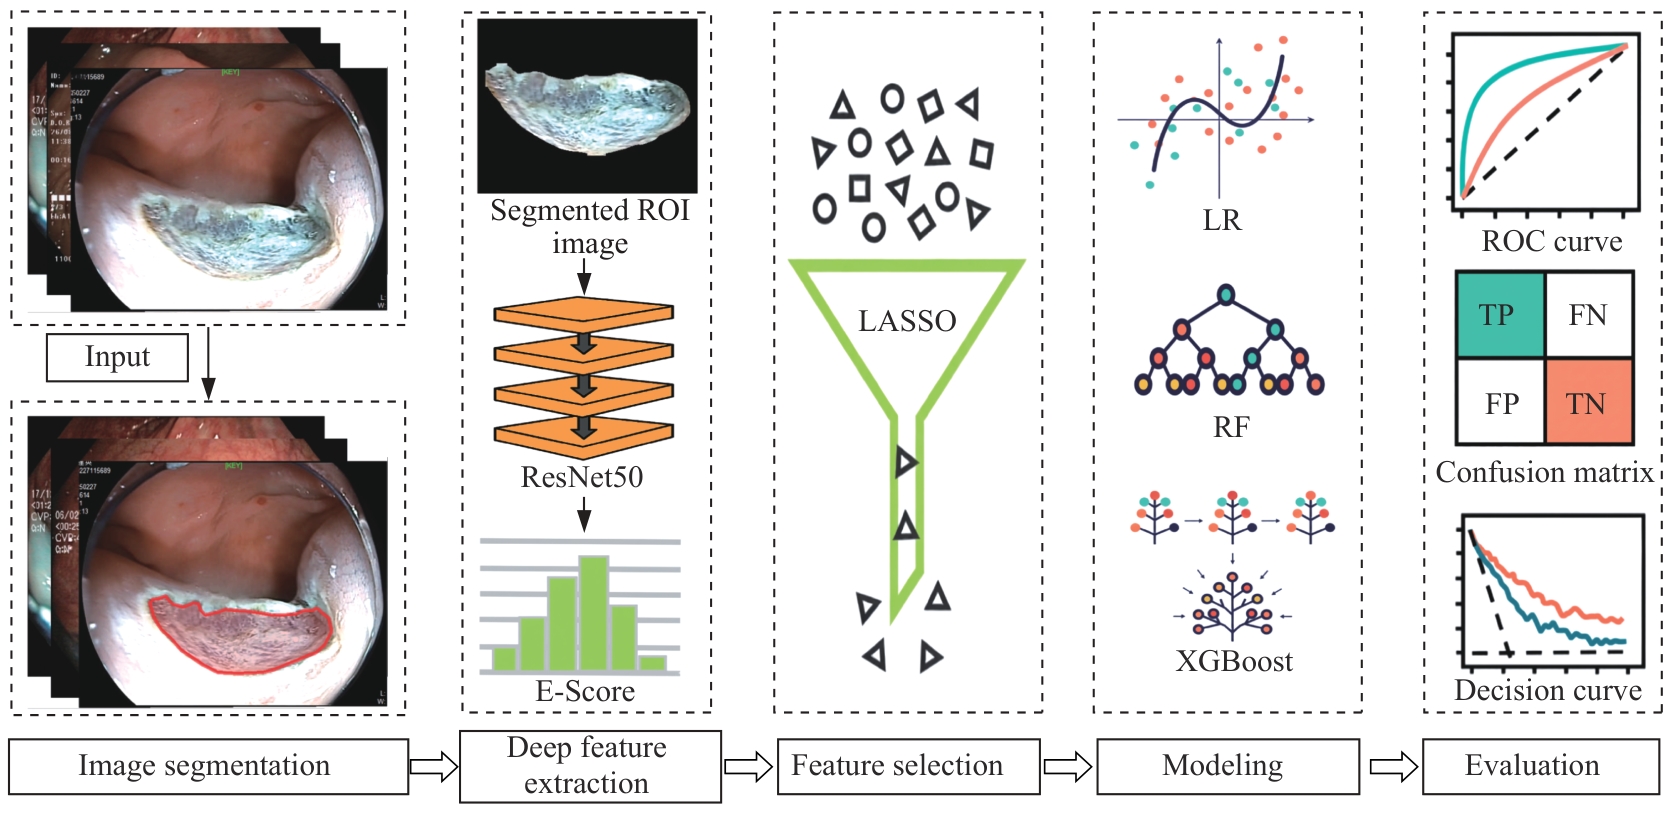
图5 内镜影像组学流程Note: The input image first undergoes image segmentation to obtain the ROI. Subsequently, an end-to-end trained ResNet50 model is used to extract the E-Score from the segmented region. Then, the LASSO method is applied for feature selection. Based on the selected features, machine learning algorithms, including LR, RF, DCT, and XGBoost are used for modeling. Finally, model performance is evaluated using ROC curves, confusion matrices, and decision curve analysis. FN—false negative. FP—false positive. TN—true negative. TP—true positive.
Fig 5 Endoscopic radiomics workflow
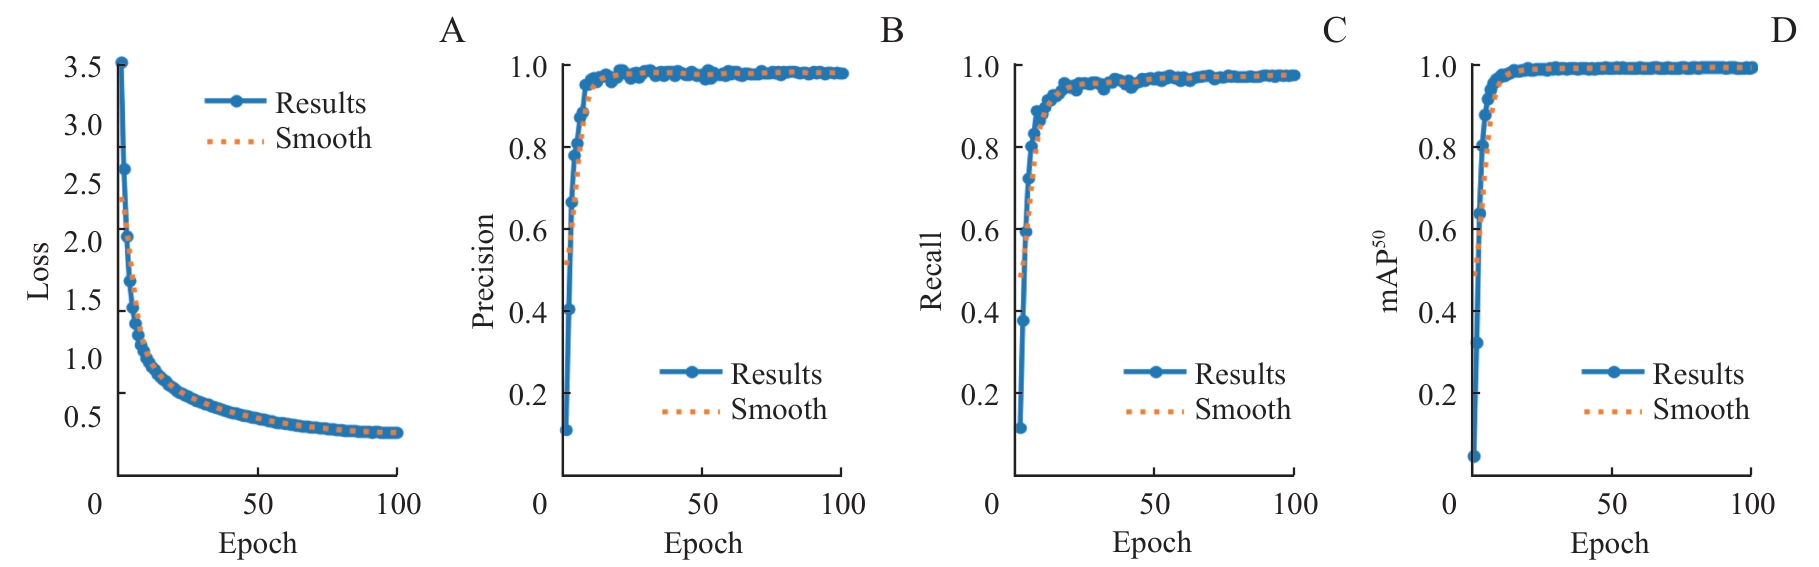
图6 YOLO分割模型在训练集上的性能指标随训练进程的变化Note: A. Change in segmentation loss. B. Change in precision. C. Change in recall. D. Change in mAP50.
Fig 6 Changes in performance metrics of the YOLO segmentation model on the training set with training progress

图7 YOLOv11分割模型分割效果展示Note: A1‒A4. The original images of post-polypectomy wounds. B1‒B4. Segmentation results generated by the trained YOLO v11 segmentation model, where the red regions represent the irregular wound areas automatically identified by the model.
Fig 7 Visualization of segmentation performance of the YOLOv11 model
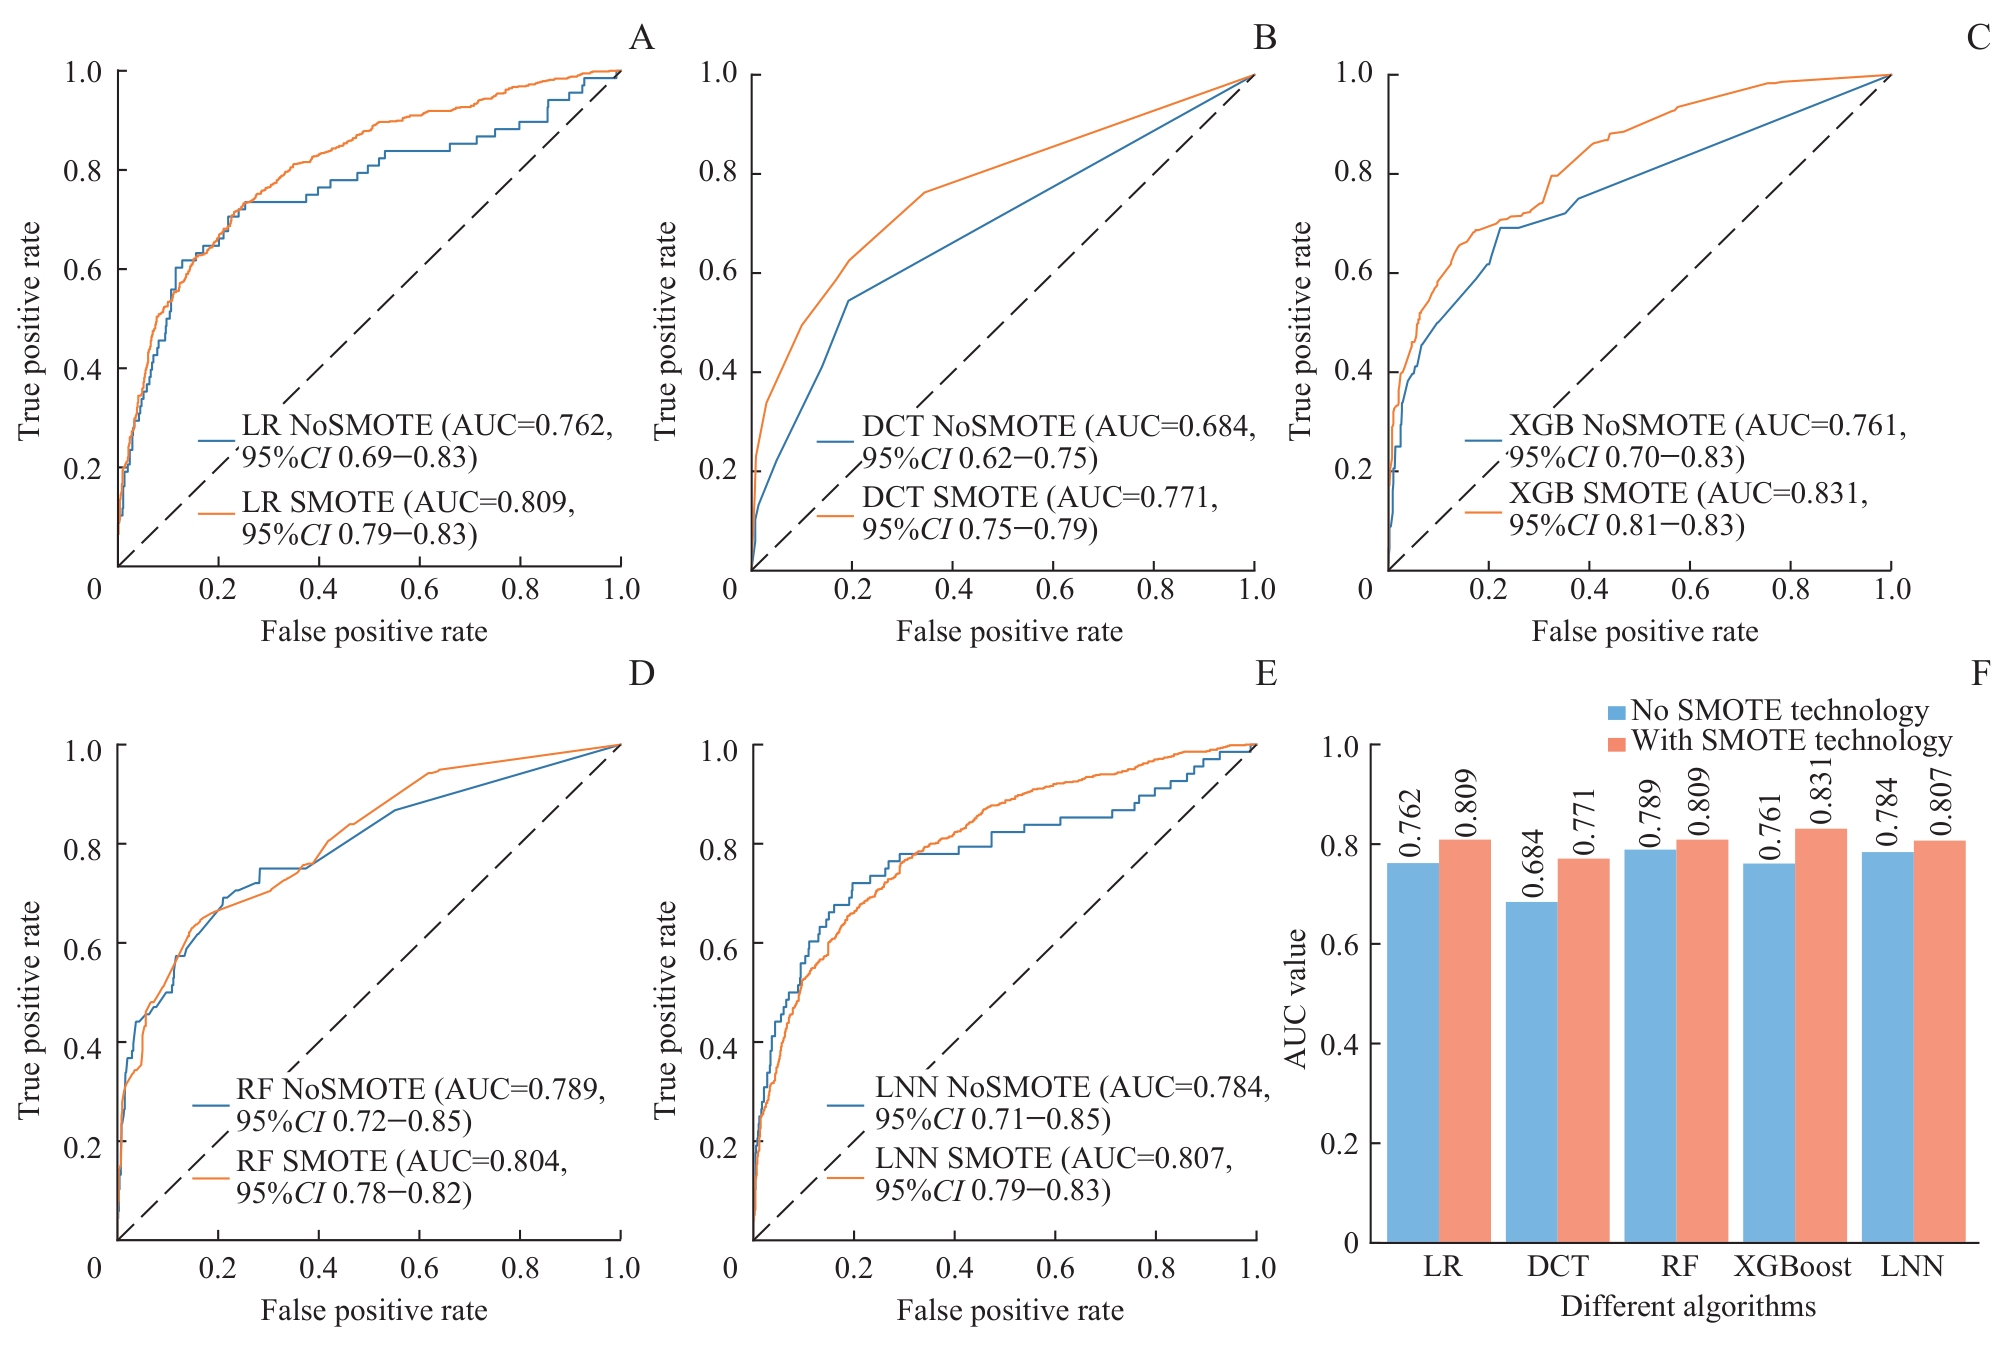
图8 5种模型在应用SMOTE过采样前后的AUC值对比Note: A. LR model. B. DCT model. C. XGBoost model. D. RF model. E. LNN model. F. Bar chart comparison.
Fig 8 Comparison of AUC values of five models before and after applying SMOTE oversampling
| Model | Sensitivity/% | Specificity/% | Accuracy/% | PPV/% | NPV/% | F1 score/% | AUC (95%CI) |
|---|---|---|---|---|---|---|---|
| LR | 71.80 | 76.14 | 73.97 | 75.03 | 73.00 | 73.38 | 0.809 (0.791‒0.833) |
| DCT | 62.53 | 80.57 | 71.56 | 76.27 | 68.29 | 68.72 | 0.771 (0.752‒0.790) |
| RF | 66.06 | 81.10 | 73.58 | 77.73 | 70.52 | 71.42 | 0.804 (0.781‒0.821) |
| XGBoost | 77.28① | 82.27 | 79.78① | 81.32① | 78.39① | 79.25① | 0.831 (0.814‒0.852) |
| LNN | 63.32 | 82.53① | 72.93 | 78.35 | 69.26 | 70.04 | 0.807 (0.790‒0.833) |
表2 5种模型的整体性能指标对比
Tab 2 Comparison of overall performance metrics among the five models
| Model | Sensitivity/% | Specificity/% | Accuracy/% | PPV/% | NPV/% | F1 score/% | AUC (95%CI) |
|---|---|---|---|---|---|---|---|
| LR | 71.80 | 76.14 | 73.97 | 75.03 | 73.00 | 73.38 | 0.809 (0.791‒0.833) |
| DCT | 62.53 | 80.57 | 71.56 | 76.27 | 68.29 | 68.72 | 0.771 (0.752‒0.790) |
| RF | 66.06 | 81.10 | 73.58 | 77.73 | 70.52 | 71.42 | 0.804 (0.781‒0.821) |
| XGBoost | 77.28① | 82.27 | 79.78① | 81.32① | 78.39① | 79.25① | 0.831 (0.814‒0.852) |
| LNN | 63.32 | 82.53① | 72.93 | 78.35 | 69.26 | 70.04 | 0.807 (0.790‒0.833) |
图9 可供分享和便携使用的网络应用工具
Fig 9 Web application for sharing and portable use
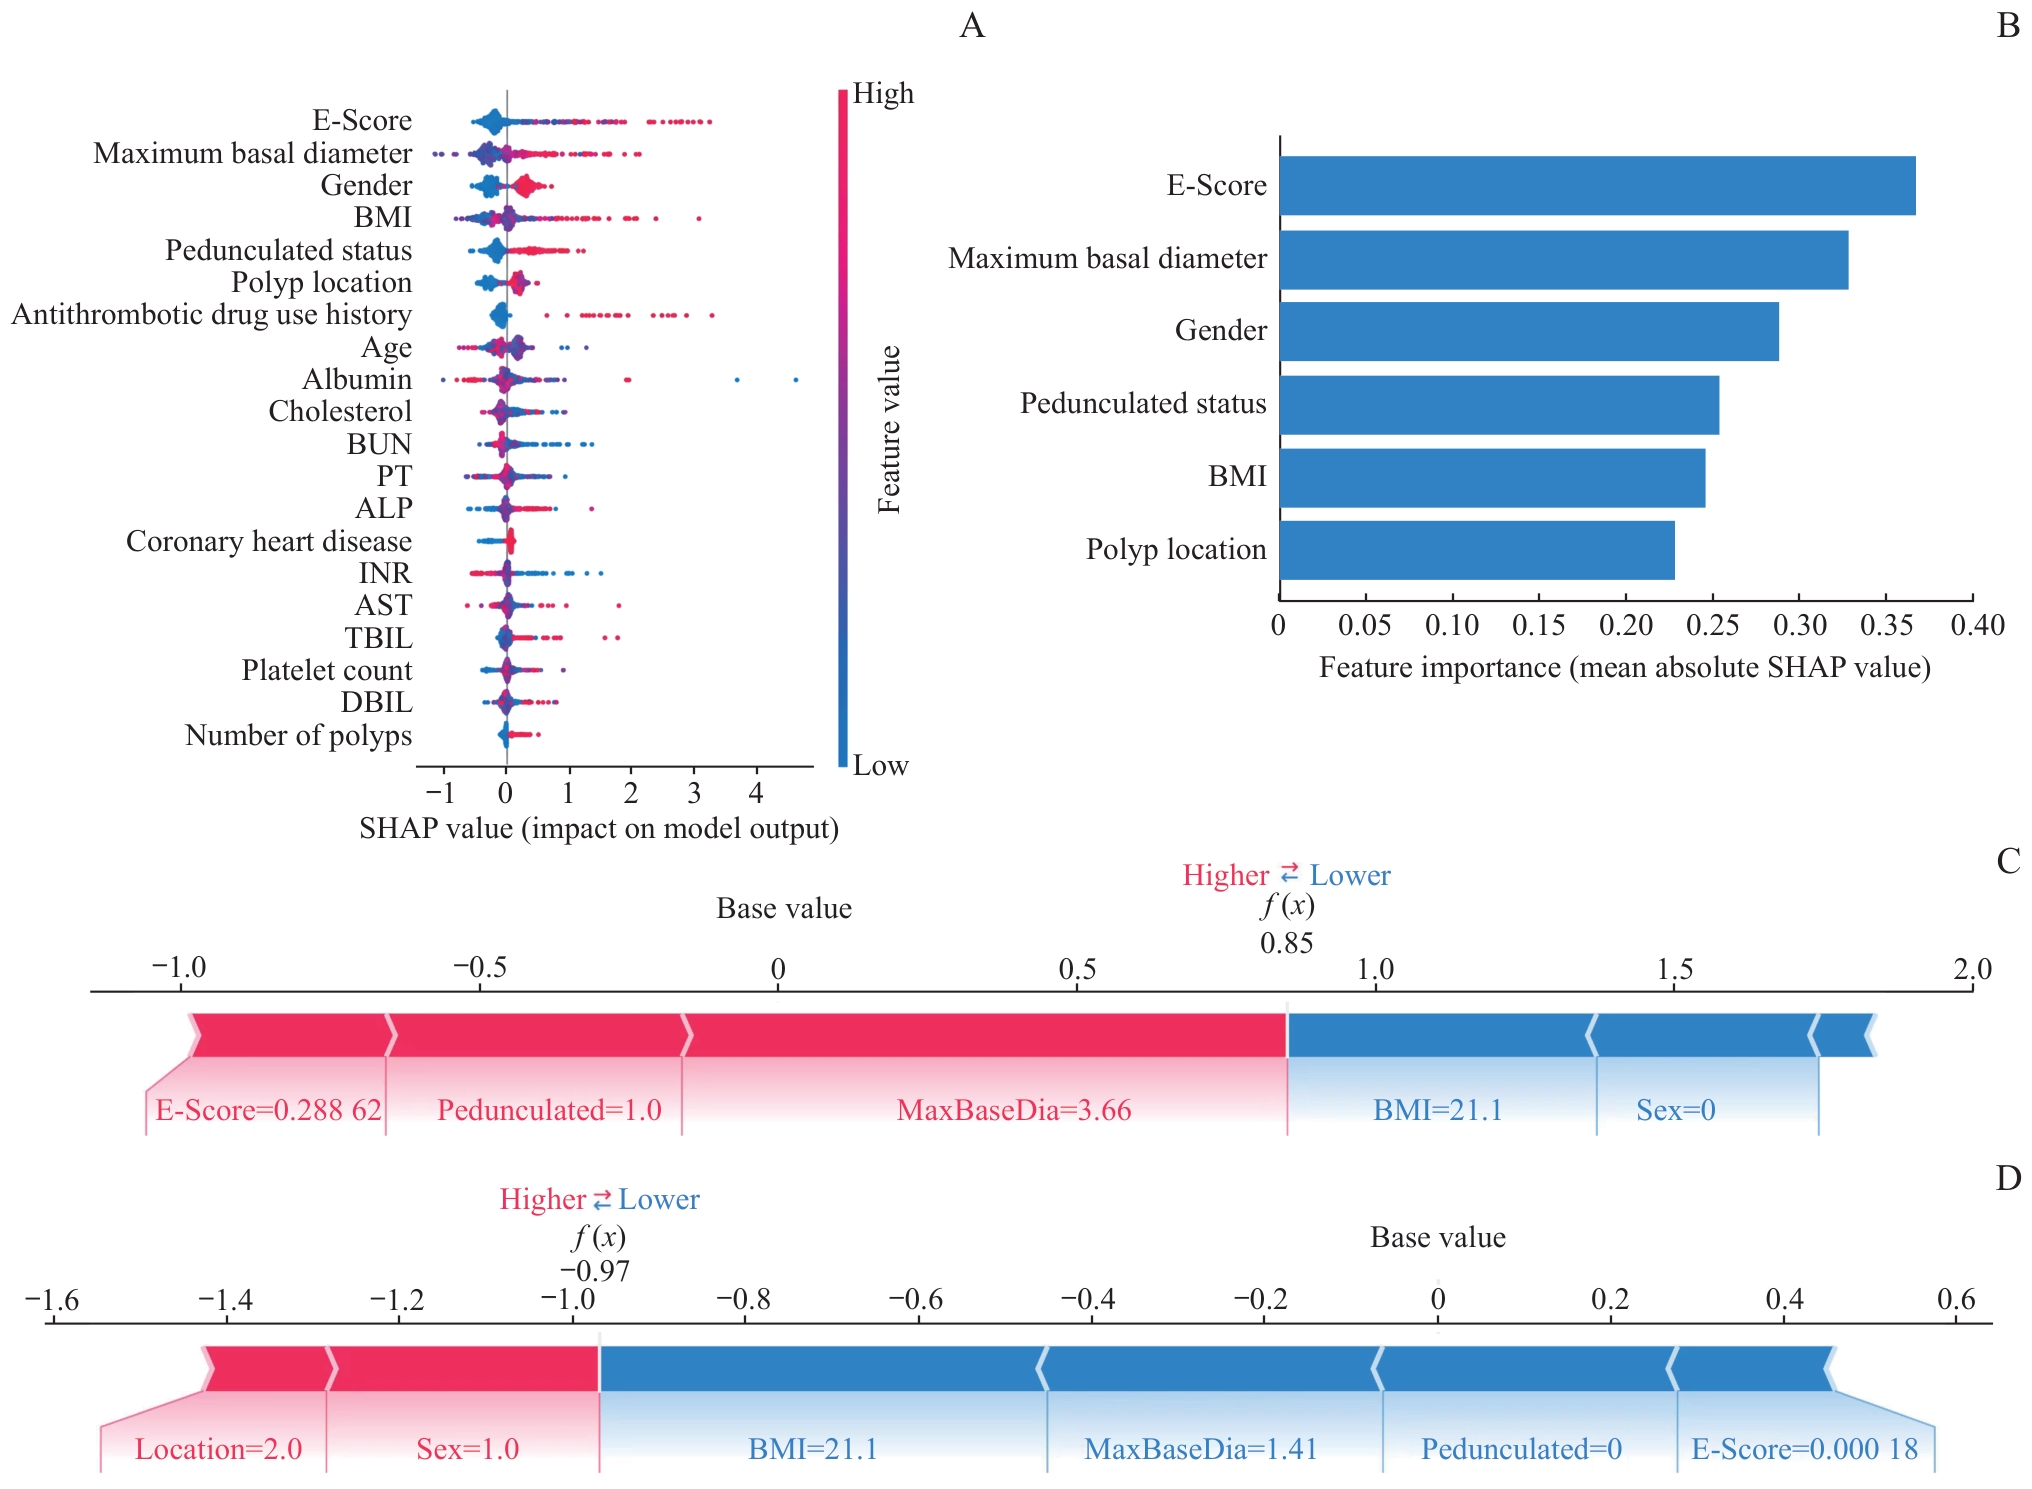
图10 XGBoost 模型在测试集上的可视化解释
Fig 10 Visualization of the XGBoost model on the test set
| [1] | Bray F, Laversanne M, Sung H, et al. Global cancer statistics 2022: GLOBOCAN estimates of incidence and mortality worldwide for 36 cancers in 185 countries[J]. CA Cancer J Clin, 2024, 74(3): 229-263. |
| [2] | Lopes S R, Martins C, Santos I C, et al. Colorectal cancer screening: a review of current knowledge and progress in research[J]. World J Gastrointest Oncol, 2024, 16(4): 1119-1133. |
| [3] | Brenner H, Chang-Claude J, Seiler C M, et al. Protection from colorectal cancer after colonoscopy: a population-based, case-control study[J]. Ann Intern Med, 2011, 154(1): 22-30. |
| [4] | Shaukat A, Levin T R. Current and future colorectal cancer screening strategies[J]. Nat Rev Gastroenterol Hepatol, 2022, 19(8): 521-531. |
| [5] | Gupta S, Lieberman D, Anderson J C, et al. Recommendations for follow-up after colonoscopy and polypectomy: a consensus update by the US multi-society task force on colorectal cancer[J]. Gastrointest Endosc, 2020, 91(3): 463-485.e5. |
| [6] | Jaruvongvanich V, Prasitlumkum N, Assavapongpaiboon B, et al. Risk factors for delayed colonic post-polypectomy bleeding: a systematic review and meta-analysis[J]. Int J Colorectal Dis, 2017, 32(10): 1399-1406. |
| [7] | 王禹毅, 卜志军, 李元晞, 等. 临床预测模型变量筛选方法及比较[J]. 现代中医临床, 2024, 31(2): 6-12. |
| Wang Y Y, Bu Z J, Li Y X, et al. Variable selection methods and comparison in clinical prediction models[J]. Modern Clinical Chinese Medicine, 2024, 31(2): 6-12. | |
| [8] | Cao J, Long S K, Liu H, et al. Constructing a prediction model for acute pancreatitis severity based on liquid neural network[J]. Sci Rep, 2025, 15(1): 16655. |
| [9] | Zhang R F, Yin M Y, Jiang A Q, et al. Application value of the automated machine learning model based on modified computed tomography severity index combined with serological indicators in the early prediction of severe acute pancreatitis[J]. J Clin Gastroenterol, 2024, 58(7): 692-701. |
| [10] | Liu L J, Zhang R F, Shi Y, et al. Automated machine learning for predicting liver metastasis in patients with gastrointestinal stromal tumor: a SEER-based analysis[J]. Sci Rep, 2024, 14(1): 12415. |
| [11] | Russell B C, Torralba A, Murphy K P, et al. LabelMe: a database and web-based tool for image annotation[J]. Int J Comput Vis, 2008, 77(1): 157-173. |
| [12] | Shin H C, Roth H R, Gao M C, et al. Deep convolutional neural networks for computer-aided detection: CNN architectures, dataset characteristics and transfer learning[J]. IEEE Trans Med Imaging, 2016, 35(5): 1285-1298. |
| [13] | Handelman G S, Kok H K, Chandra R V, et al. Peering into the black box of artificial intelligence: evaluation metrics of machine learning methods[J]. AJR Am J Roentgenol, 2019, 212(1): 38-43. |
| [14] | Nohara Y, Matsumoto K, Soejima H, et al. Explanation of machine learning models using shapley additive explanation and application for real data in hospital[J]. Comput Meth Programs Biomed, 2022, 214: 106584. |
| [15] | Fahmy A S, Csecs I, Arafati A, et al. An explainable machine learning approach reveals prognostic significance of right ventricular dysfunction in nonischemic cardiomyopathy[J]. JACC Cardiovasc Imaging, 2022, 15(5): 766-779. |
| [16] | Bendall O, James J, Pawlak K M, et al. Delayed bleeding after endoscopic resection of colorectal polyps: identifying high-risk patients[J]. Clin Exp Gastroenterol, 2021, 14: 477-492. |
| [17] | Zhang X Z, Jiang X X, Shi L. Risk factors for delayed colorectal postpolypectomy bleeding: a meta-analysis[J]. BMC Gastroenterol, 2024, 24(1): 162. |
| [18] | Albouys J, Montori Pina S, Boukechiche S, et al. Risk of delayed bleeding after colorectal endoscopic submucosal dissection: the Limoges Bleeding Score[J]. Endoscopy, 2024, 56(2): 110-118. |
| [19] | Lu Y, Zhou X Y, Chen H, et al. Establishment of a model for predicting delayed post-polypectomy bleeding: a real-world retrospective study[J]. Front Med, 2022, 9: 1035646. |
| [20] | 王敏, 韦雪连, 李常伟, 等. 内镜下结直肠腺瘤性息肉的特征及经切除术后迟发出血的危险因素分析[J]. 胃肠病学和肝病学杂志, 2024, 33(6): 714-718. |
| Wang M, Wei X L, Li C W, et al. Characteristics of colorectal adenomatous polyps under endoscopy and analysis of risk factors for delayed bleeding after resection[J]. Chinese Journal of Gastroenterology and Hepatology, 2024, 33(6): 714-718. | |
| [21] | 陈健, 王珍妮, 夏开建, 等. 基于深度学习的结直肠息肉内镜图像分割和分类方法比较[J]. 上海交通大学学报(医学版), 2024, 44(6): 762-772. |
| Chen J, Wang Z N, Xia K J, et al. Comparative study on methods for colon polyp endoscopic image segmentation and classification based on deep learning[J]. Journal of Shanghai Jiao Tong University (Medical Science), 2024, 44(6): 762-772. |
| [1] | 尹梓名, 王荣钦, 杨自逸, 刘颖斌, 陈涛, 束翌俊, 龚伟. 基于图神经网络的胆囊癌CT影像辅助诊断模型[J]. 上海交通大学学报(医学版), 2025, 45(9): 1221-1231. |
| [2] | 黄昕, 刘家辉, 叶敬文, 钱文莉, 许万星, 王琳. 基于机器学习的小细胞肺癌代谢分子诊断模型的建立和临床应用[J]. 上海交通大学学报(医学版), 2025, 45(8): 1009-1016. |
| [3] | 阮青青, 苏树智, 李延婷, 任渊, 戴勇, 乔增勇. 急性心肌梗死介入治疗并发症风险预测模型构建[J]. 上海交通大学学报(医学版), 2025, 45(12): 1589-1597. |
| [4] | 禹志远, 董海平, 高楠, 马柯. 背根神经节吗啡耐受核心基因筛选与机制研究:加权基因共表达网络分析和机器学习的转录组学整合策略[J]. 上海交通大学学报(医学版), 2025, 45(10): 1308-1319. |
| [5] | 吴其蓁, 刘启明, 柴烨子, 陶政宇, 王依楠, 郭欣宁, 姜萌, 卜军. 机器学习预测乳腺癌新辅助治疗后炎症代谢状态改变的模型评价[J]. 上海交通大学学报(医学版), 2024, 44(9): 1169-1181. |
| [6] | 许万星, 王琳, 郭巧梅, 王薛庆, 娄加陶. 多模态肺结节诊断模型的临床验证及应用价值探索[J]. 上海交通大学学报(医学版), 2024, 44(8): 1030-1036. |
| [7] | 陈健, 王珍妮, 夏开建, 王甘红, 刘罗杰, 徐晓丹. 基于深度学习的结直肠息肉内镜图像分割和分类方法比较[J]. 上海交通大学学报(医学版), 2024, 44(6): 762-772. |
| [8] | 刘洋, 吴梦怡, 胡尧, 亓坤, 王渝彬, 赵悦, 宋锦璘. 基于Transformer和扩散模型的头颅侧位片颈椎分割方法在正畸临床中的初步应用[J]. 上海交通大学学报(医学版), 2024, 44(12): 1579-1586. |
| [9] | 马奔, 赵成, 束翌俊, 董平. CT影像组学在胃肠道间质瘤中的应用进展[J]. 上海交通大学学报(医学版), 2023, 43(7): 923-930. |
| [10] | 赵珂珂, 蒋蓓蓓, 张璐, 王凌云, 张亚平, 解学乾. 超低剂量平扫CT深度学习图像重建评价肺部病灶的可行性[J]. 上海交通大学学报(医学版), 2022, 42(8): 1062-1069. |
| [11] | 林嘉希, 汪盛嘉, 赵鑫, 高欣, 殷民月, 朱锦舟. 基于深度卷积神经网络的Barrett食管内镜图片分类模型的建立[J]. 上海交通大学学报(医学版), 2022, 42(5): 653-659. |
| [12] | 陈立奇, 薛卓维, 吴氢凯. 基于磁共振成像的女性盆底器官三维数字模型重建的研究进展[J]. 上海交通大学学报(医学版), 2022, 42(3): 381-386. |
| [13] | 李欣, 范青. 机器学习在抑郁症患者面部特征研究中的应用进展[J]. 上海交通大学学报(医学版), 2022, 42(1): 124-129. |
| [14] | 李小敏, 曲扬, 张少霆, 赵亮, 刘畅, 谢帅宁, 戴尅戎, 艾松涛. 人工智能技术在骨肌系统影像学方面的应用[J]. 上海交通大学学报(医学版), 2021, 41(2): 262-266. |
| [15] | 陆言巧,沈 兰,何 奔. 人工智能在心血管疾病的辅助诊疗中的应用[J]. 上海交通大学学报(医学版), 2020, 40(2): 259-. |
| 阅读次数 | ||||||
|
全文 |
|
|||||
|
摘要 |
|
|||||